
|
Geological Survey Professional Paper 631
Analysis of a 24-Year Photographic Record of Nisqually Glacier, Mount Rainier National Park, Washington
|
QUANTITATIVE INTERPRETATIONS FROM THE PHOTOGRAPHS
CHANGES IN ICE THICKNESS
Annual photographs can readily be used for analyzing
the approximate year-to-year changes in a glacier's thickness. Three
examples are described below, using lateral ice margins, the crest of
the ice as seen in lateral views, and the crest of an ice bulge as
viewed from down glacier.
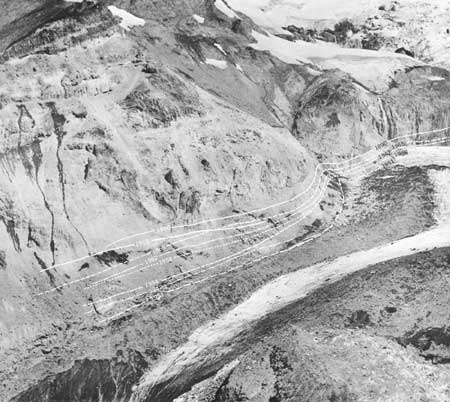
In the first example, on each annual photograph in
series 7 (selected years of which are shown in figs. 2-5) a smoothed
line was drawn for a few thousand feet along the west ice
margin3 downstream from Wilson
Glacier. The positions of several points on each marginal line were then
defined by measuring down to them, on the pictures, from a series of
fixed points (bedrock features) along the canyon wall identifiable on
all the photographs studied. Next, the distances so measured were
adjusted to the scale of the August 23, 1951, view, which year was
selected as the year of minimum ice in that area. The scale adjustment
was done by means of scale-ratio measurements made between several fixed
points identifiable on all the prints. Using the converted distances,
the lines were transferred to the 1951 print (fig. 6).
3The margin is the apparent edge of the
moving ice, whether it is obscured by detritus or not.
|
|
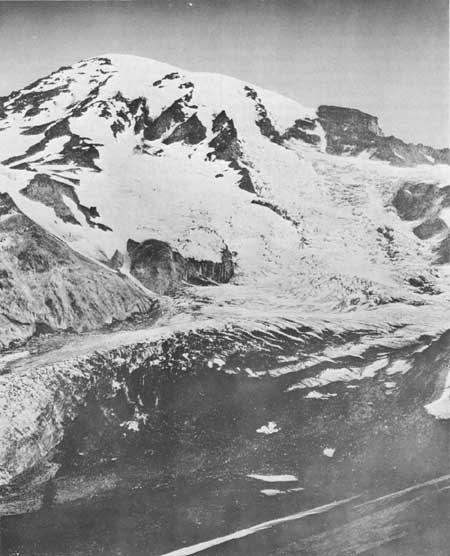
Figure 2.—Nisqually Glacier, from confluence
with Wilson Glacier to the nunatak, as seen from station 7 in 1890 (date uncertain).
(Figures 2-5 were photographed from the same viewpoint as weas used for the
photograph published in the Geological Survey's Annual Report for 1896-97
(Russell, 1898).) Note some similarities to 1963 view in regard to extent
of ice and patterns of crevassing; note also the absence of a large moraine
near the west canyon wall. Photograph is believed to have been taken in
1890 by W. O. Amsden, but may have been taken in 1896 by a member of the
I. C. Russell (U.S. Geological Survey) reconaissance party. (click on
image for an enlargement in a new window)
|
|
|
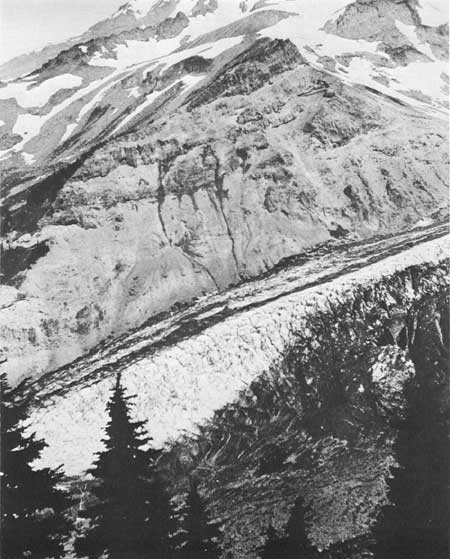
Figure 3.—Nisqually Glacier, from confluence with Wilson
Glacier to the nunatak, as seen from station 7 in August 1915 by G. L. Parker, U.S. Geological
Survey. This view was taken from a slightly different location than the others in series 7;
it was higher on the hillside, with camera pointed farther to left. Note (as is graphically
verified in fig. 6) how the conformation of the surface slope of the ice along the west canyon
wall was different in 1915 than in 1963 or 1965, and how during the intervening half century
many changes in exposure of the rock formations occurred. Note also the two moraines near
far edge of glacier, marked by debris lines. (click on image for an
enlargement in a new window)
|
|
|
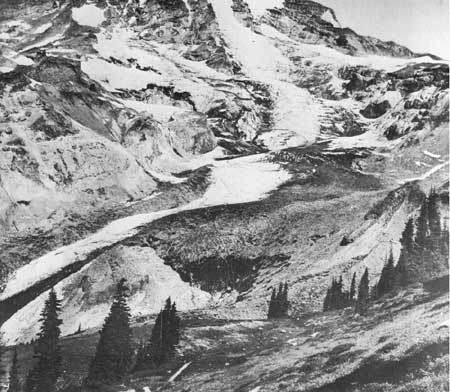
Figure 4.—Nisqually Glacier, from confluence
with Wilson Glacier to the nunatak, as seen from station 7 on August 22, 1945. Upper
part of glacier is at about its lowest known ice mass, as evidenced by the exposure
of bedrock. There is almost no crevassing in middle reach. Slope at profile 2
(location in fig. 20) is very flat and broken below there. Note the light-colored
medial moraine approaching nunatak from upper right. Sources of debris may be
deduced. Note also large ice-cored moraine along west edge of glacier.
(click on image for an enlargement in a new window)
|
|
|
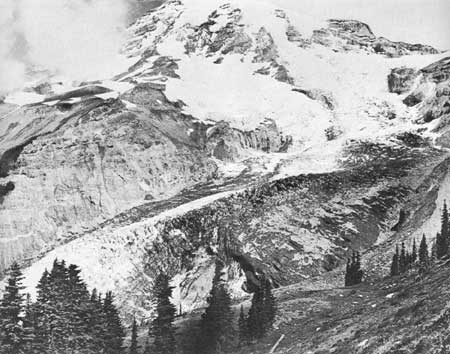
Figure 5—Nisqually Glacier, from
confluence with Wilson Glacier to the nunatak, as seen from station 7
on August 27, 1963. Note transverse crevasses developing in east part
of glacier above nunatak indicating the direct down-valley movement
of that ice. Ice-cored moraine seen in figure 4 is now subdued because
of the rejuvenated movement. Note that since 1945 the glacier has
recovered much of the volume evident in the 1890 view. (click on
image for an enlargement in a new window)
|
|
|
Figure 6.—Ice margins for selected years
in period 1890-1965 are indicated on the series 7 photograph taken August 23,
1951. Note that by 1965 the glacier had recovered much of the ice thickness
it had lost since 1890. (click on image for an enlargement in a new
window)
|
Most of these ice-margin lines are believed to be
accurate to ± 20 feet (6 m) vertically or horizontally. The
greatest source of error is in the subjective determination of the
location of the margin of the active ice for each year because the
margin is obscured in many places by varying amounts of remnant ice,
snow, or rock debris.
In the series 7 photographs, the valley wall is about
3,300 feet (1,000 m) away from the camera opposite the middle of the
nunatak and 7,500 feet (2,300 m) away just below Wilson Glacier. The
approximate vertical scale of the valley wall on a photograph could
readily be calculated from these distances and the camera's focal
length.
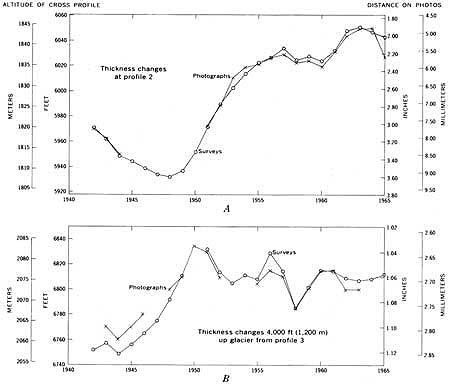
In the second example of ice thickness analysis, data
for the graphical plotting of the changes in ice-surface elevation at a
single cross-profile axis were derived as follows. On each annual print
of series 14—W (figs. 7-10) the distance was measured between a
selected rock feature on the canyon wall directly opposite the
photographic station and the ice margin directly below it. The results
were converted to a common-scale basis with respect to the print for
year of the lowest ice, 1951, as was described in the previous example,
and the values were plotted graphically against time (fig. 11A)
and compared with the thickness changes indicated by the annual
cross-profile surveys. The graph of thickness changes measured on the
photographs could not be given a vertical scale in feet (or meters)
unless it were obtained by comparison with field survey results, as is
this case, or by geometrical computation using map data and the camera
lens focal length.
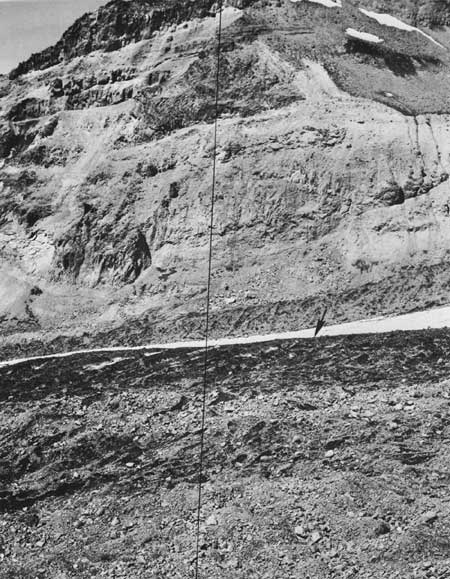
|
|
Figure 7.—View across glacier in series
14—W (profile 2) used to determine sloep and changes in ice thickness;
photographed on August 21, 1942. The vertical line used in measuring angle
of slope of the ice surface is shown. Not indicated is the bedrock feature
from which the changes in ice-surface elevation were measured. The apparent
crest of the debris-covered ice (arrow), rather than the white ice, was
averaged to compute slope and changes in thickness in this and all other
views in this series. Note that the hand-held camera had been titled, due
to the deceptiveness of the true slope of the glacier. (click on
image for an enlargement in a new window)
|
|
|
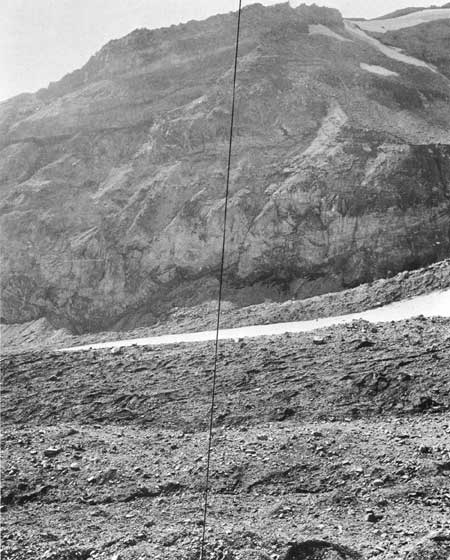
Figure 8.—View across glacier in series 14—W
(profile 2) used to determine slope and changes in ice thickness; photographed on August
27, 1952. The vertical line used in measuring angle of slope is shown. Note the relief
visible in the canyon wall, which is not at all apparent in the views that were taken in
1942, 1960, and 1965 under flatter lighting. (click on image for an
enlargement in a new window)
|
|
|
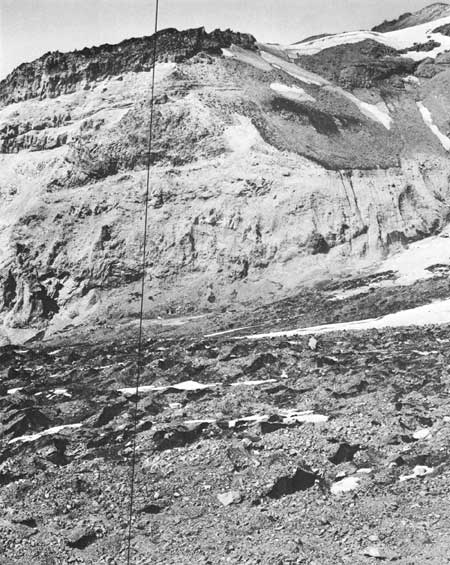
Figure 9.—View across glacier in series
14—W (profile 2) used to determine slope and changes in ice thickness;
photographed on September 8, 1960. The vertical line used in measuring angle
of slope of the ice is shown. Note that glacier surface in this area has
become much rougher since 1952 (fig. 8), and the streak of white (clear) ice
is now hidden behind the thickened zone of crevassed, debris-covered
ice. (click on image for an enlargement in a new window)
|
|
|
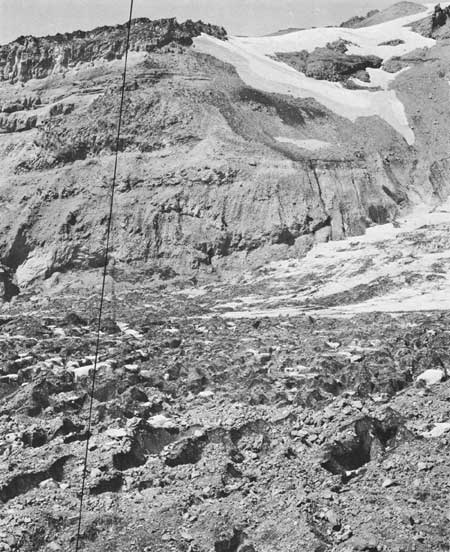
Figure 10.—View across glacier in series 14—W (profile
2) used to determine slope and changes in ice thickness; photographed on August 30, 1965. The
vertical line used in measuring angle of slope is shown. Note that the crevassing is more
pronounced than it was in the 1960 view (fig. 9), and there is less contrast between clear
and debris-covered ice. (click on image for an enlargement in a new window)
|
On the graph in figure 11A the scale of the photographic
measurements was adjusted to closely fit the scale to which the
field surveys were plotted. There are a few small inconsistencies
between the field surveys and photographic measurements in figure 11A,
probably due to the low vertical angle between the camera viewpoint and
the distant ice margin which is not always clearly visible. Still, such
a graph for a valley glacier lying between steep canyon walls is roughly
indicative of the changes in ice thickness in the entire cross section
of the glacier opposite the point of measurement.
|
|
Figure 11.—Graphs showing changes in ice-surface
elevation, or thickness, of the glacier. A, Changes in glacier thickness at
cross profile 2 as measured on photographs are compared graphically with results
of the annual stadia surveys. It should be noted that each stadia survey value
used in the comparisons is the average ice-surface elevation along the cross profile,
but each photographic measurement is made from a bedrock feature in the canyon wall
down to only one point, selected in each photograph as either the apparent crest or
a representative point useful for the purpose. B, Changes in ice-surface
elevation as measured on photographs at an ice bulge nearly 4,000 feet (1,200 m)
upglacier from profile 3 are compared graphically with the results of annual stadia
surveys at profile 3. The values from photographs are obtained by measuring from a
fixed point on bedrock down to the top of the ice bulge as it is seen in profile
from down glacier at station 15 (fig. 12). (click on image for an
enlargement in a new window)
|
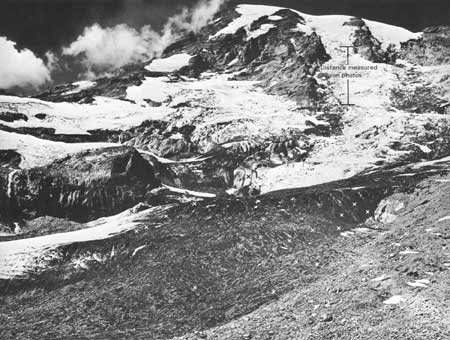
A third example of a method of determining ice
thickness variations from photographs utilizes the measurement reach
indicated on the 1944 view in photographic series 15 (fig. 12) taken
looking up glacier. In the annual photographs of series 15, distances
were measured down from a bedrock feature to the crest, as seen from the
photographic station, of a "standing" wave or bulge in the glacier
surface nearly 4,000 feet (1,200 m) up glacier from profile 3 at an
altitude of 8,400 ± 100 feet (2,560 ± 30 m). This bulge
(fig. 12) occurs at the downstream end of a reach of relatively flat
slope, and its crest is seen in profile when looking upstream from
below. The distances so measured were plotted against time, using an
estimated vertical scale, and thus their fluctuations were compared with
the stadia surveys of profile 3 (fig. 11B). Though without a true
vertical scale in feet (or meters), these results are indicative of the
fluctuations in position of the ice surface at that site during glacier
advance or recession. In this example the values are believed to be
accurate to within plus or minus 25 feet (8 m).
|
|
Figure 12.—Changes in ice thickness occurring about
4,000 feet (1,200 m) up glacier from profile 3, were measured on the photographs in
series 15 in the reach indicated on this September 3, 1944, view from that series;
upper end of measurement is the base of a lava flow and lower end is top of the ice.
This 1944 view illustrates the general nature of the upper area after many years of
recession had occurred, just preceding the ice advance of the late 1940's. The ice
discharge from Wilson Glacier is low, and large areas of bedrock near its mouth are
exposed. The falls at far left are relatively large compared with their condition in
later years (1957-65). Note the opposite directions of cleavage in crevassing patterns
which are visible in midglacier at lower left. It is evident that the debris load comes
from sources along both sides of Nisqually Glacier and from Wilson Glacier. Bedrock
areas marked by small X's were inundated by ice as the glacier thickened and expanded
(compare with fig. 34 which shows this area in 1965). (click on image
for an enlargement in a new window)
|
It is most interesting that thickness changes were
nearly synchronous at profile 3 and at the bulge 1.2 km above profile
3. The minor inconsistencies between the graphs in figure 11B may
possibly be caused by differences in timing of the ice advances of
Wilson Glacier with respect to those of Nisqually Glacier above Wilson
Glacier. An attempt was made to check this timing, but the results were
not satisfactory. The reason for this may be the small upward angle of
view in the photographs of the top of any ice bulge on Wilson Glacier;
they do not place the lip of the bulge sufficiently in outline or
profile. Another source of inconsistency may be the irregular changing
shape of the top of the ice bulge occurring from year to year.
pp/631/sec3.htm
Last Updated: 01-Mar-2006
|


