|
Texas Bureau of Economic Geology
Padre Island National Seashore: A Guide to the Geology, Natural Environments, and History of a Texas Barrier Island |
THE DYNAMIC BARRIER ISLAND
(continued)
WINDS AND DUNES ON PADRE ISLAND — A DYNAMIC SYSTEM
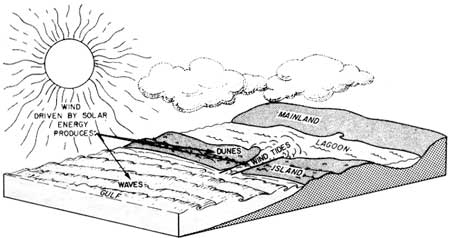
Driven by solar energy, winds are perhaps the most important geologic agent at work on barrier-island and associated Gulf and lagoon environments (fig. 38). Winds create waves that break and dissipate their energy in the surf and swash zones, depositing, eroding, and reworking sediments, and forming currents that transport large amounts of sand alongshore. Wind-driven tides also dramatically affect water levels and circulation patterns, particularly in Laguna Madre. But the wind's influence does not end at the water line. Winds are the driving force behind sand dunes that have so significantly shaped and modified the surface of Padre Island.
An important question arises: If the winds blow primarily from two different quadrants, that is, the southeast and northeast quadrants (fig. 23), in which direction is most sand on the island being transported, and how does the transport direction relate to the two dominant wind directions?
Winds as Agents of Sediment Transport
Wind frequency data alone, depicting the amount of time or the frequency with which the wind blows from a specific direction, indicate that southeast winds should have the greatest control over direction of sand migration (fig. 5). Of course, wind velocity is also an important factor. Without sufficient velocity, winds blowing year round from a single direction will transport little sand. Moreover, if the wind is blowing hard enough to transport sand, a small increase in velocity will substantially increase the amount of sand that is being transported. For example, Bagnold (1954) noted that "a strong wind blowing at 16 meters per second, or 35 miles an hour, will move as much sand in 24 hours as would be moved in 3 weeks by a wind blowing steadily at 8 meters per second, or 17.5 miles an hour."
Weather records maintained at Corpus Christi indicate that velocities of winds from both the northeast and the southeast quadrants are often strong enough to transport sand. North to northeasterly winds are often characterized by high velocities, but the frontal systems from which these winds originate are relatively shortlived and are sometimes accompanied by rain that moistens the sand and holds it in place, thus diminishing the transporting power of the winds. Do the dunes and associated eolian features on Padre Island contain evidence or clues that reflect the major wind systems and the ultimate direction of sand migration? Before looking for the evidence, it will be helpful to consider, in general and greatly simplified terms, some typical characteristics of dunes and related features.
Characteristics of Dunes and Associated Deflation Areas
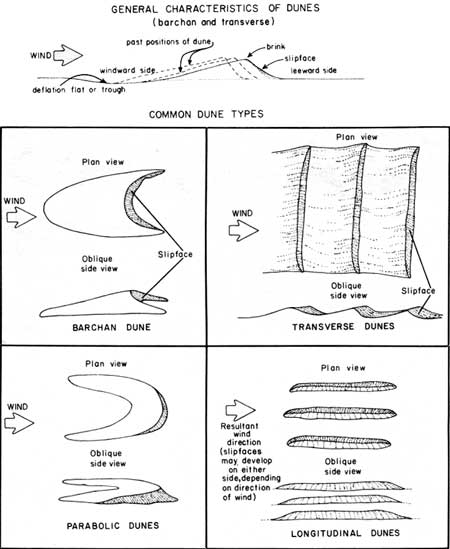
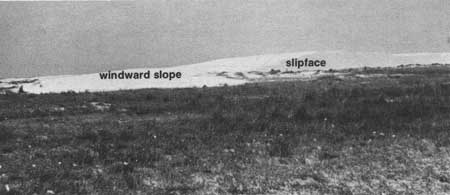
Dunes are windblown accumulations or mounds of sand that, unless impeded by obstacles, will take on a certain natural form or shape and move, mostly as a unit, downwind. Generally, active dunes (unvegetated dunes) have a gentle slope on their windward side and a more steeply dipping slope, known as the slipface, on their leeward (downwind) side (figs. 39 and 40). Sand grains migrate up the gently sloping windward side to the brink (top edge of the steep slipface) and down along the slipface of the dune. In this manner, the dune moves downwind (fig. 39).
|
| Figure 39. General characteristics of dunes relation to wind direction. (click on image for an enlargement in a new window) |
|
| Figure 40. Active back-island dune on Padre Island. View is southwestward. Compare the steeply dipping leeward slipface, which is outlined by a slight shadow, with the more gently sloping windward side of the dune. The highest point on the slipface is about 10 to 12 feet above the vegetated flat over which the dune is migrating. This dune is also shown in figures 41 and 120. |
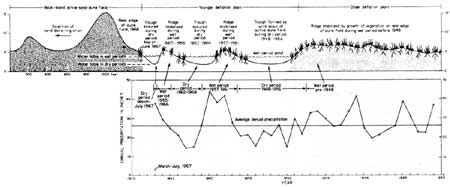
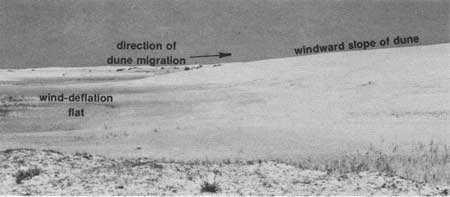
As a dune moves forward, the area left behind is generally flat or troughlike, after having been scoured by the wind and migrating sand particles. In these areas, called deflation flats or troughs (Hunter and others, 1972), sand is generally eroded down to a level where moisture from the underlying water table holds the remaining sand in place, preventing further deflation or erosion (fig. 41). Because the water table helps control the depth to which sand is eroded, a drop in the level of the water table during drier periods (droughts) is accompanied by a drop in the elevation to which the sand can be eroded by the wind. Deeper deflation troughs are formed during dry periods or droughts (fig. 42). Interestingly, these basins pond water during wet periods and provide a wet lands habitat for flora and fauna.
|
| Figure 41. Deflation trough or flat formed along the trailing edge (windward side) of an active dune. As the dune migrates downwind to the right, sand is eroded by the wind down to a level where moisture from the underlying water table prevents further removal of sand. The darker, moist sand that characterizes the deflation flat contrasts with the whiter, dry sand that constitutes the dune. Eventually, the deflation flat may become stabilized with vegetation. Note the gentle windward slope of the dune; this is the same dune that is shown in figures 40 and 120. |
During wet periods, rate of dune migration commonly decreases. This reduced rate of migration, coupled with the increased moisture, enables vegetation to encroach onto the margins of the sand mass, stabilizing the margins and inhibiting further movement along them. Assuming that the central mass of the dune is not stabilized but moves on, the deflation trough and vegetated sandy margins lag behind. These "stabilized" features provide a clue or record, although often relatively temporary, to the past positions and directions of dune migration and dune fields (fig. 43).
Now, with these general ideas about dune morphology and movement, the effect of wind on island features and the direction of net dune migration should be easier to decipher.
Influence of Southeasterly and Northeasterly Winds on Sand Migration
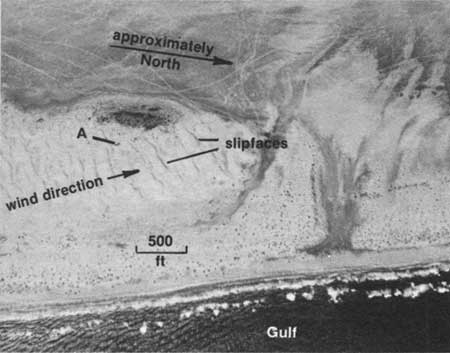
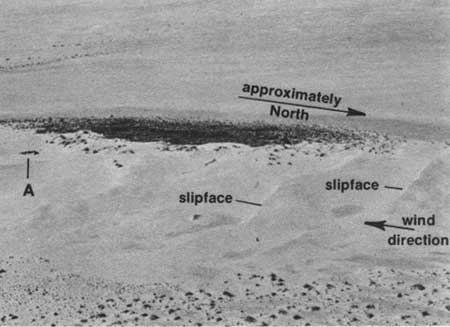
Figure 44 is an aerial photograph (taken in May 1975) of a dune field located on the southern part of the National Seashore (South Section, pl. I). The slipfaces of the dunes are oriented approximately northeast-to-southwest and dip toward the northwest. These transverse dunes (fig. 39) were shaped by southeasterly winds as indicated by the position of the slipfaces on the northwest side; thus the sand must be migrating toward the northwest. But do these dunes maintain this shape, orientation, and direction of travel year-round? Figure 45 is an oblique, low-altitude, aerial photograph of the same dune field taken during the winter (February) of 1976, when winter seasonal winds were in effect. Slipfaces are now dipping toward the southwest instead of the northwest, indicating that the northeasterly winds temporarily have gained control over the shape of the dunes and have modified the direction of sand migration.
|
| Figure 44. Aerial photograph of active dunes shaped by southeasterly winds. Slipfaces dip toward northwest (note shadows). Photograph, taken in May 1975, is of dune field located in grids H-20 and J-20, South Section, plate I. The clump of vegetation at "A" is also shown in figure 45 for reference purposes. Note the difference in scale between the two photographs. |
|
| Figure 45. Oblique, low-level aerial photograph of active dunes shaped by northeasterly winds. Slipfaces dip toward the southwest. This is the same active dune field shown in figure 44. Photograph was taken in February 1976. Clump of vegetation indicated at "A" is also noted in figure 44. Note in lower right-hand corner of photograph that sand has accumulated downwind from clumps of vegetation (in wind shadow zones). |
In another May 1975 photograph (fig. 46), position and orientation of the slipfaces (as shown by shadows) suggest that winds from the southeast recently had been effective in moving the sand and shaping the dunes. Closer observation of the active dunes (fig. 46), however, reveals faint shadows oriented in a northwest-southeast direction. These shadows reflect remnant traces of southwest-dipping slipfaces that were developed by winds from the northeast. With these two different orientations of slipfaces in mind, some of the patterns and features apparent in the dunes (fig. 46) can be inferred. The dunes are in a state of transition, moving from control by northeast winds characteristic of winter months to control by southeast winds that characterize summer months.
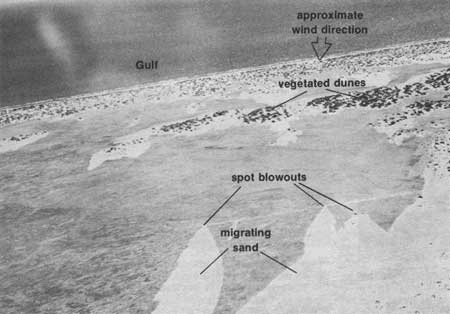
Both wind systems seem to be effective in transporting sand, and both may control to some degree the direction of sand migration. Another example of the effect of southeasterly winds is presented in figure 47.
|
| Figure 47. Lagoonward migration of sand in response to onshore (southeasterly) winds. Gulf is in distance. The patterns displayed in this photograph were formed as loose, dry sand (the white areas) migrated downwind across darker-colored, rain-moistened sand flats. The drier sand areas and flare or spread outward downwind originated from small areas ("spot" blowouts) upwind. Part of the unique appearance occurs where the flare patterns from two different spot blowouts overlap. |
Net Direction of Sand Transport
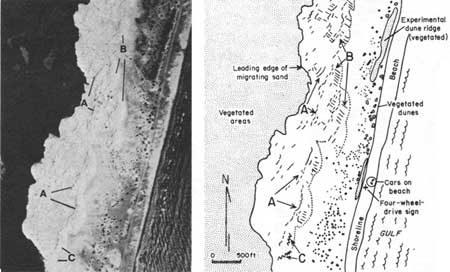
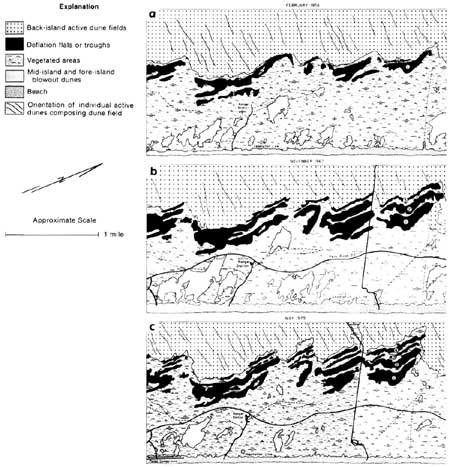
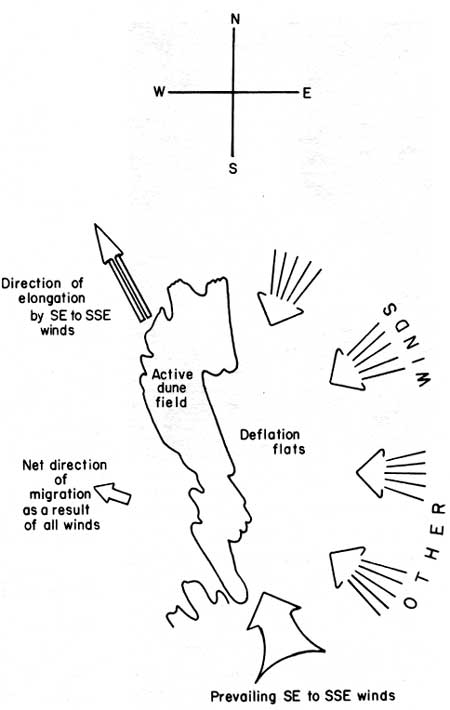
Net annual direction of migration of the dunes and sand on Padre Island is indicated in figures 48 and 49. Close inspection of figure 48 reveals some recurring patterns. Because of the persistent onshore summer winds from the southeast and south-southeast, blowout dune fields in the fore-island area tend to become elongate in an approximate north-northwest direction. But the northeasterly and easterly components of winds that predominate during winter months modify the overall movement of the dune field into a more westerly direction, approaching west-northwest, as denoted by past position of the dunes shown in figure 48. These two directions —the elongation of the sand dune field in a north-northwest direction and the overall sand migration in a more westerly (WNW) direction (fig. 49) — help to explain the orientation and patterns of many island features. For example, maps prepared from photographs taken during different years show that an interesting and predictable pattern develops in the wake of migrating dune fields (fig. 50).

|
| Figure 48. Aerial photograph showing the direction of elongation ("A" arrows) of active dune fields in relation to their net direction of migration ("B" arrows). See figure 49. Not that the net direction of migration as shown by "B" arrows is evident from the dark-colored (vegetated) deflation troughs (that lie below the arrows) and the lighter-colored lateral margins (parallel to the arrows) that were left behind as the dunes migrated landward. At an average rate of migration of 35 ft/yr for the trailing edge of the dune labeled "C," it took approximately 23 years of dune "C" to travel the length of the arrow. Photograph, taken in June 1974, provided courtesy of the General Land Office of Texas. |
|
| Figure 49. Movement of active dunes with respect to major wind directions. Refer to figure 48 for additional explanation. |
One more significant pattern emerges in the back-island dune fields as noted by Boker (1953), Price (1958), and Hunter and others (1972). The dunes in many back-island dune fields are aligned approximately east-west (fig. 51). These back-island dunes are relatively stable features that generally maintain their alignment and orientation throughout the year; this is indicated by aerial photographs taken during different months and years. Many of the lines representing orientation of active dunes shown on the map of Padre Island (pl. I) reflect this east-west alignment.
Rate of Dune Migration
Migration rates of active dunes vary from year to year, but average rates can be determined by comparing the position of a selected dune on aerial photographs taken over an interval of several years. The position of the trailing edge (windward side) of the main body of sand of dune "C" shown in figure 48 was accurately measured and compared on photographs taken in 1956 and 1975. The trailing edge moved about 665 feet during the 19-year period. The average rate of movement was approximately 35 feet per year. Sand dunes on north Padre Island have been reported to migrate at up to 75 and 85 feet per year (Hunter and Dickinson, 1970; Price, 1971).
Internal Structure of Dunes
Information on wind direction and sand movement can also be ascertained from internal structures of dunes. Dunes progress as sand is blown up gentle windward slopes and is deposited on the steeper leeward slipface. Accumulations of sand on dune surfaces, such as the slipfaces, form layers that are commonly visible in cross section because of slight differences in grain size and composition of the sand. These differences result from sorting or segregation of the material as it is transported and deposited by the wind (figs. 52 and 53). Generally, the result is visible bedding or layering that is normally parallel to the surface on which the sediments accumulate (figs. 54 through 57).

|
| Figure 51. Active longitudinal dune on the lagoon side of Padre Island. View is to the southeast. The long dimension of this dune is lined up approximately east-west. Dunes similar to this one, oriented either parallel (longitudinal dunes) or obliquely (oblique dunes) to the resultant (vector sum of) direction of winds that blow across Padre Island, are relatively stable features and may develop slipfaces on their northern or southern sides, depending on the wind direction at a given time. In the photograph at left, the slipface is on the northern side (left side), indicating the influence of south to southeasterly winds. Note the ripple marks on the southern side of the dune crest. This particular dune is located in grid square P-3 (pl. I). |
|
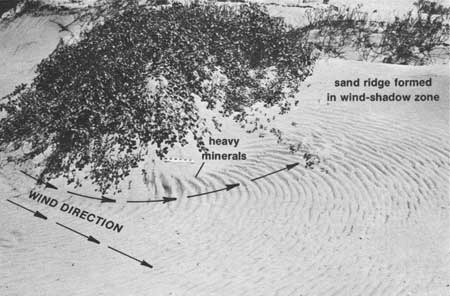
| Figure 52. Ripple marks showing sorting or segregation of sediments by the wind. The ripples, which formed perpendicular to the wind direction (see arrows), are accentuated by dark, fine-grained heavy minerals, which are concentrated in the ripple troughs (low points). The wind sorts sediments primarily on the basis of differing sediment size, the heavy minerals being finer grained than the other sediments. Wind sorting produces distinct layers in the accumulating sand, which are visible when the sand body is viewed in cross section (see fig. 54). Note pile of sand that has accumulated downwind from the clump of vegetation (in the wind-shadow zone). Scale is 12 inches (30.5 cm) long. |
|
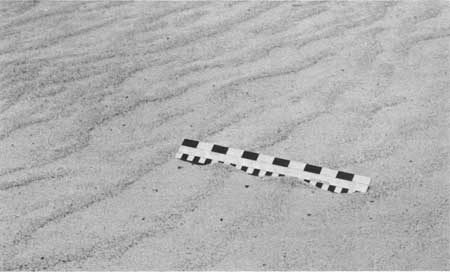
| Figure 53. Ripple marks in which flakes of shell material have been sorted or segregated from finer grained quartz sand by the wind. The coarser materials (shell fragments) have become concentrated in the crests (high points) of the ripples, while the finer sand remains in the more protected troughs (low points). Sorting of the shell material from the quartz sand produces distinct layers (see fig. 55) as the sediments are transported and deposited by the wind. Wind direction is from left to right, and is parallel to the scale, which is 12 inches (30.5 cm) long. |
|
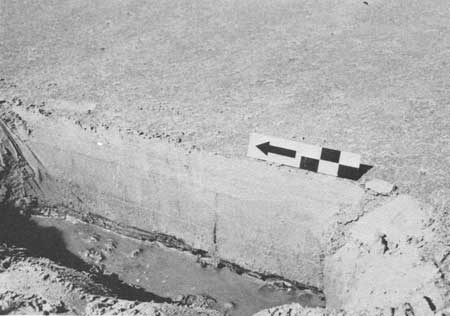
| Figure 54. Trench dug in hurricane wash over channel on Padre Island. Note the parallel, horizontal layers of sediment that are visible as a result of sorting of dark colored, fine-grained heavy minerals (dark layers) and light-colored predominantly quartz sand, which has a slightly coarser grain size than the heavy minerals. Layers of fine-grained sediment, similar to those exposed in the trench, can be formed by wind or water. Numerous studies have been conducted in an attempt to establish criteria that will allow wind-deposited sediments to be differentiated from those deposited by water, but total success has not been achieved. Organic material, such as that associated with the growth of algae on tidal flats, may also produce dark-colored layers that are interbedded with layers of light-colored sand. Note that in the photograph at right, the water table has been intersected at the bottom of the trench. Arrow on scale is parallel to washover channel and pointing toward Laguna Madre. Scale is 11.8 inches (30 cm) long. |
|
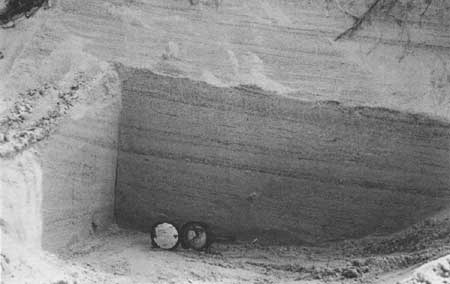
| Figure 55. Alternating layers of sediment, composed predominantly of quartz sand and shell fragments, in a fore-island dune on Padre Island. The exact mechanism by which the wind sorts or segregates sediments of different sizes into distinct layers during deposition is not fully understood, but as shown in this photograph, sorting obviously occurs. Layers of fine-grained quartz sand (light-colored layers) are readily distinguishable from the coarser-grained layers composed of shell fragments (dark-colored layers). The small trench was cut along a barren and exposed side (blowout) of a fore-island dune ridge about 15 feet above mean sea level. Source of the thin platy shell fragments is Little Shell Beach, which lies gulfward (to the right) of the dune. The shells are broken into a hash by wave action along the beach and are subsequently transported toward the dunes by onshore wind. The Brunton compass shown in the photograph is about 8.5 inches long and is positioned so that the top edge is horizontal; note dip direction of the sedimentary layers. |
|
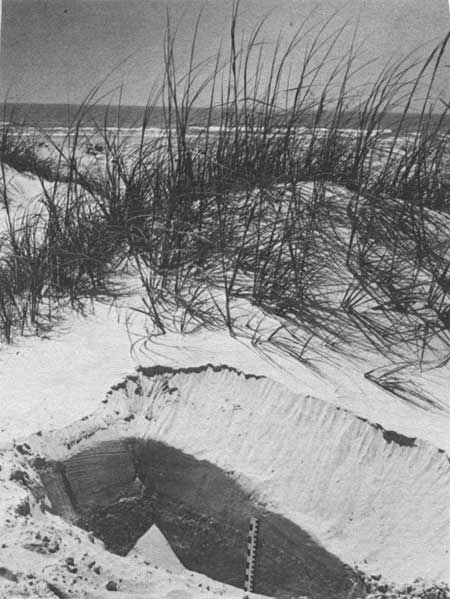
| Figure 56. Trench dug behind a small dune (vegetated with sea oats) located near the beach on Padre Island. A close-up gulfward view of this trench is shown in figure 57. Scale resting on bottom of trench is 12 inches (30.5 cm) long. View is gulfward. |
|
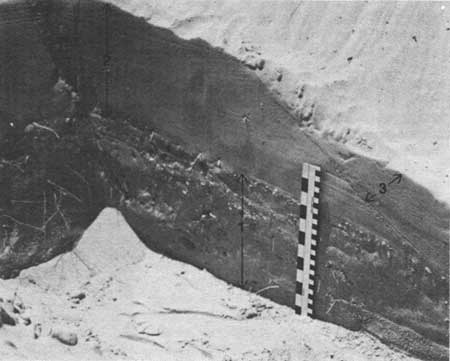
| Figure 57. Close-up view of trench shown in figure 56. Note the different sedimentary sequences labeled "1," "2," and "3." The presence of shells in sequence 1 suggests that this sequence was formed primarily by the action of waves that washed across the backbeach, depositing sand and scattered shells; numerous roots have changed the original appearance (primary structures) of this sequence. Sequence 2 is composed of gently dipping layers of well-sorted, fine-grained sand that were deposited above sequence 1 by the wind. Note the well-defined contact that separates sequences 1 and 2. The more steeply dipping layers (crossbeds) of sequence 3 were deposited after sequence 2 was truncated by deflation (wind erosion). The thin layers of shell fragments that mark the contact between sequences 2 and 3 were probably formed as wind removed the finer sand, leaving the shell fragments concentrated along the deflation (wind-eroded) surface, which was eventually covered with the fine-grained, well-sorted, wind-deposited crossbeds that make up sequence 3. The scale extending vertically along one wall of the trench is 12 inches (30.5 cm) long. |
If the surface on which sand layers accumulate is at an angle to a horizontal plane, these dipping layers (in cross section) are said to be crossbedded (figs. 58a and 58b). Accordingly, layers formed on the slipface of a dune are crossbedded with angles of dip ranging between 25° and 34° (Bigarella, 1972). The maximum dip angle, approximately 34°, is near the angle of repose of the windblown sand. Angle of repose is the steepest angle or slope that the sand can maintain without beginning to slide, flow, or avalanche down the slope.
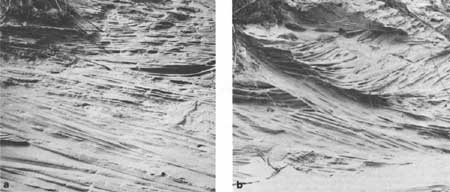
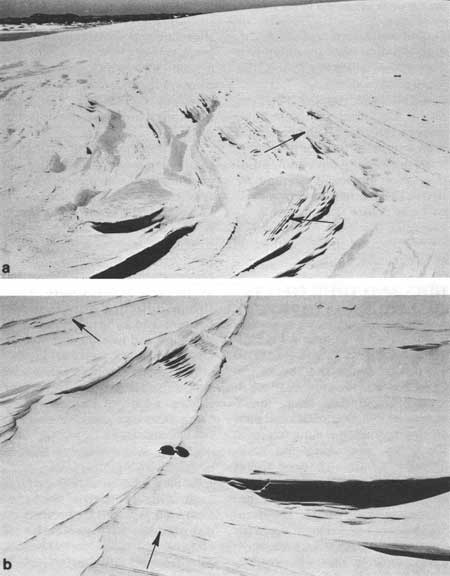
Figures 59a and 59b are photographs of a deflation "flat" just upwind from the gentle windward slope of an active dune located in the northern part of Padre Island National Seashore. Visible in figure 59a are truncated (eroded) crossbeds that were left behind as the dune moved downwind (northwest) in response to the prevailing south-southeasterly winds. The exposed layers of sand, which are held together by moisture, dip in two principal directions — north-northwest and south-southwest — and reflect the influence of the south-southeasterly and northeasterly winds, respectively. Figure 59b shows another complicated pattern of truncated crossbeds that dip in two directions. An explanation for crossbeds that dip in two directions (figures 59a and 59b) is shown in figure 60.
|
| Figure 59(a) and (b). Truncated crossbedding exposed on nearly horizontal surfaces windward of an active back-island dune on Padre Island. The dipping beds (crossbeds) were exposed as sand was deflated (eroded by the wind) down to underlying layers of moist sand that lie slightly above the water table. Moisture helped hold the exposed layers of sand together and allowed the crossbeds to be etched as dry sand migrated over the moisture-stabilized surface. In photograph (a), the truncated crossbeds in the upper half of the photograph dip about 30° toward the right (see top arrow) and reflect the past positions of the dune's slipface as it migrated toward the right, or north-northwestward, in response to south-southeasterly winds. Crossbeds in the bottom central portion of the photograph (see bottom arrow) dip about 30° toward the left (southwest), indicating that a northeasterly wind was directing the slipface on which these layers were deposited. In photograph (b), sunglasses (approximately 6 inches or 15.2 cm long) mark the contact between crossbeds that dip in two different directions (see arrows), suggesting that they too were deposited by two different wind systems. |
Direction of dip exhibited by crossbeds normally indicates the direction of sand migration. Thus, by measuring the dip direction of exposed beds, the general wind direction that formed the slipface can be estimated.
This explanation of dune crossbedding and its relation to wind direction is highly simplified; steeply dipping beds are not always indicators of wind direction. This is true in fore-island areas where dunes are stabilized and shaped by vegetation and modified by erosion during storms. For example, M. O. Hayes (1967) observed that Hurricane Carla's storm tides and waves eroded fore-island dunes to form steep seaward-facing cliffs. Isolated dunes that remained were stabilized by clumps of vegetation. When normal onshore southeasterly winds began to blow after the hurricane, sand accumulated against the wave-cut cliffs, forming seaward-dipping crossbeds. In this instance, then, the beds that formed dipped upwind instead of downwind. Sand blown by onshore winds accumulated in a wind-shadow zone behind the eroded dunes to form slopes (slipfaces) and crossbeds that dipped northward and westward. Both dip directions are oblique to the onshore winds that formed the wind-shadow dunes.
Nevertheless, dipping crossbeds might be used to determine current direction. This technique is an important tool for geologists in reconstructing environments of deposition in ancient sedimentary rocks. The modern environments, such as Padre Island, serve as examples that help to establish a knowledge and understanding of natural, active processes.
| <<< Previous | <<< Contents >>> | Next >>> |
state/tx/1980-17/sec3a.htm
Last Updated: 28-Mar-2007
