
|
Geological Survey Water-Supply Paper 1475-O
Hydrologic and Geologic Reconnaissance of Pinto Basin Joshua Tree National Monument, Riverside County, California |
WATER RESOURCES
SURFACE WATER
Pinto basin has no perennial streams. However, the main dry wash and its dry tributaries form a well-integrated drainage system that discharges from the valley into Palen Lake in Chuckwalla Valley to the southeast. According to Campbell and Campbell (1935), occasional heavy thundershowers in the higher mountains may flood the wash to a depth ranging from a few inches to more than 1 foot for 8 or 9 hours. It is reported that during the summer of 1934 the wash flowed for 48 hours.
Placer Canyon is not identified on the Eagle Tank quadrangle map, and the map of Harder (1912) does not contain enough detail to correlate it with the Eagle Tank quadrangle map. However, the site shown as Eagle Tank (pl. 28) was visited on February 8, 1956, and no evidence of a tank was found.
According to Harder (1912):
Eagle Tank is a natural rock basin about 20 feet in diameter 10 to 15 feet deep in the bed of a gorge tributary to Placer Canyon. The gorge is the third one entering Placer Canyon from the south below the reservoir, at a distance from it of about one-half mile. The tank is several hundred yards from the mouth of the gorge and stands in its bottom at the base of a vertical cliff about 20 feet high. It is said to contain water all the year round, but during the height of the dry season the water is stale and dirty, and even during the torrential rains it is filled with green algae and animal life, such as various crustaceans, larvae, and tadpoles.
GROUND WATER
OCCURRENCE
In Pinto basin, as in any ground-water basin, the pore spaces m deposits beneath the water table are saturated with water. However, not all deposits yield water to wells with the same facility. For example, beds of loose rounded well-sorted gravel or sand yield water to wells more freely than beds of clay, silt, cemented sand, or gravel, or compacted poorly sorted angular material. The consolidated rocks around the margins of and at depth beneath the valley are generally of low permeability and do not yield water to wells, except for small amounts from joints and other fractures.
Ten wells in Pinto basin have been described (table 3); of these wells, eight were examined by the Geological Survey. The reported location of wells 5 and 8 were visited but no wells were found.
SOURCE AND MOVEMENT
The only source of ground water in Pinto basin is precipitation within the tributary drainage area. The water that infiltrates the ground and reaches the water table does not move as a stream but percolates through the pore spaces in the water-bearing formations from points of replenishment toward points of discharge.
Under natural conditions, the only ground-water discharge from Pinto basin is underflow to Chuckwalla Valley through the unconsolidated deposits between the exposures of consolidated rock of the Eagle and Coxcomb Mountains. The water table in the basin lies at great enough depths to prevent ground-water discharge resulting from the transpiration of plants.
In February 1956, the altitude of the water surface was 949 feet above sea level at well 1, 926 feet at well 2, and 961 feet at well 3. These data show a difference in the altitude of the water table between wells 1 and 3, which are at opposite ends of the basin, of only 12 feet, or a hydraulic gradient of less than 1 foot per mile. On the other hand, the difference in the altitude of the water table between wells 1 and 2, which are only 1,485 feet apart, is 23 feet, which represents an apparent hydraulic gradient between the wells of about 80 feet per mile.
Most of the time water is pumped either from well 1 or from well 9; well 2 was pumped only during a development test. In February 1956 the altitude of the water table at well 1 was 23 feet higher than at well 2. Also, a small quantity of water in well 2 cascaded from a permeable zone above the main water level. Cascading water in a well is not conclusive evidence of a nearby fault. The combination of cascading water and the abrupt change in water-level gradient, however, strongly suggests that a concealed fault (pl. 28) or other barrier lies between the two wells and that some water is leaking through or flowing over the barrier.
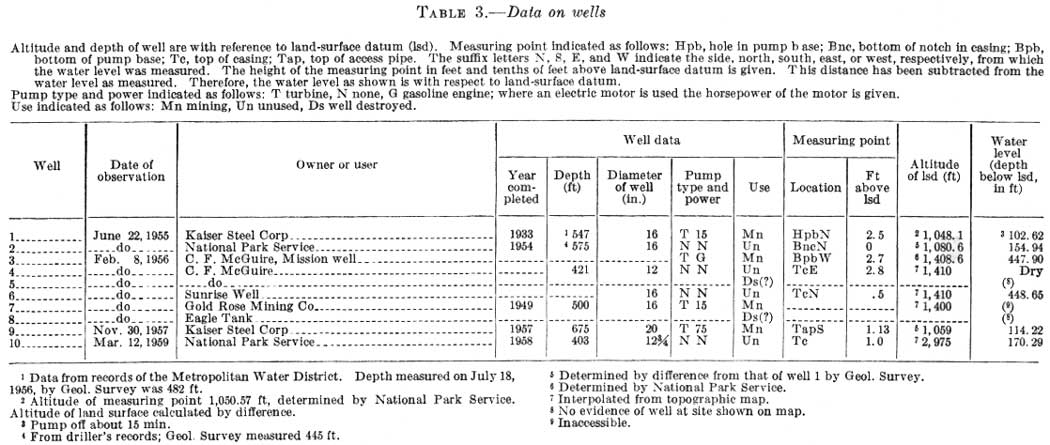
TABLE 3.—Data on wells
Altitude and depth of well are with reference to land-surface datum (lsd). Measuring point indicated as follows: Hpb, hole in pump base; Bnc, bottom of notch in easing; Bpb, bottom of pump base; Tc, top of casing; Tap, top of access pipe. The suffix letters N, S, E, and W indicate the side, north, south, east, or west, respectively, from which the water level was measured, The height of the measuring point in feet and tenths of feet above land-surface datum is given. This distance has been subtracted from the water level as measured. Therefore, the water level as shown is with respect to land-surface datum.
Pump type and power indicated as follows: T turbine, N none, G gasoline engine; where an electric motor is used the horsepower of the motor is given, Use indicated as follows: Mn mining, Un unused, Ds well destroyed.
(click on image for an enlargement in a new window)
CHEMICAL QUALITY AND TEMPERATURE
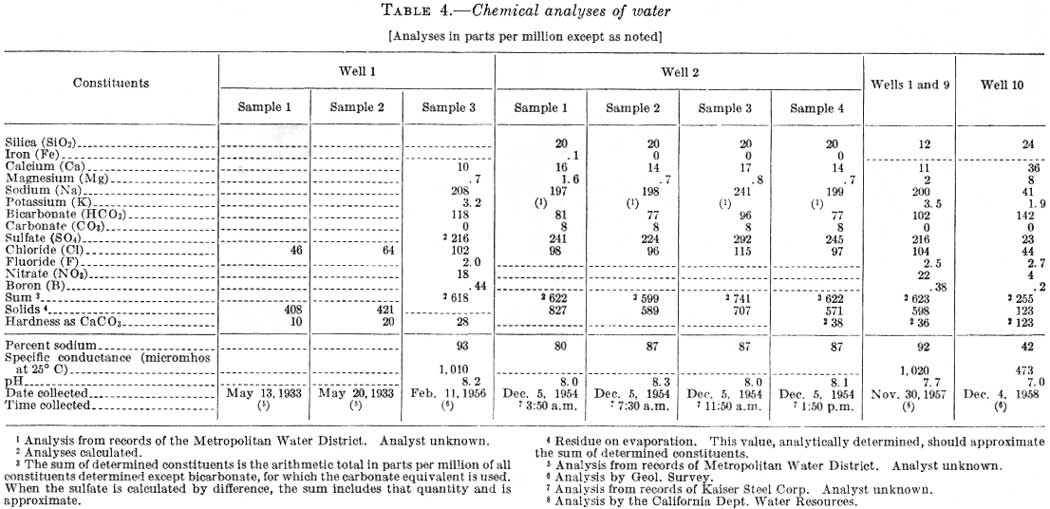
Chemical analyses of water from wells 1 and 2 (table 4) shows them to be of the sodium sulfate type containing dissolved solids of less than 1,000 ppm (parts per million). For most desert areas, this is considered to be water of good quality. However, the fluoride content of well 1 is 2.0 ppm, which is 0.5 ppm higher than that recommended by the U.S. Public Health Service (1946, p. 12) for domestic use on interstate carriers.
Water from the Cottonwood Pass well, as shown by the chemical analysis, is a sodium calcium bicarbonate type. It is low in dissolved solids and contains no constituent detrimental to its use for irrigation. The fluoride content of 2.7 ppm, however, makes it undesirable for drinking water.
The U.S. Public Health Service (1946) set a mandatory upper limit of 1.5 ppm of fluoride for drinking and culinary water supplied by interstate carriers and others subject to Federal quarantine regulations. The U.S. Navy, Bureau of Medicine (1957) set the upper limits for optimum fluoride concentrations at 0.7 to 1.2 ppm, the range being dependent upon the temperature of the region.
As it was not possible to collect water directly from well 9, the chemical analysis (table 4) represents water from well 9 mixed with a small percentage of water from well 1. This sample, collected on November 30, 1957, from a storage tank, was reported by personnel of the Kaiser Steel Corp. to be principally from well 9. Chemical analyses given in table 4 show that water from wells 1, 2, and 9 is of the sodium sulfate type and, compared with water in many other desert basins, is relatively low in dissolved-solids content. The fluoride concentration of 2.0 ppm in water from well 1 and 2.5 ppm in water from well 9 is above the desired limit for human consumption.
TABLE 4.—Chemical analyses of water
[Analyses in parts per million except as noted]
(click on image for an enlargement in a new window)
The percent sodium values of 93, 87, and 92 in water from wells 1, 2, and 9, respectively, are above the 65-percent limit for irrigation water recommended by Wilcox (1948). The sodium ions in water tend to disperse the colloidal clay particles in a soil, resulting in a sticky soil of poor texture for the cultivation of plants.
Water from wells 3, 6, and 7 is reported by the local residents to be of satisfactory quality. However, nothing is known regarding the fluoride content of water from these wells.
The temperature of ground water normally fluctuates within narrow limits during the course of a year, and the fluctuation commonly is greater in shallow wells and less in deep wells. The temperature of water in wells 100 to 150 feet deep is usually constant and about equal to the mean annual air temperature. In deeper wells the temperature of the water normally increases at the rate of about 1° to 2° F per 100 feet of depth. A temperature gradient higher than this may indicate the proximity of comparatively young volcanic rocks or fault movement.
The temperature of the water in well 1 (547 ft deep) was 83°F on June 22, 1955, and 81° F on February 22, 1956. The mean annual air temperature at Eagle Mountain is about 72°F. Therefore, the water temperatures recorded for well 1 are slightly higher than might be expected but not high enough to be significant.
FLUCTUATIONS OF WATER LEVEL
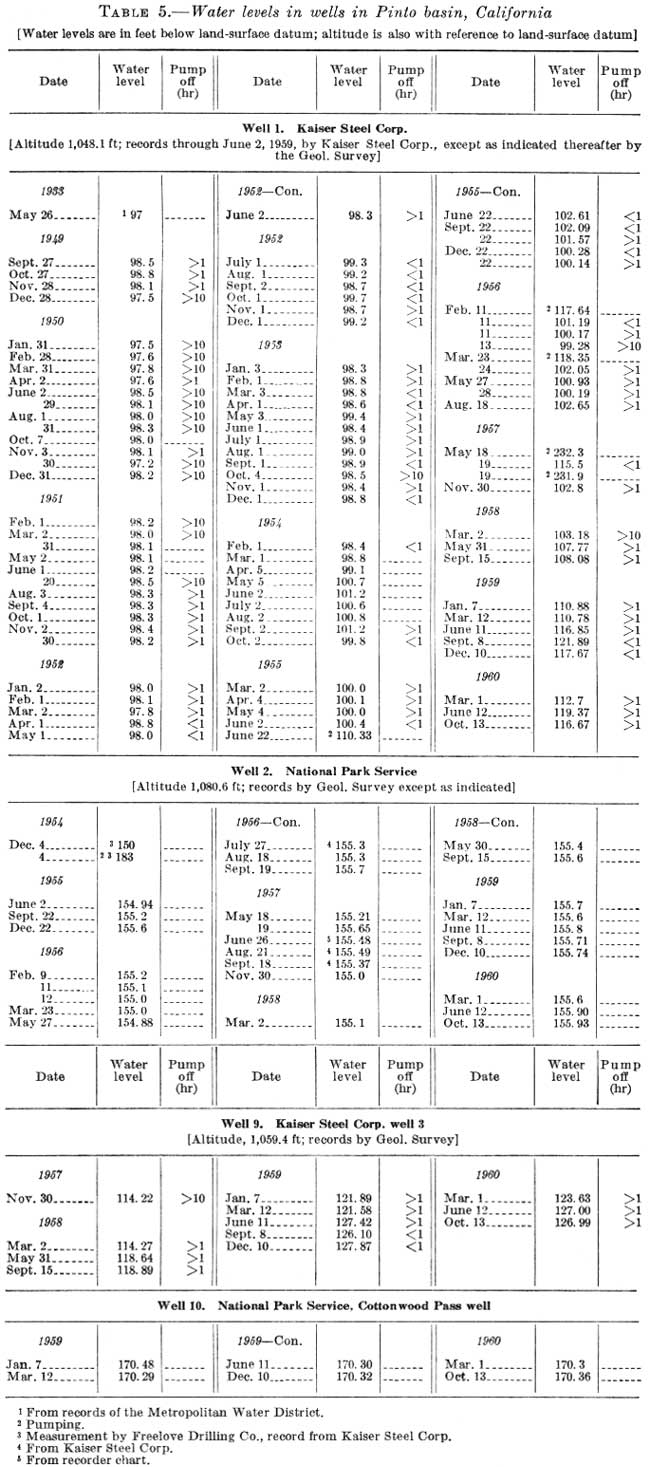
The Geological Survey has made periodic measurements of the water level in wells 1 and 2 since 1955 and in well 9 since 1957. A measurement was made in well 1 by the Metropolitan Water District of Southern California in 1933, and periodic measurements have been made by the Kaiser Steel Corp. since 1949. These measurements are given in table 5 and are shown graphically on figure 65. In addition to periodic measurements of water level, a recording gage was installed on well 4 for irregular periods. Selected gage records are shown on figures 66 to 69.
TABLE 5.—Water levels in wells in Pinto basin, California
[Water levels are in feet below land-surface datum; altitude is also with
reference to land-surface datum]
(click on image for an enlargement in a new window)
In many desert areas, such as Pinto basin, having relatively long records of depth-to-water measurements, four types of water-level fluctuations commonly are observed: (1) long-term and (2) seasonal changes caused by the effect of pumping in nearby wells or in the observed well; (3) daily fluctuations caused by barometric changes and (or) the effect of pumping; and (4) almost instantaneous fluctuations caused by earthquakes.
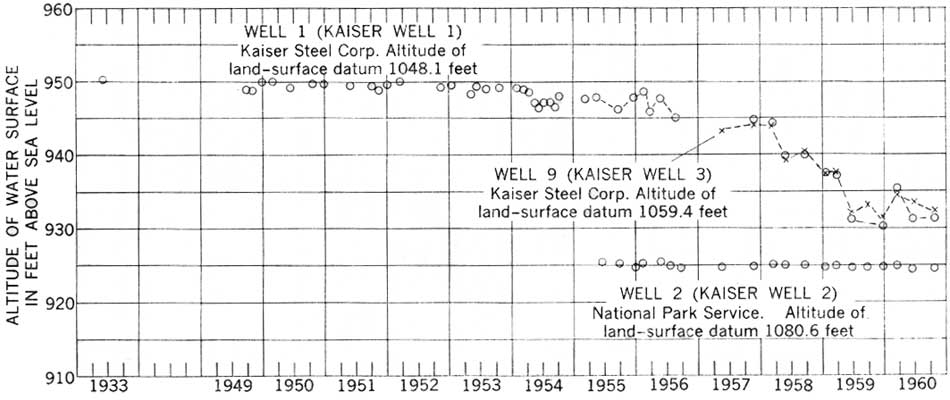
The water-level records for wells 1, 2, and 9, shown graphically on figure 65, indicate a long-term net decline of the water level in well 1 of nearly 2 feet from 1949 to February 1956, about 2.5 feet from 1933 to February 1956, and a seasonal fluctuation of 1 to 3 feet for this period. From February 1956 to December 1959, the water level declined about 16 feet in wells 1 and 9. The altitude of the water surface in well 9 is virtually the same as that in well 1, and pumping in either well has a direct and almost immediate effect on the other. For discussion concerning the significance of the long-term water-level decline see the section "Relation of storage capacity to perennial yield."
|
| FIGURE 65.—Hydrographs of wells 1, 2, and 9 in Pinto basin, California. (click on image for an enlargement in a new window) |
The decline of water level in wells 1 and 9 was caused by withdrawal of ground water from these wells, which increased from about 130 acre-feet in 1952 to about 1,700 acre-feet in 1959. (See the section "Pumpage" and table 6.)
TABLE 6.—Pumpage from wells in the Pinto basin
by the Kaiser Steel Corp. for the calender years 1952-59
[Metered in gallons by Kaiser Steel Corp. except as indicated]
| 1952 | 1953 | 1954 | 1955 | 1956 | 1957 | 1958 | 1959 | |
| January | 1,915,700 | 2,745,024 | 4,693,830 | 18,000,000 | 7,336,750 | 10,690,040 | 36,455,100 | 40,000,000 |
| February | 2,179,436 | 1,141,180 | 15,000,000 | 17,000,000 | 9,523,000 | 9,655,520 | 29,039,550 | 39,719,588 |
| March | 2,381,092 | 4,400,723 | 15,500,000 | 6,764,280 | 9,867,800 | 9,700,000 | 38,358,253 | 47,293,000 |
| April | 2,373,330 | 2,658,004 | 6,034,197 | 6,007,440 | 10,032,700 | 10,345,200 | 37,120,800 | 43,345,000 |
| May | 3,049,108 | 13,800,000 | 7,666,723 | 7,242,000 | 16,775,500 | 10,780,000 | 41,490,107 | 46,310,800 |
| June | 13,800,000 | 4,827,738 | 10,030,310 | 9,300,100 | 9,916,700 | 10,415,000 | 40,500,400 | 50,528,400 |
| July | 4,630,332 | 4,847,620 | 7,939,670 | 10,326,500 | 11,897,000 | 11,134,300 | 46,029,916 | 54,312,500 |
| August | 4,793,208 | 5,085,418 | 8,007,000 | 12,915,800 | 13,008,000 | 26,950,000 | 45,545,080 | 48,003,400 |
| September | 4,622,576 | 5,578,526 | 8,724,830 | 11,405,818 | 13,724,000 | 28,350,000 | 46,029,910 | 47,180,000 |
| October | 4,300,000 | 6,341,780 | 8,103,370 | 9,307,082 | 12,141,000 | 27,875,200 | 64,135,001 | 47,153,100 |
| November | 4,297,000 | 4,513,400 | 18,000,000 | 9,310,000 | 11,085,000 | 26,004,860 | 59,997,259 | 48,068,000 |
| December | 3,017,000 | 3,927,808 | 18,000,000 | 8,428,000 | 9,664,000 | 30,879,200 | 63,100,560 | 145,000,000 |
| Total (gal)2 | 41,400,000 | 52,500,000 | 88,000,000 | 107,000,000 | 136,000,000 | 213,000,000 | 548,000,000 | 558,000,000 |
| Total (ac-ft)3 | 130 | 100 | 270 | 330 | 420 | 650 | 1,700 | 1,700 |
2Rounded to three significant figures.
3Rounded to two significant figures.
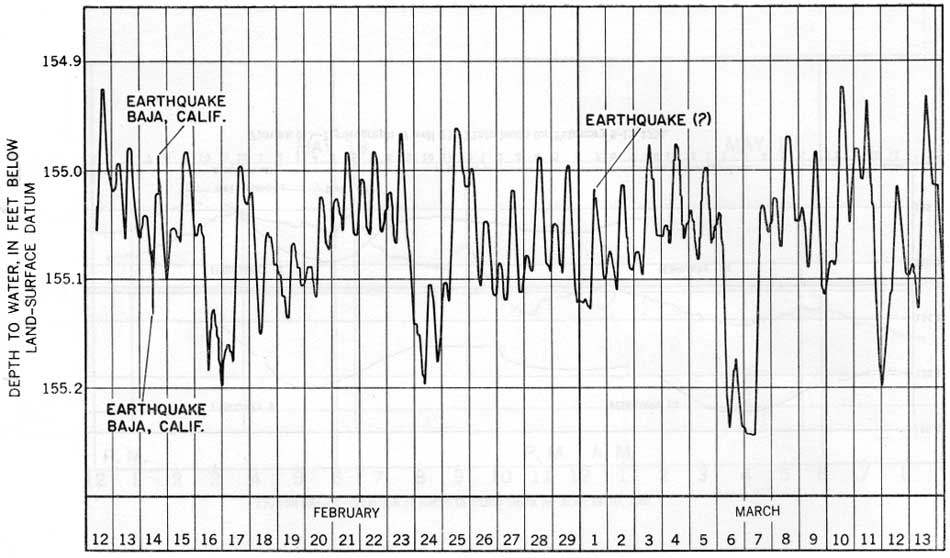
For the period of record beginning in 1955 the water level in well 2 (fig. 65), on the other side of a fault from wells 1 and 9, has not declined appreciably. The fault, shown on plate 28, lies along the north side of the Eagle Mountains. Figure 66 is a copy of a chart from a recording gage installed in well 2 prior to drilling well 9. Similar studies in other desert areas indicate with reasonable certainty that the diurnal fluctuations observed in well 2 are caused by and are inversely proportional to changes in atmospheric pressure. The two sharp fluctuations shown on February 14 are typical of those caused by earthquakes and are believed to have been caused by earthquakes in Baja, California.
|
| FIGURE 66.—Hyrograph of well 2 in Pinto basin for February 12-March 13, 1956. (click on image for an enlargement in a new window) |
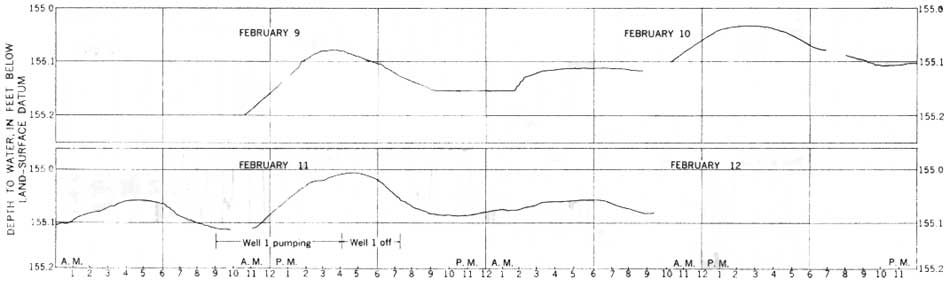
To determine the magnitude of mutual interference between wells 1 and 2 caused by the pumping of well 1 at a rate of about 350 gpm, a recording gage was geared to an expanded or rapid time scale from February 9-12, 1956 (fig. 67). A comparison of the recorder chart (fig. 5) and the pumping schedule of well 1 indicates that the drawdown in well 2 caused by pumping well 1 at a rate of about 350 gpm is less than the diurnal fluctuation caused by changes in atmospheric pressure.
|
| FIGURE 67.—Hydrograph of well 2 in Pinto basin for February 9-12, 1956. (click on image for an enlargement in a new window) |
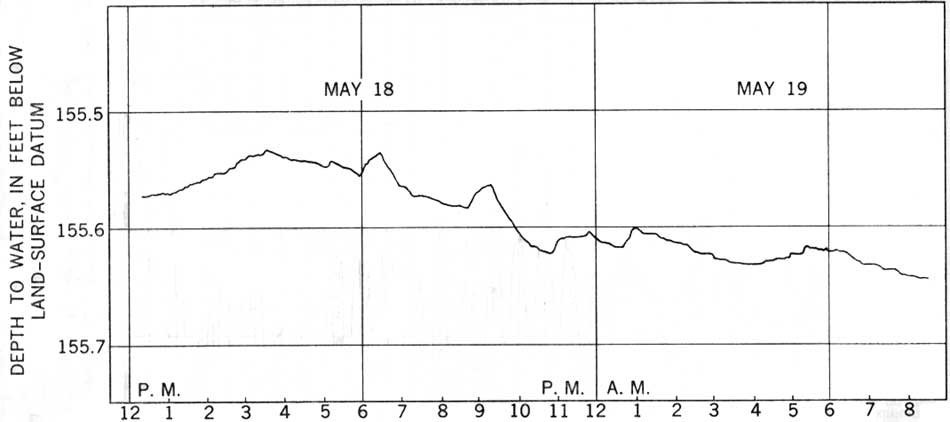
In May 1957, the Kaiser Steel Corp. completed well 9 about 350 feet northwest of well 1 and about 1,500 feet west of well 2. After pumping had started at well 9, a recording gage was installed in well 2. Figures 68 and 69 are hydrographs of well 2 but do not show the highest water level in well 2 before pumping began. However, figure 68 shows a water-level decline of about. 0.15 foot for the period of record.
|
| FIGURE 68.—Hydrograph of well 2 in Pinto basin for May 18-19, 1957. (click on image for an enlargement in a new window) |
|
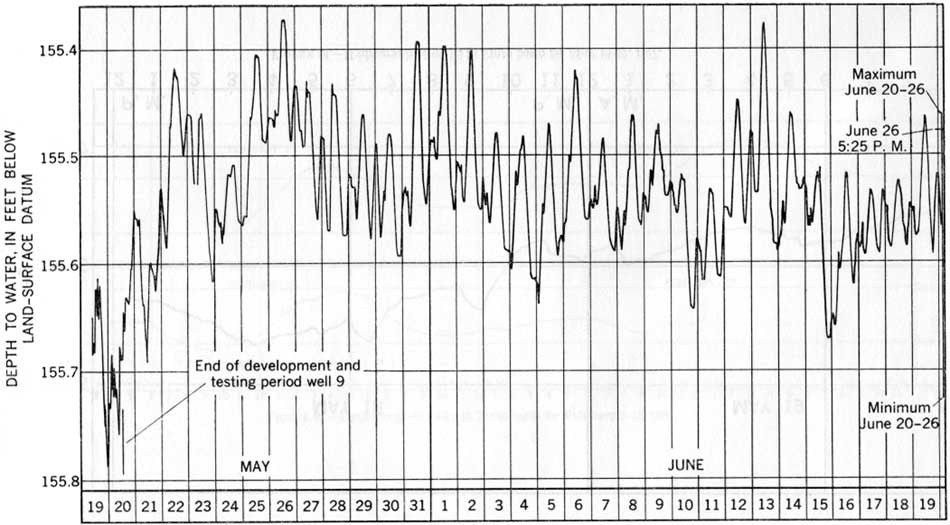
| FIGURE 69.—Hydrograph of well 2 in Pinto basin for May 19-June 26, 1957. (click on image for an enlargement in a new window) |
Figure 69 shows a recovery of water level of about 0.2 foot caused by the cessation of pumping of well 9, and a daily fluctuation of about 0.15 foot caused by changes in atmospheric pressure.
PUMPAGE
Records of ground-water pumpage from wells in Pinto basin are not complete, but in 1955-56 only wells 1, 3, and 7 (table 3) were equipped with pumps. During 1955 well 2 was pumped for a development test, but the pump was removed after the test. In May 1957 the Kaiser Steel Corp. completed well 9 and installed a 75-horsepower pump. Except for wells 1 and 9, the total pumpage from wells in Pinto basin has been very small, probably only a few acre-feet per year. Records of pumpage from Well 1 for 1952-59 and from well 9 for 1956-59 were contributed for this study by the Kaiser Steel Corp. and are given in table 6.
PERENNIAL YIELD
The perennial yield of a ground-water basin may be defined as the rate at which ground water can be withdrawn year after year without depleting the ground-water storage to the extent that withdrawal at the given rate becomes physically impossible to maintain or is no longer feasible because of excessive pumping costs or deterioration of water quality.
Perennial yield theoretically can be determined by several methods if sufficient data are available. However, in an area such as Pinto basin, where virtually no quantitative hydrologic data are available, the perennial yield might be estimated by a series of aquifer tests in test wells drilled across the lower end of the basin. If a sufficient number of these tests can be made, it is theoretically possible to determine the long-term ground-water underflow moving though the basin. The value determined for the long-term ground-water underflow is equal to the long-term ground-water recharge. This quantity, less any unrecoverable subsurface outflow, is equal to the perennial yield of Pinto basin.
To estimate the ground-water underflow near the downstream (east) end of the basin, from six to eight deep test wells would be needed: (1) to determine the hydraulic gradient and shape of the water table; (2) to ascertain the character and thickness of the water-bearing materials; and (3) to determine the transmissibility of the deposits by means of aquifer tests. To avoid complications in the aquifer tests, it is essential that the tests be made at the sites of wells 1 mile or more upstream (generally northwest) from wells 1 and 9 and the nearby area of complex geology.
The cost for the construction and development of deep test wells for the aquifer tests and for the report probably would be several tens of thousands of dollars and would result in considerable local damage to the natural state of the Joshua Tree National Monument. Furthermore, in nearly all desert ground-water basins where the recharge is very low in relation to the quantity of ground-water in storage and where it is virtually impossible to induce additional ground-water recharge or intercept more than a small part of the natural ground-water discharge, the concept of perennial yield is not meaningful. In most desert basins an attempt to limit ground-water development to a mythical perennial-yield determination does not allow full utilization of the important natural resource of ground water in storage.
GROUND-WATER STORAGE CAPACITY
Ground-water storage capacity may be defined as the reservoir space contained in a given volume of deposits. The storage capacity is estimated by use of the following equation:
Storage capacity = Area X Thickness X Specific yield
in which storage capacity is in acre-feet, area is the selected surface area measured in acres, thickness is the selected depth zone of saturated deposits measured in feet, and specific yield of the deposits is a percentage. Specific yield of a rock or deposit was defined by Meinzer (1923) as:
the ratio of (1) the volume of water which, after being saturated, it will yield by gravity to (2) its own volume. This ratio is stated as a percentage and may be expressed by the formula Y= 100(y/V), in which Y is the specific yield, y is the volume of gravity ground water in the rock or soil, and V is the volume of the rock or soil.
In Pinto basin the ground-water storage capacity has been estimated for the ground-water storage unit shown on plate 28, which includes an area of about 36 square miles or 23,000 acres. The thickness of the depth zone is taken as the interval from the water table to a depth of 100 feet below the water table. It is unlikely that the depth to water anywhere in this unit exceeds 300 feet. Therefore, if the water in these deposits could be pumped for some beneficial use, the dewatering of the deposits probably is feasible.
Data in Pinto basin are insufficient to estimate the specific yield of the deposits, but, based on work by the Geological Survey in similar desert areas and in part on an analysis of the drillers' logs, a specific yield of 10 percent has been estimated. Therefore the quantity of water in storage in the Pinto basin storage unit (pl. 28) for a depth of 100 feet below the water table can be estimated as follows:
Storage capacity = 23,000 acres X 100 feet X 0.10 = roughly 230,000 acre-feet
To demonstrate the magnitude of this storage capacity, assume that all natural recharge and discharge were halted and that it would be economically feasible to pump 2,000 acre-feet per year from storage in the Pinto basin, an amount slightly greater than the present use or maximum future pumpage estimated by the Kaiser Steel Corp. Under these circumstances, it would be possible to pump water at this rate for more than a century. This use of the water would not disturb the ecologic balance in the basin because the water in the storage unit is too deep for use by plants.
The estimate of the length of time necessary to deplete the storage unit probably is conservative because no allowance has been made for additions to the reservoir from recharge, salvaged discharge, or for the large quantity of ground water stored in the alluvium outside the storage unit. This presentation is not intended as a recommendation that Pinto basin be dewatered. It is intended to emphasize that the quantity of water pumped at the lower end of Pinto basin is exceedingly small compared to the total amount of ground water in storage.
RELATION OF STORAGE CAPACITY TO PERENNIAL YIELD
In a ground-water system under natural conditions prior to development, a dynamic balance is established between natural recharge and discharge. Over long periods, the change in ground-water storage is virtually zero, and recharge and discharge are equal. Pumping ground water upsets this balance, and some water must be taken from storage and some decline in water levels must occur. If the pumping rate exceeds the perennial yield (recharge less uurecoverable natural discharge) the water levels will decline and continue to decline as long as this rate is maintained. Eventually it would become impractical to pump water at this rate because of decreased well yields or increased pumping costs resulting from greater pumping lifts.
If ground-water pumpage in Pinto basin is equal to or less than perennial yield, the subsurface outflow plus pumpage at first will exceed perennial yield, and ground water will be withdrawn from storage. However, if pumpage is held approximately constant and does not exceed the perennial yield, a new dynamic balance eventually will be established, and pumpage plus a reduced rate of subsurface outflow across the barrier will equal recharge. Under some circumstances, although not in Pinto basin, an increase in recharge may balance a part of this pumpage so that not all of it need result in a reduction in natural discharge.
Thus it follows that a water-level decline of a few feet or few tens of feet in wells 1 and 9 is not a cause for concern. In order for water to flow toward a well, the water level in the well must be lower than it is in the surrounding material. By artificially lowering the water level at a well by pumping, ground water is induced to move toward the well. If the water level is not artificially lowered by pumping, ground water in the Pinto basin will continue to discharge by subsurface outflow to the next ground-water basin downstream, where the water occurs at greater depths, is of poorer quality, and is virtually undeveloped.
The critical point is whether or not, after the initial decline of water levels due to development of a well field, water levels stabilize or recover after a pumping season or after several pumping seasons during a series of dry years. Figure 65 shows that from 1933 through February 1956 the water level in well 1 declined about 2.5 feet. From February 1956 through October 1960, water levels in wells 1 and 9 declined about 14 feet. Pumping has not been continued for a long enough period to determine whether water levels will stabilize at or near these levels. However, compared to the amount of ground water in storage it does not seem probable that continued pumping at the present rate in Pinto basin is cause for concern. If measurements of water levels are continued in wells 1, 2, and 9, any critical overdraft can be readily anticipated and preventive measures taken.
| <<< Previous | <<< Contents >>> | Next >>> |
wsp/1475-O/sec2.htm
Last Updated: 28-Jul-2007