|
Glacier
Use of Bear Observations to Quantify and Protect Bear Hazards, Glacier National Park Katherine L. McArthur |

|
USE OF BEAR OBSERVATIONS TO
QUANTIFY AND PREDICT BEAR HAZARDS,
GLACIER NATIONAL PARK
—DOCUMENTATION OF SYSTEM DEVELOPMENT—
National Park Service Progress Report
For use by National Park Service and cooperating agencies
Katherine L. McArthur
Research Division
Glacier National Park
West Glacier, Montana 59936
February 28, 1978
USE OF BEAR OBSERVATIONS TO
QUANTIFY AND PREDICT BEAR HAZARDS,
GLACIER NATIONAL PARK
— DOCUMENTATION OF SYSTEM DEVELOPMENT —
Glacier National Park, a wilderness and recreational area of more than 4,100 km, has a population of about 200 grizzly bears (Ursus arctos) and 500 black bears (U. americanus). The park was established to protect all native plants and wildlife, including black bears and grizzlies, which have been designated a threatened species. Both bear species can be aggressive toward people and threaten their safety. Nevertheless, the park is receiving ever-increasing visitor use; in 1976, approximately 1,660,000 people visited the park, including an estimated 30,000 people who took overnight trips into the backcountry. This presents a unique problem to the land manager: how can a natural bear population be maintained and visitors be protected?
In 1977, Glacier National Park adopted a bear monitoring system in which all sightings reported were stored on computer. Sighting information included subdistrict; drainage; date; time; species; number of adults, subadults, and cubs; tag number; management action taken; report type, such as tracks, observation, damage, or molestation; case/incident report number; management area, such as backcountry, auto campground, roadside, or residence; UTM coordinates of location; observer type, such as park employee, local resident, or visitor; and reporter's name. There was also space for a narrative description of the bear, its behavior, and any other information the reporter deemed important. Lists of sightings were distributed daily to all administrative divisions and subdistrict field offices. Each week, a summary list replaced the daily printouts.
By reviewing bear reports daily, field and management personnel were able to note the level of bear activity in each area of the park. However, such estimates of bear activity levels were only qualitative. It was difficult to detect problems as they developed, primarily because the report—listing procedure provided no data analysis or comparison from one week to the next. In order to quantify the severity of bear hazards in different parts of the park, and to provide a basis for comparison from day to day and week to week so that developing hazards can be detected, the bear/human contact index system was developed. Its purpose is to enable managers to recognize hazards and take preventive action before serious bear/human confrontations are likely to take place.
TABLE OF CONTENTS
Operation of the Bear/Human Contact Index System
Recommendations for System Refinement
METHODS
Physiographic Units of the Park
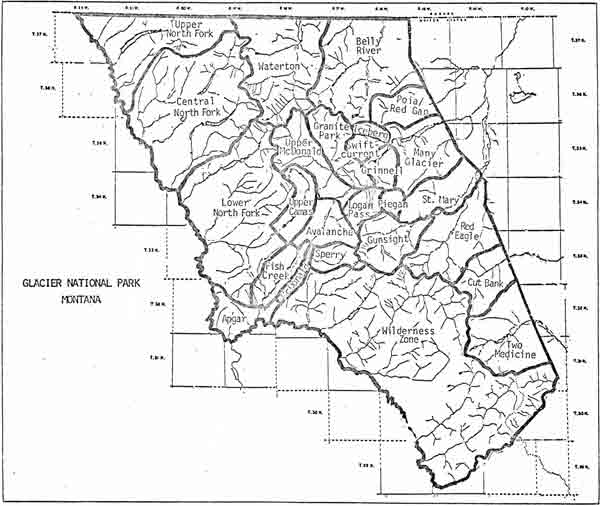
The park was divided into 26 physiographic units (Fig. 1). These units were generally based on major stream drainages, but also considered topography and human use. Where several drainages were separated only by small hills, they were treated as one physiographic unit; the Central North Fork unit originated in this way. Conversely, where one major drainage was divided by high mountains into several smaller drainages, each was considered a separate physiographic unit; Swiftcurrent and Grinnell are two such physiographic units in the Many Glacier valley. Areas with two distinct types of human use in two distinct areas, both at high levels, were divided into two units so that a bear hazard involved with one human activity would not be reflected in the other as well. An example of this is the separation of the Sperry/Lincoln area, which is accessible only by trail, from the rest of the McDonald drainage, which is accessible by road and includes several business and residential areas.
|
| Fig. 1. Physiographic units of Glacier National Park, used in bear hazard quantification, 1977. |
Lists of bear reports were received daily. Each sighting report was logged in for the appropriate physiographic area. Previous sightings in the area and adjacent areas were reviewed to determine whether a bear with similar description and behavior had been seen previously. (For areas with numerous bear observations, lists were kept of bears seen.) If a bear had been seen several times recently, its behavior and the situation were evaluated as to the hazard they posed.
Bear Behavior Rating
Each bear sighting was rated according to the bear's response to the observer. Arbitrary values were selected to reflect the hypothesized progressive conditioning associated with exposure to people: it was assumed that a bear never exposed to people would react with fear when first confronted by them, and that this response would give way to neutrality and possibly eventual aggression following continued exposure to humans. Bear behavior was initially rated as follows: 0=bear fled; 2=bear reacted neutrally; 5=bear threatened person; 8=bear showed overt aggression; 10=bear killed or seriously injured person.
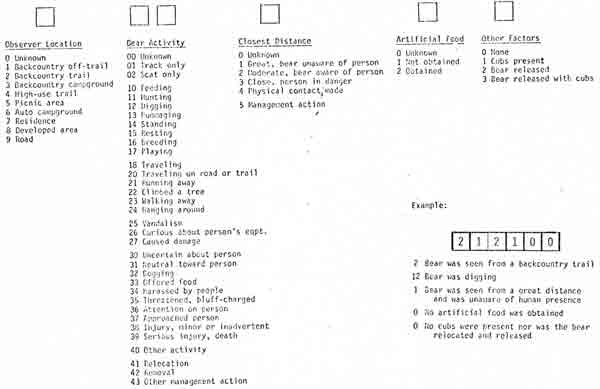
In order to ensure that ratings were assigned consistently, a detailed list of possible bear/human interactions and their corresponding ratings was developed. These were later coded so that automatic data processing (ADP) could be used to vary the ratings and test the predictive ability of each (Table 1).
|
| Table 1. List of bear/human interactions and the codes assigned to each. |
The rating of a report was based on other factors in addition to behavior. For example, if a sighting involved cubs the behavior rating was multiplied by 1.25. A value of 1 was added to the behavior rating of a report involving the release of a relocated bear, since a relocated bear has probably experienced a negative bear/human interaction, the results of which are presently unknown.
In assigning behavior ratings, no distinction was made between grizzlies and black bears.
RESULTS
Evaluating Current Bear Hazard
Daily Index.—In order to evaluate the current contact index in an area, the sum of behavior ratings for a given day in that area was calculated and the sums for the previous 13 days were added to it. Thus, the system "remembered" all incidents of the past two weeks. The daily total was then evaluated according to the following scale: 0—3=low hazard; 4—7=moderate hazard; 8—15=high hazard; >15=extreme hazard.
The Granite Park area provides an example of the daily index calculations. There were no bear observations in the Granite Park area on 9/06/77. In the previous two weeks, however, the following bear observations had been reported:
| Rating | |
| One unknown—species bear in vicinity of campground | 2 |
| One grizzly walking along a high-use trail | 2 |
| One grizzly hanging around a developed area | 3 |
| One incident of bear-caused vandalism | 1 |
| Two observations of grizzlies that ignored people | 2 |
The total rating was 10, so the hazard level on that date was evaluated as high.
Four-Week Index.—Since the daily index carried forward the full weights of all behavior ratings of the past two weeks, an observation made two weeks ago would have the same effect on the contact index as one made today. For the system to more accurately reflect the real situation, the weighting of each observation should diminish over time. In addition, the system should "remember" observations longer than two weeks.
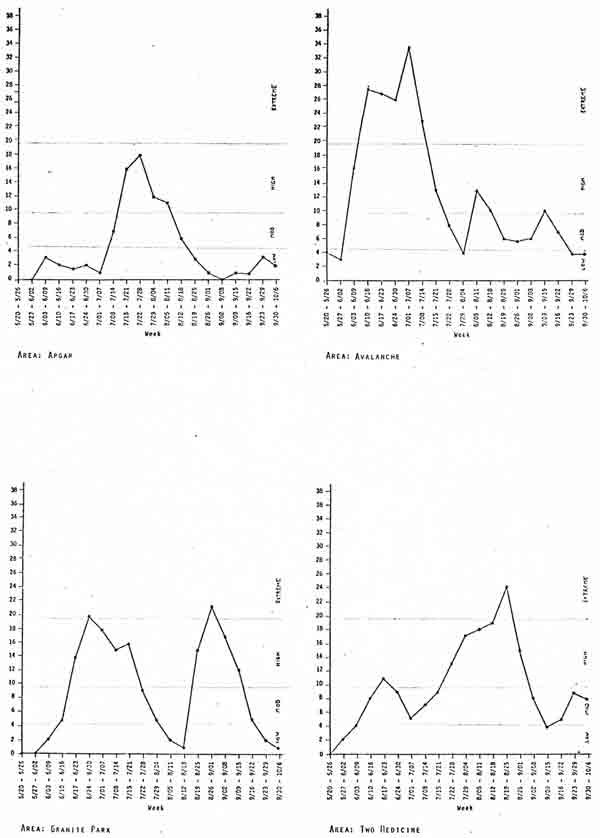
The four-week index employed a method similar to the daily index. All observations made during the past four weeks affected the total contact index, but each observation lost approximately 4 percent of its value per day. Thus, an observation that was ten days old contributed only 60 percent of its original value to the current day's contact index. Due to the constraints imposed by maintaining the system manually, however, daily computation was not feasible. Instead, the ratings of all observations reported during each week were totaled, and this weekly total was devalued 25 percent per week. Thus, the current week's observations were rated at full value, those of one week ago at 75 percent, those of two weeks ago at 50 percent, and those of three weeks ago at 25 percent of their full value. These were totaled and the resulting values were plotted (Fig. 2). Hazard levels were evaluated according to the following scale: 0—4=low hazard; 5—9=moderate hazard; 10—19=high hazard; ≥20=extreme hazard.
|
| Fig. 2. Four-week bear/human contact indexes of Apgar, Avalanche, Granite Park, and Two Medicine areas. Values were determined by adding the current week's rating, 75 percent of the previous week's rating, 50 percent of the rating two weeks ago, and 25 percent of the rating three weeks ago. Hazard levels were evaluated according to the following scale: 0—4=low hazard; 5—9=moderate hazard; 10—19=high hazard; ≥20=extreme hazard. |
In practice, this system showed exceptional ability to reflect current bear hazard levels and to detect developing hazards. When an increasing hazard was indicated in the Granite Park area during the week of 8/26—9/01, preventive management action was taken—trails into the area were temporarily closed—and no incident occurred. Because contact indexes were calculated manually and on a weekly basis, however, there was a lag of more than a week between the observations and the trail closure.
Evaluating Long-Term Bear Hazard
Although the four-week index detected and described bear hazards exceptionally well, it had no "memory" of observations made more than four weeks ago. Following are two methods by which this memory can be retained.
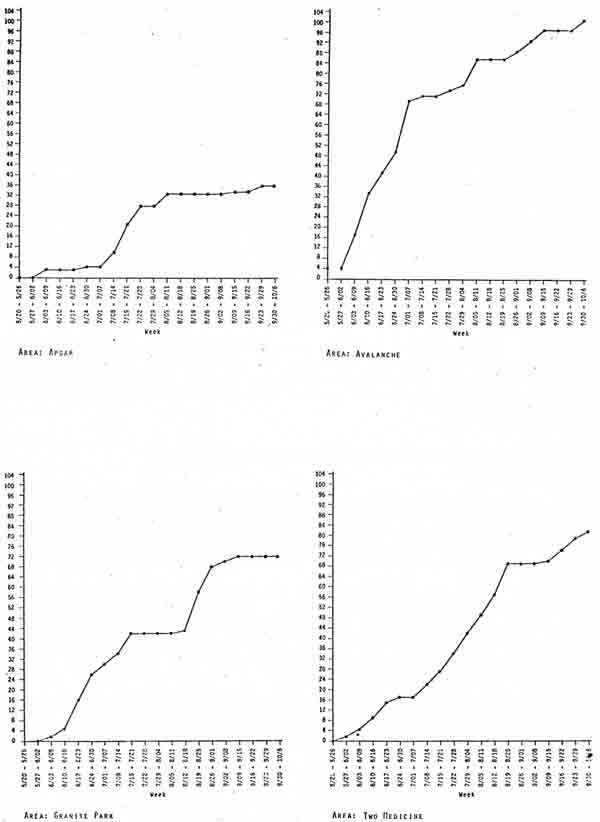
Seasonal Cumulative Index.—To determine the cumulative index for the current season, the total of behavior ratings for each week were added to those from all previous weeks, and the sum was plotted (Fig. 3). The value at Granite Park for the week of 8/26—9/01, for example, was the sum of ratings from all observations made during all previous weeks. The overall slope of the curve on this graph indicates the overall severity of the problem in that area. If the curve continues to rise steadily throughout the season, a bear hazard is present but steady. If the curve rises more sharply, the hazard is increasing; if the curve levels off, the hazard has decreased.
|
| Fig. 3. Seasonal cumulative bear/human contact indexes of Apgar, Avalanche, Granite Park, and Two Medicine areas. Values were determined by adding behavior ratings of all previous observations. |
In practice, this method was not satisfactory as a graphic representation. Relative hazard level was reflected by the slope of the curve rather than its level; when the problem decreased, the curve leveled off but did not decline.
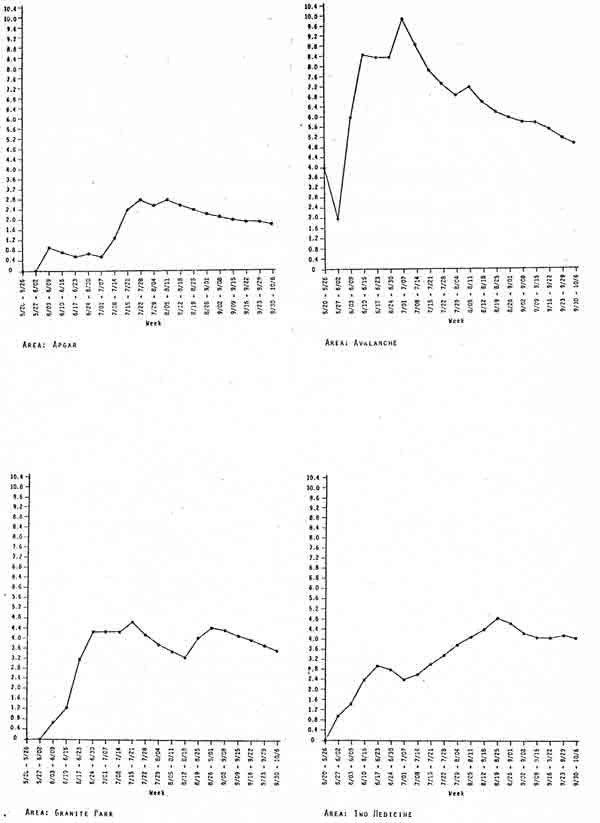
Seasonal Mean Index.—To evaluate seasonal mean, the total of all ratings during all previous weeks was divided by the number of weeks in the season. For example, since the week of 8/26—9/01 was the fifteenth week of the season, its cumulative value was divided by 15 to give the seasonal mean. Seasonal means were then plotted (Fig. 4).
|
| Fig. 4. Seasonal mean bear/human contact indexes of Apgar, Avalanche, Granite Park, and Two Medicine areas. Values were determined by dividing seasonal cumulative indexes by the number of weeks in the season so far. |
The primary value of this method was in evaluating the overall bear hazard level of an area, and it was therefore used in conjunction with the four-week index. Consider, as an example, the Granite Park area during the week of 8/12—8/18. Because there had been few recent sightings, the four-week index was approaching 0. An actual hazard continued to exist, however, reflected by the seasonal mean of 3. This hazard would persist despite the paucity of recent sightings although it would slowly decline, as would the real hazard, if few sightings continued to be reported.
The seasonal mean was not useful in detecting developing hazards because it was not sensitive to small changes in weekly values, especially toward the end of the season. Also, the value of the seasonal mean depended on what date was designated as the beginning of the season.
OPERATION OF THE BEAR/HUMAN CONTACT INDEX SYSTEM
Bear/human contact indexes were calculated for each area of the park. Because values were calculated manually and because reports were usually received several days after the observation was made, indexcs were evaluated on a weekly rather than daily basis although qualitative surveillance of bear observations was maintained daily.
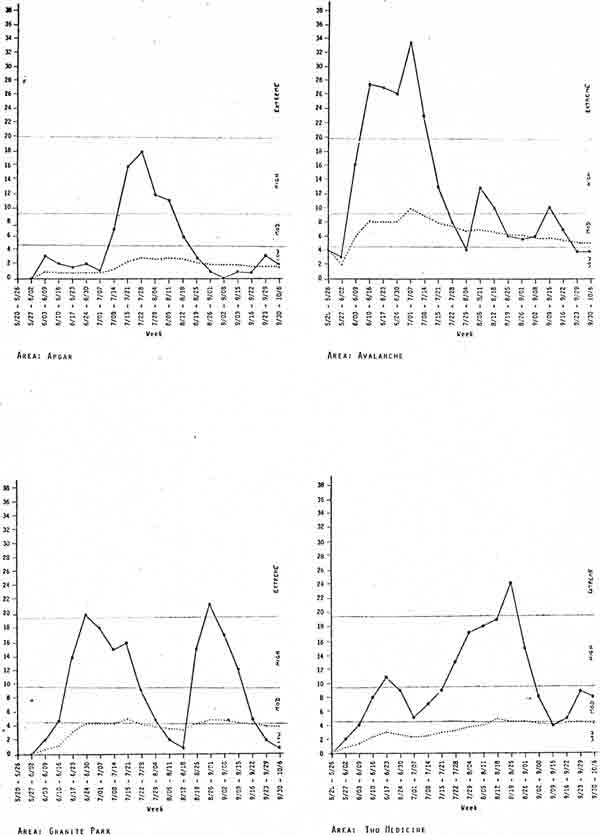
The most valuable method for detection and quantification of bear hazards was the four-week index. When plotted against the background of the seasonal mean, an accurate illustration of current and seasonal bear/human contact hazard was obtained and trends in the hazard could be detected (Fig. 5). In addition, the short-term effects of management actions could be evaluated.
|
| Fig. 5. Four-week and seasonal mean bear/human contact indexes of Apgar, Avalanche, Granite Park, and Two Medicine areas. When the current four-week index (solid line) declines below the seasonal mean (dotted line), the seasonal mean reflects the continuing long-term hazard and should be interpreted as the current bear hazard index. |
Current bear/human contact hazard evaluation was illustrated on a map, using colored flags to indicate relative severity. This was easy to interpret and was available for reference by park personnel throughout the season.
RECOMMENDATIONS FOR SYSTEM REFINEMENT
Several aspects of the system are in need of refinement. Boundaries of physiographic units should be more precisely defined and very large units should be divided into several smaller ones.
In the narrative portion of each sighting report, the reporter gives any information he deems important. Descriptions of the bear's behavior have been lacking in many reports; in others, they were often in very vague terms. One report, for example, involved a grizzly which investigated hikers' backpacks; it was described as exhibiting "no unusual behavior." Many reports described the bear simply as "not aggressive." Descriptions of the bear's behavior must be more complete since this forms the basis for predicting developing hazards. What is considered normal behavior in one area may be quite different from what is "normal" in another area. Reporters should describe specifically what the bear was doing when first seen by the people, what the people did, and how the bear responded.
The ratings of various behavior types were assigned somewhat arbitrarily. Using ADP, the ratings should be varied in order to improve the descriptive, and hence the predictive, ability of the system. This would also point out which behavior types are actually the most important in signifying a developing hazard.
For a very high degree of precision in locating and predicting bear/human contact hazards, trails could be divided into sections. When a bear is sighted on one trail section, that section would be rated at the full value and surrounding trails would be rated at proportions of that value, depending on distance and topographic barriers. This would almost certainly require the use of ADP, but it would also greatly enhance the precision of the system and its usefulness in ensuring visitor safety.
In order to ensure visitor safety to the greatest extent possible, hazard indexes should be calculated as soon as sighting reports are received. This would require the work of a full-time technician and/or the use of ADP. Visitors in an area could then be warned and appropriate management action taken with minimum time lag. In addition, this may enable managers to detect the process of a bear becoming habituated to people so that steps can be taken to halt the process before it has progressed to an irreversible stage.
mcarthur2/index.htm
Last Updated: 8-Apr-2013