|
John Day Fossil Beds
Coyotes and Mule Deer of John Day Fossil Beds National Monument: A Management Report |

|
Coyotes and Mule Deer of John Day Fossil Beds National Monument: A Management Report
by Brad Griffith
1980
Cooperative Studies Unit,
Oregon State University,
Report 80-2
Introduction | Acknowledgements | Study Area | Methods | Results and Discussion | Synopsis | Management Recommendations | Literature Cited
|
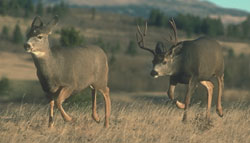
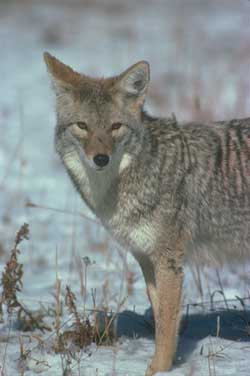
With establishment of the John Day Fossil Beds National Monument (JODA) in 1975, local citizens expressed concern that coyotes (Canis latrans) and mule deer (Odocoileus hemionus) utilizing the monument might have undue impact on domestic livestock and alfalfa production on adjacent private lands as a result of the protection afforded these species by National Park Service (NPS) no hunting policies. This report presents an evaluation of coyote and mule deer populations of the monument as they relate to these public concerns. The evaluation is based on a one-year field study conducted between February, 1979 and February, 1980. The study focused on the Sheep Rock Unit of JODA and had the following objectives: (a) estimate coyote and mule deer population levels on the monument, (b) determine the local history of Federal coyote control from 1970 through 1979, (c) summarize the pattern of predation losses to coyotes on adjacent private lands, (d) estimate the importance of domestic livestock in the diet of coyotes which utilize the monument, and (e) summarize the seasonal pattern and level of mule deer use of adjacent private lands and estimate the level of such use attributable to monument mule deer.
I would like to express my gratitude to the following people for their assistance and cooperation in this study:
Bob Asher, Steve Barten, and Roy McDonald of the U.S. Fish and Wildlife Service for access to their records and the loan of essential equipment,
Ralph Denney, Greg Hattan, Ron Garner, and Jim Lemos of the Oregon Department of Fish and Wildlife for background information and assistance in design of radio collars for mule deer,
Dave DeCalesta and Bob Anthony of Oregon State University for assistance in ageing mule deer and examining reproductive tracts of coyotes, respectively,
Rob Roy Munro, Lillian Mascall, Alvin Brown, and Rod Immenschuh for access to their adjoining lands, and special thanks to Rhys Humphreys for cooperation in documenting predation losses,
Albert Derr for providing coyote jaws for age analysis,
The entire Staff of the John Day Fossil Beds National Monument for logistics assistance and reporting observations of coyotes and mule deer during the study, and
Ed Starkey of the Oregon Cooperative Park Studies Unit for assistance throughout the study and editorial review of the final report.
The Sheep Rock Unit (Fig. 1) of JODA is the largest of three units. Most of the unit lies within a two mile wide and seven mile long block that encompasses a portion of the John Day River, the lower end of Rock Creek and Picture Gorge (Fig. 1). The main Sheep Rock Unit boundary circumscribes-12.3 mi2; 8.9 mi2 of this is currently in NPS ownership. Approximately 7.25 miles of the 18.5 mile main boundary perimeter adjoins private lands with the balance bordering federal lands.
From the river, at an average elevation of 2000 ft, the terrain rises sharply to rims as high as 4000 ft near Windy Point (Fig. 1). With the exception of those portions of Butler Basin within the monument the topography is steep and characterized by many rock escarpments and outcrops. Seasonal stream channels dissect the area but dependable water sources are limited to the John Day River and springs and seeps scattered throughout the area.
Average precipitation for the area is 11.8 inches per year (Youtie and Winward 1977). Average temperature is 60 F for the spring-summer season and 39 F for the fall-winter season although temperatures below O F in winter and above 105 F in summer are not uncommon (Youtie and Winward 1977).
The most extensive plant community on the monument is big sagebrush/Sandberg's bluegrass (Artemesia tridentata/Poa sandbergii). Western juniper (Juniperus occidentalis) occurs locally in draws and is expanding its range, mountain mahogany (Cercocarpus ledifolius) occurs extensively at higher elevations in rock outcrops, and shadscale (Atriplex confertifolia) and greasewood (Sarcobatus vermiculatus) occur on more alkaline and saline sites. Bluebunch wheatgrass (Agropyron spicatum), Idaho fescue (Festuca idahoensis), and Thurber's needlegrass (Stipa thurberana) are common on less disturbed sites but cheatgrass (Bromus tectorum) and snakeweed (Gutierrezia sarothrae) are prevalent throughout the area due to a long history of heavy grazing by domestic livestock.
Bitterbrush (Purshia tridentata) is present but insignificant in quantity. Bottom lands are irrigated where feasible and domestic grasses and some alfalfa are grazed by livestock and harvested as hay. On irrigated pastures there are usually two cuttings of hay. Willow (Salix sp) characterizes the riparian zones. An in-depth treatment of plant communities of JODA is given by Youtie and Winward (1977).
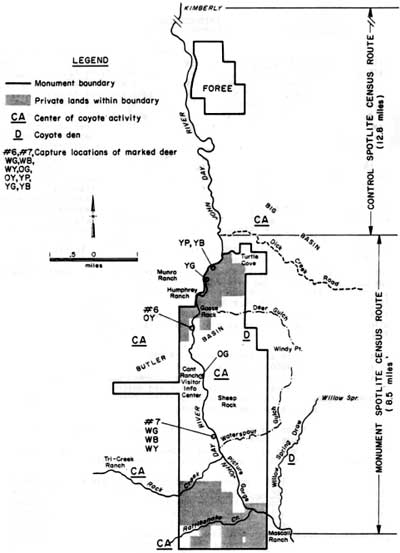
Figure 1. Sheep Rock Unit of John Day Fossil Beds National Monument and
vicinity, depicting the monument boundary, capture locations of marked
deer, centers of coyote activity, coyote dens, and spotlite census
routes.
Mule Deer
Walking surveys of the monument were conducted from early February through mid-May 1979. The primary purpose of the surveys was to search for coyote sign and dens but data on deer were collected. The number of miles walked, number and age composition of deer seen, location and plant community in which deer were observed, and location of deer carcasses were recorded. All deer jaws found were collected for subsequent age analysis. Deer were classified only when all members of a group could be identified. Large areas of open terrain could be surveyed from vantage points with 7 X 35 binoculars and a 20X spotting scope. By partitioning the monument into four quadrants and surveying each on successive days it was possible to estimate a minimum population level for wintering deer. The number of deer seen per mile walked was used for comparison with Oregon Department of Fish and Wildlife (ODFW) horseback survey routes in nearby areas.
In June, July, and August deer were captured with immobilizing darts. Dry powder injections of succiny choline chloride were administered with pre- loaded (10 and 12 mg) PNEU-DARTSTM propelled from a powder charged Palmer CAP-CHURTM rifle. The deer were hunted along the river from a vehicle in early morning and from tree stands in orchards in the evening. An attempt was made to capture any deer which presented itself within the acceptable-range of 20-50 yards. Captured deer were marked with large numbered plastic cattle ear tags and 12 inch lengths of one-inch wide colored SAFLAGTM streamers in each ear. Ten adult does were captured and individually marked with a unique color combination. The date, time, and location of all subsequent observations of marked deer were - recorded. Two-of the deer were fitted with individually identifiable radio transmitters (164MH2) which were imbedded in dental acrylic and attached to the deer with two-inch wide rubber and fabric collars incorporating a surgical tubing break-away feature. Radio-collared deer were relocated with an AVM LA-12 receiver and their locations determined by a process of triangulation. Home ranges for radio-monitored deer were determined by the minimum polygon method.
From early May through December, weekly spotlite censuses of deer were conducted along U.S. Highway 26 and State Highway 19. These highways parallel the John Day River from the Mascall Ranch to Kimberly (Fig. 1). This route was divided into two sections. The monument route was 8.5 miles long, extended from the Mascall Ranch to the Dick Creek road just north of Turtle Cove (Fig. 1), and included the Sheep Rock Unit. The control route began at the termination of the monument route and continued 12.8 miles north to the bridge over the North Fork of the John Day River at Kimberly. Censuses were initiated in the evening as soon as it became dark and each required 2-3 hours for completion. Censuses were not conducted in rain or when wind velocity consistently exceeded 10 mph.
All deer seen within range of a 250,000 candlepower hand-held spotlite were recorded. Deer were classified as to sex and age only when all individuals in a group could be identified. The habitat in which deer were seen was recorded also. These determinations were aided by 7 X 35 binoculars. The number of deer observed was expressed as the number of deer per mile of meadow.
The number of deer using the meadows along U.S. 26 from the north end of Picture Gorge to the Dick Creek road (Fig. 1) between July 12 and October 16 was estimated using the Lincoln Index (Overtop 1969). The proportion of marked deer seen on each weekly spotlite census was assumed to be representative of the proportion of total deer seen. Migratory deer departed the area in April before the population estimates began and returned in November after population estimates were terminated. Emigration and immigration were therefore assumed to be negligible. Recruitment into the population did occur during the censuses but this was accounted for by classification of the deer observed. An attempt was made to account for deer which died due to accidents or hunting along this route during the sample period as well. No tags on marked deer were lost during the study and marked deer could be easily identified with the aid of binoculars and the spotlite at night. Mortality rates for marked deer were assumed to be comparable to that for unmarked deer.
In addition to the above mentioned methods general observations of deer were recorded throughout the study and the information used to interpret deer numbers and activity. Deer which died and were found were field autopsied and their jaws collected and their ages estimated based on relative tooth wear (Robinette et al 1957).
Coyotes
The area within the boundary of the monument was intensively searched on foot from February through mid-May for sign of coyotes and evidence of denning. All coyote scats encountered on these searches were collected, their location noted, and subsequently analyzed for the presence of domestic livestock remains. Monument lands between Picture Gorge and Deer Gulch were searched (1.3 hours) for coyote dens in early April from a helicopter with a pilot experienced in aerial coyote hunting and den searches.
Age structure and reproductive status of coyotes on lands adjacent to the monument were estimated from animals taken by U.S. Fish and Wildlife Service, Animal Damage Control (USFWS-ADC) helicopter hunting operations in February and March 1979. Age was determined by analysis of cementum layers of canine teeth and the analysis was conducted by Matson's Commercial Micro-technique of Milltown, Montana, Reproductive tracts of females taken by helicopter were examined for placental scars and estimates of the number of pups per den taken in control operations on adjacent lands were utilized to estimate productivity of local coyotes.
A modification of the siren elicited howling response census technique (Alcorn 1970) was conducted concurrently with the deer spotlite censuses to estimate relative coyote populations on and off the monument. An electronic siren was sounded in the wail mode for two complete cycles and the number of coyote groups responding during the ensuing 2 minutes was recorded. Stations were spaced at approximately 3 mile intervals for a total of six stations along the spotlite census routes. The number of coyotes seen per mile on the spotlite routes was also utilized to estimate relative coyote population levels.
Local landowners with holdings adjacent to the monument were interviewed at approximately 2 week intervals to determine the season and level of livestock losses to predation. No field checks were made to verify these losses.
An attempt was made to document all coyotes killed in areas surrounding the monument. Data from helicopter hunting, USFWS-ADC trapping, road kills, private trapping and denning and hunting were included in this summary. The history of Federal coyote control from 1970-1979 was summarized from the weekly itineraries of the local USFWS-ADC District Field Assistant who has responsibility for the area adjacent to the monument. The number of coyotes taken in USFWS-ADC aerial control programs was summarized from the Pendleton District Supervisor's records.
Mule Deer
Mule deer of the John Day River valley are composed of a year-long resident segment and a migratory wintering segment (ODFW, Ralph Denney, pers. comm.). Migratory deer generally depart for higher elevation summer range in April and return in November. The resident deer are considered by local residents to be smaller and perhaps less healthy than the migratory deer. The deer population during 1979 was considered by local residents to be below normal.
Resident Deer: Meadow Utilization
The seasonal pattern and level of mule deer use of meadows both on and off the monument was estimated from the two weekly spotlite census routes. The 8.5 mile monument route (Fig. 1) included the major portion of the Sheep Rock Unit of JODA and the 12.8 mile control route (Fig. 1) included similar habitat north of and down river from the monument. Deer use was expressed as the number of deer-seen per mile of meadow to make the two routes more comparable in terms of deer forage available. The monument route included 6.1 miles of meadow and the control route included 11.1 miles of meadow.
Deer use of meadows followed similar trends on both routes (Fig. 2) although the control route had a somewhat higher rate of use from August through October. Use of meadows increased during July as vegetation on adjacent hillsides dried, peaked in mid to late August, then leveled off through mid- October. In late October use declined concurrent with decreasing temperatures and disappearance of forage-as wintering cattle were brought into the meadows. Deer use of the control route dropped dramatically in early October with the onset of deer season but recovered quickly. The monument route exhibited a similar, though not as drastic, decrease and recovery just prior to deer season (Fig. 2).
From June to early December deer use averaged 13.4 deer/mile for the control route and 9.4 deer/mile for the monument route. Although the control route average was 1.4 times as great as the monument route average-the difference between the means was not statistically significant (P< 0.05). Deer populations associated with the monument, as indexed by the spotlite censuses, thus appear to be lower than or equal to population levels for the general area in similar habitats. Spotlite censuses gave no indication that deer populations increased on the monument concurrent with deer hunting season.
Deer use on both spotlite routes was concentrated in the meadows with some usage of riparian and sagebrush habitats (Table 1). The clumped distribution of deer observed in 0.1 mile intervals along the census routes (Fig. 3) reflects the distribution of meadows along the survey routes. In late October, November, and December there was a slight tendency to detect more deer in sagebrush and Juniper hillsides as the meadows dried up and were grazed by cattle.
Figure 3. Total number of deer observed in 0.1 mile intervals on
monument and control spotlite census routes, 12 June - 18 December,
1979.
Table 1. Number of mule deer observed in each of 6 habitat types on monument
and control spotlite census routes, 7 June - 31 December 1979.
| Habitat Type | Monument Route |
Control Route | ||
|---|---|---|---|---|
| Number | Percent | Number | Percent | |
| Meadow | 960 | 73.5 | 2711 | 83.8 |
| Dry Meadow | 29 | 2.2 | 76 | 2.3 |
| Sagebrush/grass | 120 | 9.2 | 151 | 4.7 |
| Juniper/sagebrush | 9 | 0.7 | 73 | 2.3 |
| Riparian | 57 | 4.4 | 172 | 5.3 |
| Orchard | 116 | 8.9 | 28 | 0.9 |
| Unknown | 15 | 1.1 | 23 | 0.7 |
| 1306 | 100.0 | 3234 | 100.0 | |
Resident Deer: Classification and Age Distribution
The control route exhibited both a higher buck-doe ratio and a higher fawn- doe ratio than the monument route (Table 2). Both bucks and fawns were approximately twice as frequent on the control route as on the monument route. Average classification for the Northside Wildlife Management Unit in December 1979, was approximately 15 bucks: 100 does: 55 fawns (ODFW, Greg Hattan, pers. comm.). The Glass Mountain herd in northern California from 1960 through 1979 averaged 56 fawns: 100 does in the fall. The range was 40- 91 fawns: 100 does (Purcell 1979). From 40 to 45 fawns per 100 does are required for mule deer population maintenance (Schneegas and Bustead 1971). The low fawn:doe ratio from October through December (approximately 30:100) for the monument may foreshadow a population decline in the ensuing year. I suspect that the low fawn:doe ratio reflects low fawn survival rather than low birth rates as 8 of 9 adult does captured and marked in the vicinity of the monument during June, July, and August, were lactating. One doe which died in a capture attempt in June 1979 and another which was road killed in February 1980 carried twin fawns. It thus appears that potential productivity exceeded that observed in classification counts.
Table 2. Mule deer classification on monument and control spotlite census routes, 1979.
| Months | Monument Route | Control Route |
|---|---|---|
| bucks:does:fawns | bucks:does:fawns | |
| June-December | 14.6:100:31.3 (n=550) | 29.8:100:69.1 (n=301) |
| July, Aug., Sept. | 16.5:100:30.0 (n=435) | 36.5:100:64.6 (n=193) |
| Oct., Nov., Dec. | 8.9:100:29.5 (n=99) | 14.8:100:68.5 (n=178) |
The winter of 1978-79 was exceptionally cold and most deer appeared to be in poor condition even during the fawning season in June. Poor nutrition of does during the last trimester of pregnancy may result in increased neonatal mortality of fawns (Murphy and Coates 1966). The low fawn:doe ratio of monument associated deer in 1979 may reflect such neo-natal mortality rather than low productivity.
The age distribution of dead deer found on the monument is presented in Fig. 4. The sample represents those deer dying over the course of several years from all causes. The average age at death was 2.8 years for the 16 females, 2 males and 8 deer of unknown sex in the sample. Excluding fawns, which have a higher than average mortality rate, the data yields an average age at death of 3.8 years for those deer which survived their first year. Similar data were not collected on areas off the monument.
Figure 4. Percent of deer dying from all causes in each of 11 age
classes on the Sheep Rock Unit of John Day Fossil Beds National
Monument.a Age was estimated for all deer found dead,
including individuals which died during an undetermined number of
years prior to 1979.
Resident Deer: Areas Utilized by Monument Deer
Ten adult does were captured, individually marked, and released during June, July, and August, 1979, near meadows along the John Day River. Seven of the 10 does were captured on NPS owned lands within the main Sheep Rock Unit boundary and the remaining three were captured on private lands within the boundary (Fig. 1).
Four does (#7, WG, WB, WY) confined their activities to NPS owned lands near meadows on the east side of highway 19 just north of Picture Gorge (Fig. 1). Two does (#6, OW) fed at night in meadows on NPS lands and in adjacent private meadows on Rhys Humphreys' but primarily spent their days in juniper cover in western Butler Basin on private and other federal lands (Fig. 1). One doe (OG) fed in the evening and at night in the orchard at the Cant Ranch Visitor Information Center and in adjacent meadows on NPS owned lands but spent her days off the monument in juniper cover in western Butler Basin. The remaining three does (YP, YG, YB) fed in the evenings in Rob Roy Munro's orchard and in meadows near his house and primarily spent their days in juniper and mountain mahogany cover on private lands within or outside of the monument boundary. YP was observed on NPS owned lands at Turtle Cove (Fig. 1) on one occasion but it is unlikely that she made much use of the area for resting. Very little cover is available on the fossil bearing ash deposits of the NPS owned lands at Turtle Cove.
Two of the 10 does, #6 and #7, were fitted with radio collars and relocated whenever possible throughout the study. Their daily activity patterns were somewhat different.
Doe #7 was marked in the north corner of the upper meadow on 8 June, 1979, and relocated visually or by radio telemetry a total of 123 times through 22 December, 1979 (Fig. 5). During June and July #7 fed in the upper field in the evenings and rested in dense greasewood or juniper cover across the river during the day. In August, September, and October she shifted her evening feeding activities to the east meadow across the river and continued to rest in greasewood and juniper cover on the east side of the river. Her June- December home range encompassed an area of approximately 0.2 mi2 (130 acres) and included 90% of her locations (Fig. 5). Doe #7 was never observed to leave NPS owned lands within the monument All her requirements for survival were evidently satisfied in a very small area. Marked deer WG, WB AND WY were positively associated with #7 (Table 3) and most likely had similar home ranges.
Figure 5. Home range of radio-collared mule deer doe #7, 29 June -
22 December, 1979
Table 3. Observations of marked deer during 1979.
| Marked Deer Seen (1) | Number of Times Grouping was Observed |
|---|---|
| 7 | 8 |
| WG | 11 |
| WB | 7 |
| WY | 1 |
| 7, WG | 10 |
| 7, WB | 3 |
| 7, WY | 3 |
| WG, WY | 2 |
| 7, WG, WB | 4 |
| 7, WB, WY | 1 |
| WG, WB, WY | 3 |
| 7, WG, WB, WY | 8 |
| 6 | 11 |
| OW | 2 |
| OG | 17 |
| 6, OW | 13 |
| YP | 14 |
| YG | 15 |
| YB | 10 |
| YP, PG | 1 |
| YP, YB | 1 |
(1)Unlisted groupings were not observed.
Doe #6 was marked in a willow thicket at the north end of Morrison Meadow on 29 June, 1979 and relocated a total of 62 times through mid-December 1979 (Fig 6). From late June through late July she fed in Morrison Meadow in the evenings and bedded in willow thickets near the meadow. The hay in Morrison Meadow was cut in late July and she subsequently shifted her feeding activities to private meadows outside the monument boundary to the north on Rhys Humphreys' property. During this period she bedded in juniper cover in north-western Butler Basin outside the monument boundaries. In the latter part of August she made a few feeding trips to Morrison Meadow but after the second cutting of hay was made on 23 August she was observed near the meadow on only two occasions in August and once in late September. She continued to rest in juniper cover off the monument through September. In October #6 began to feed in the evenings on the east side of the river near Goose Rock in private meadows within the monument boundary. On some of these days it appeared that she rested in juniper cover on the east side of the river within the monument boundary. But by December, and probably earlier, she had shifted her activities back to the west side of the river off the monument. She was not seen near the river after 31 October, 1979. Her home range encompassed approximately 0.4 mi2 (250 acres) and she was positively associated with OW (Table 3), a doe which was marked on 16 August 1979 at the same location as # 6.
Figure 6. Home range of radio-collared mule deer doe #6, 29 June -
22 December, 1979
Rodgers et al (1978) reported average year long home ranges of 2.9 mi2 for mule deer in a semidesert grass-shrub community in Arizona. Dasmann and Taber (1956) reported that activity areas with a radius of 500 yards (0.25 mi2 [162 acres] would include 92% of all sight records of adult Columbian black-tailed deer in the north coast ranges of California. Purcell (1979) reported an average minimum polygon home range size of 5.46 mi2 (3492 acres) for radio- collared mule deer does on Lava Beds National Monument in northern California and noted that this may represent the maximum size due to mild winter conditions.
Home ranges of mule deer in other studies have been estimated to encompass 3.1 mi2 (1985 acres) for Arizona brush lands (Hanson and McCulloch 1955), 1 mi2 (640 acres) for summer range and 0.14 mi2 (90 acres) for winter range in the vicinity of Silver Lake, Oregon (Zalunardo 1965), and 0.15 mi2 (96 acres) for open habitat in Utah (Robinette 1966).
Deer will most likely have home ranges of a size that are adequate to fulfill their needs for cover, forage, and water. Once these needs are fulfilled further ranging becomes unnecessary. The home range size of deer #6 and #7 in the vicinity of the monument was smaller than generally reported for open habitats but each home range included the necessary components of forage, cover, and water.
Resident Deer: Population Level and Distribution
An estimate of the number of resident deer which used meadows along the John Day River from Picture Gorge north to the Dick Creek road (Fig. 1) was made utilizing the Lincoln Index (Overtop 1969). Between 12 July and 16 October 1979, thirteen estimates were made on weekly spotlite consensus. the average adult population estimate was 140 +33 (P <0.05). Extrapolation of this estimate, based on the percentage distribution of deer seen during spotlite censuses, to include the John Day River from the north end of Picture Gorge southeast to the Mascall Ranch (Fig. 1) yielded an estimate of 150 adult resident deer.
Based on observations of groups of deer which included marked animals and the directions from which deer arrived at meadows in early evening the following generalizations are possible. Approximately one-third of the 150 resident deer lived within about 0.25 miles of the river; the remainder fed in river bottoms at night during the summer but rested in juniper cover up to 1.5 miles from the river during the day. All resident deer were dependent on juniper for thermal cover in the hot summer months. Approximately 50% of the estimated 150 resident adults had home ranges which were located primarily within the main Sheep Rock Unit boundary. The home ranges of about 50 of these deer were located primarily on lands owned by the NPS within the boundary; the home ranges of the remaining 25 were located primarily on private lands within the monument boundary. Thus, about two-thirds of monument associated resident deer (75 with home ranges primarily outside the boundary plus 25 from private lands within the boundary) may be exposed to hunting mortality in the fall. In 1979 at least 6 of the estimated 150 resident deer were killed by hunters and one other was road-killed the night before deer hunting season opened.
The population estimate of 150 resident deer and the estimate that one-third of these are restricted to NPS owned lands (8.9 mi2) within the boundary suggests a resident adult density of 5.6/mid on NPS owned lands. Resident adult density on all lands within the monument boundary (12.3 mi2) is approximately 6.1/mi2 (50% of 150 total).2 If known or suspected resting areas outside the monument boundary (about 8 mi2 ) are included, the density would approach 7.5/mi2 on the 20 mi2 occupied by the 150 resident deer. The average summer range density for the Northside Wildlife Management Unit of 18/mi2 for 1979 (ODFW, Greg Hattan, pers. comm.) was substantially higher.
The Northside Unit, however, includes areas of high elevation summer range which have greater forage production and more extensive cover than found on the monument. Juniper cover on the monument is not extensive; the largest areas and greatest density of juniper in the vicinity occur off the monument; Although meadows within and adjacent to the monument provide green forage they do not do so consistently. Irrigation of these meadows is not intensive. Some become quite dry in July and early August then green up as water is subsequently applied. In contrast, meadows on private lands to the north along the control census route are intensively irrigated and provide a more consistent supply of green forage throughout the summer. This may partially explain the greater number of deer observed on the control route (Fig. 2).
Extrapolation of estimated deer densities associated with the main Sheep Rock Unit to the disjunct 1.6 mi2 Foree Unit (Fig. 1) suggests that the Foree Unit could contribute 9-12 individuals to the number of deer that utilize adjacent private lands during the summer. This number of deer would have accounted for approximately 14-18% of the observed deer use in meadows near the Foree Unit in 1979.
Two other situations exist where deer may utilize resting areas within the monument boundary and feed on private lands. One is the Munro meadow on the east side of the highway just north of Turtle Cove (Fig. 1). Observations of deer arriving in this meadow in the evening suggest that one-third may come from hillsides on private lands within the monument boundary to the south. The maximum number of deer observed in this meadow was 45 on 16 August 1979. It is unlikely that these deer utilized NPS owned lands at Turtle Cove as resting areas as little cover is available on the fossil bearing ash beds.
The second situation occurs at the south entrance to Picture Gorge (Fig. 1) where it appears that some of the deer which utilize the private meadow within the monument boundary south of the river come from resting areas to the north. Portions of their resting areas could be on NPS owned lands within the boundary. I estimate that an average of 10 deer per day use the northwest corner of the meadow during the summer months.
In 1979 marked deer did not exhibit daily movement patterns that included long journeys from the monument to private lands to feed and no circumstantial evidence was obtained which would suggest this was happening. Private meadows used by deer which rest on NPS owned lands are most likely included within the usual home range of the deer involved. Deer appear to make daily movements that are only extensive enough to include areas of sufficient forage quantity, cover density, and water. Dasmann and Taber (1956) noted that black-tailed deer which utilized orchards on private agricultural lands in California for feeding appeared to be those deer whose home ranges included the orchards. With some possible exceptions they found no evidence of long journeys by deer to take advantage of this special food source even when deer were unable to obtain adequate nutrition on their home areas. Leckenby (1971) and Gruell and Papez (1963) have further emphasized the fidelity of mule deer to specific areas.
National Park areas are often viewed as refuges and it is surmised that hunted individuals may seek refuge within the boundaries. Dasmann and Taber (1956) noted that intensive hunting restricted the home ranges of black- tailed deer but did not move them out of the area. They were unable to drive deer from their home ranges even though they used dogs. Deer were observed to find good cover and hide there. Rodgers et al (1978) noted increased observations of mule deer within an area closed to hunting during hunting season. They further observed an adult male to restrict his activity to that portion of his home range within the closed area during hunting season. There was no substantial increase in the number of deer observed on spotlite censuses on the monument during the mule deer season in 1979 (Fig. 2). It seems unlikely that deer would infiltrate the monument under hunting pressure as juniper cover is much less extensive on the monument than on surrounding lands. The broken topography of the monument could provide some cover, however.
Migratory Deer
Observations of the migratory segment of the deer population associated with the Sheep Rock Unit were conducted from February through April 1979. Migratory wintering deer generally depart in mid-April and return in November.
By plotting the location and number of deer observed on the monument and by censusing relatively discrete portions of the monument on successive days a minimum wintering population of 235 mule deer was estimated from February through April 1979. This estimate includes both year-long resident and wintering migratory deer. Assuming that 55% of all deer were seen (55% is the average proportion of marked deer seen on spotlite censuses) the total winter population would number about 430 animals on the same area (approximately 20 mi2) utilized by the estimated 150 year-long resident deer. More than 55% of the deer present may actually have been seen but a doubling or tripling of the resident population in winter seems reasonable. This would suggest winter densities of 15-22/mi2. The number of deer seen on walking surveys of the monument during February-April, 1979, averaged 6 per mile. Horseback surveys conducted by ODFW in March 1979 averaged 26 deer per mile in the Northside Wildlife Management Unit. Average winter density on the Northside Unit for late 1979 was 31 deer/mi2 (ODFW, Greg Hattan, pers. comm.). As with the resident population, wintering deer population levels on the monument may be limited by restricted juniper cover.
In winter, deer appear to utilize plant communities on the monument approximately in proportion to their availability. Mountain mahogany is heavily browsed, however, with nearly all shrubs being highlined or hedged.
On private lands adjacent to the eastern boundary of the Sheep Rock Unit juniper trees have been cut as part of range improvement projects. These types of areas are characterized by increased productivity of grasses due to reduced competition from western juniper for water (Jeppesen 1978). An earlier green-up in the spring due to increased solar radiation might also be expected. Deer are reported (A. Brown, pers. comm.) to make extensive use of these improved areas. An increased level of use might be expected due to greater productivity of the sites. It was not possible to directly estimate how monument resident deer used these improved areas but it is likely that migratory deer, not year long resident deer, account for most of the use. The period of greatest use in the juniper cleared areas is November-March (A. Brown, pers. comm.). This is also the period when wintering migratory deer are in the area. The improved sites are at higher elevations and monument resident deer would have to expand their home ranges or shift their area of activity substantially to include these areas. During the winter of 1979-80 none of the marked deer were observed to make such alterations in the areas they utilized. Field observations suggest that deer which rest in the heavy juniper cover in upper Waterspout Gulch and upper Deer Gulch (Fig. 1) are the most likely to forage on the range improvement sites. This heavy juniper cover is primarily outside the monument boundary. Dasmann and Taber (1956) noted that sprouting brush in chapparal burns in California did not attract black-tailed deer from their home ranges and that deer remained in their home ranges and died of malnutrition when a short journey would have brought them to adequate forage. Purcell (1979) found that mule deer on Lava Beds National Monument in California were not displaced by recent burns within their home ranges. Neither did deer extend their home ranges to include the burned areas.
Some occasional use of the range improvement areas by monument resident deer may occur but I believe the use is minor. More study of this aspect needs to be conducted and will be carried out in the spring and winter of 1980. If the major use is by migratory deer, then these deer have been exposed to hunting pressure prior to their arrival on the range improvement sites.
Coyotes
Population Characteristics
In the vicinity of the main portion of the Sheep Rock Unit coyote dens have been historically located near Windy Point, in mid-Waterspout Gulch, in west Butler Basin, and in Deer Gulch (Fig. 1). In 1979, coyote dens or centers of activity, as determined from ground searches, observations, and coyotes howling in response to a siren, were located in East Butler Basin, Big Basin, midway up Willow Spring Draw, and north of Rock Creek near the Tri-Creek Ranch (Fig. 1). Circumstantial evidence indicates an additional activity center in upper Rattlesnake Creek (Fig. 1). I suspect a group may have utilized West Butler Basin but have no consistent evidence to support that suspicion. Only the family group in East Butler Basin which consisted of 2 adults and at least 4 pups in July, made extensive use of the monument. Coyotes from the Willow Spring Draw group frequently traveled across the corner of NPS owned lands to reach the river bottom. Coyotes from the other locations, and I assume each represents a family group, undoubtedly traveled on the monument at times due to the wide ranging nature of coyotes.
No active coyote dens were found within the boundary of the monument through May 1979, even though the area was searched on foot almost daily from February through mid-April and an additional 1.3 hour search was made in early April from a helicopter. Only one coyote was observed on the helicopter search.
In September a "clean out" or den which had evidently been used by coyotes was found within the monument boundaries in northeastern Butler Basin (Fig. 1). This den was not present in late May. Coyotes may have several dens during the course of pup rearing in one year (Gier 1975), and since this den was not present in May it is unlikely it was a whelping den. Most likely the pups associated with this den were whelped in the vicinity of Windy Point, a historical denning area. It also seems likely that this den was associated with the family group of coyotes which had their center of activity in Butler Basin immediately east of the Cant Ranch Visitor Information Center during 1979 (Fig. 1).
The distribution of known coyote dens or activity centers (Fig. 1) in the vicinity of the monument in 1979 was consistent with 6-102 non-overlapping home ranges of adult females that has been reported by Chesness and Bremicker (1974), Hibler (1977) and Andelt and Gipson (1979). Although coyotes are abundant in the vicinity of the monument there was no evidence that they concentrated their denning on the monument to take advantage of the NPS no hunting policies. Only one of six known or suspected coyote centers of activity was located within the monument boundary.
Analysis of coyotes taken in USFWS-ADC helicopter control programs on adjacent private lands in February and April, 1979, indicated an even sex ratio. Seven of 9 females were young of the year and the overall age distribution (Fig. 7) showed 43% to be one year old or less. This is consistent with the 42-56% pups in winter samples of exploited populations in Utah (Knudsen 1976). The two adult females were not yet pregnant in February but showed evidence of having been pregnant before. Persons involved in den hunting on lands adjacent to the monument report an average of seven pups per litter. Although this is a high average litter size, it is reasonable for an exploited population in good habitat.
Figure 7. Age distribution of coyotes taken in helicopter control
operations in the vicinity of John Day Fossil Beds National Monument,
February and March, 1979.
Coyotes are wide ranging animals. Twenty to 30 mile movements are not uncommon (Robinson and Cummings 1951) and average distances between marking and recapture of 9.5 miles (Nellie and Keith 1976) and 14.2 miles (Robinson and Grand 1958) have been reported. Maximum movement recorded has been 115 miles (Robinson and Grand 1958). Ozoga and Harger (1966) reported winter ranges of 36-50 mi2 for coyotes in Michigan and Hibler (1977) reported that total area utilized was 53.3 mi2 for adult females and 34.8 mi2 for adult males in Utah.
Due to the small size (12.3 mi2) and long narrow shape of the Sheep Rock Unit in comparison to the large areas used by coyotes it was infeasible to sample in a manner that would give a reasonable population estimate for the monument. A theoretical population estimate can be calculated, however. Assuming an average 7.5 mi2 home range for adult females (Chesness and Bremicker 1974; Hibler 1977; and Andelt and Gipson 1979), seven pups per litter from local estimates, 50% pup mortality and 20% adult mortality from whelping through November (Gier 1968), and an equal number of breeding and non-breeding pairs, an annual cycle of coyote numbers for the monument can be constructed. On the 12.3 mi2 within the monument boundary pre-whelping density would average 7 adults and with whelping this would increase to 18. Subtracting pup and adult mortality through November this would leave a late fall population of about 11. Winter mortality and dispersal would reduce this to 7 prior to whelping the following year assuming a stable population. Dispersal of the 4-5 pups present in excess of those necessary to replace dying adults would be expected if the population remained stable.
Other population cycles could be calculated using different assumptions. For example the 8.9 mi2 of NPS owned lands within the 12.3 mi2 monument boundary would have a spring:whelping:fall population of 5:13:8. Assuming smaller home ranges of 5 mi2 would yield 10:27:16 for the 12.3 mi2 within the boundary and 7:20:12 for the 8.9 mi2 of NPS owned lands. Assuming dispersal of all pups in excess of those necessary to replace dying adults the contribution to surrounding areas in the winter could range from 4-6 individuals.
Coyote control efforts on lands surrounding the monument are moderate to intense. During 1979 at least 125 coyotes were killed on areas surrounding the monument. This included hunting, government control programs and private trapping and control operations. As well as could be determined the 125 coyotes were killed within an area of about 40 mi2 (including the Sheep Rock Unit of the monument). If 20% of coyotes present were killed a density of 16/mi2 would be indicated and if 50% were killed a density of 5/mi2 would result. It is unlikely that as many as 50% of the coyotes present were killed. Densities for coyotes are generally assumed to range between 0.5 and 2 per square mile over most of their range but may range as high as 6/mi2 under favorable circumstances (Knowlton 1972). The large number of coyotes killed in the vicinity of the monument in 1979 suggests that there is substantial infiltration into the general area. Catches of 15 coyotes during the year near Rattlesnake Creek in an area of approximately 1 mi2, and the trapping of 15 coyotes in west Butler Basin from October through December 1979 suggests that these are major points of immigration. Movements into the area may reflect coyotes leaving higher elevation summering areas for the warmer river valley in winter. Most of this immigration would be expected in the winter concurrent with dispersal and breeding activities. Most of the kills (70%) occurred from October through December.
Even if coyotes which utilize the monument do contribute 4-6 dispersing pups to the surrounding area that number would constitute a relatively insignificant proportion of the numbers of coyotes which must utilize adjacent private and federal lands.
Because of the small size and long, narrow shape of the monument it is unlikely that any coyotes which utilize the monument do so exclusively. When they are off the monument they would be exposed to moderate to intense control pressure. Hibler (1977) noted that among radio collared coyotes in his study 50% were trapped more than 0.3 miles from the boundary of their home ranges, and 42% were trapped on the periphery of their home ranges. Eight percent, all juveniles, were trapped within their home ranges and none of the 21 animals killed by hunters or trappers died near the center of their respective home ranges. Of these 21, 71% were killed an average of 6.8 mi outside their home range boundaries.
Even though there may be centers of coyote activity within the monument the monument coyotes must be considered to be part of an exploited population. This is because coyotes are wide ranging, the monument is small in relation to coyote ranges, the probability of coyotes being captured or killed is greater outside their home ranges, and the areas adjacent to the monument are subject to coyote control. Robinson and Cummings (1951) found no evidence that control efforts drove coyotes into Yellowstone National Park or that coyotes recognized the park as a sanctuary. A similar situation most likely exists on the Sheep Rock Unit of JODA.
The relative coyote population level as indexed by the frequency of response to the siren (Monument= 0.57 groups/station; Control = 0.22 groups/station) and number of coyotes seen per mile (Monument = 0.08 coyotes/mile; Control = 0.05 coyotes/mile) on spotlite deer census routes averaged twice as high on the monument route as the control route. I believe this reflects a generally higher population in areas in the vicinity of the monument rather than a large monument population as the number of coyotes seen and responding to the siren were equally distributed between monument and private lands. The number of coyotes shot or trapped by the USFWS-ADC District Field Agent on adjacent private lands from 1970-1979 (Fig. 8) and the number of coyotes taken per hour of USFWS-ADC helicopter hunting (Fig. 7) on adjacent private lands from 19741979 did not exhibit an increasing trend after the monument was established in 1975. If any protection afforded coyotes by the monument was increasing general population levels in the area an increase in the number of coyotes killed by control operations would be expected.
Figure 8. Number of coyotes trapped, shot, taken with M-44 devices or
known poisoned on private lands adjacent to John Day Fossil Beds
National Monument, 1970-1979; and, number of coyotes taken per hour
of helicopter hunting, 1974-1979, on private lands adjacent to the
monument.
Pattern of Predation Losses
One major sheep ranch borders the monument on the northwest. Some private lands of this ranch (Humphreys, Fig. 1) are within the monument boundary and sheep are grazed on these lands. The Humphreys' operation uses range lambing. Lambs are born near the ranch in late March and moved to higher elevation spring ranges six miles west at Buckhorn in late April. The sheep remain there until July when they are moved to summer range on the Ochoco National Forest to the southwest and returned to Buckhorn in early October. The sheep remain at Buckhorn until inclement weather drives them back to the vicinity of the ranch house in mid-November. They remain there until lambs are ready for spring range again.
Mr. Humphreys reported no loss from 1 January through 18 March 1979, then lost four ewes in the ensuing 10 days. In late March he began to find lambs which had been fed upon by coyotes and estimated his loss through April at approximately 2 lambs every 3 days. The greatest losses occurred when sheep were moved to spring range at Buckhorn, 6 miles to the northwest of the monument. From May 4-22, 200 lambs were reported missing; 78 of these were found and had been fed upon by coyotes. It is likely that these losses were coyote caused as the lambs were 6-8 weeks old and past the age when post natal natural mortality is common. Losses abated somewhat after May and there was no trouble while on Forest Service summer range.
Sheep were returned to Buckhorn in early October and between their return and 10 Jan 1980, 33 sheep were reported killed by coyotes. Three of these were killed near the ranch house which adjoins the monument on the northwest. During this same time period 15 coyotes were trapped in western Butler Basin. Mr. Humphreys' reports that his loss to coyotes in 1979 was the worst he has ever had.
Predator loss on other adjoining private lands was light in comparison to Humphreys'. Mascall's lost three sheep from mid-September through December at their ranch. Rod Immenschuh lost young chickens to coyotes at his ranch on Rattlesnake Creek in early fall, lost two large lambs which strayed onto NPS lands in Picture Gorge in mid-summer and an adult sheep one to two months later approximately one mile northwest of his ranch. Carcasses of the sheep were not found but Immenschuh assumes they were killed by coyotes. In addition to these losses Rob Roy Munro reported that a cow giving birth was killed by coyotes in early summer on his property northeast of the monument. Although I made no field checks to verify the losses reported by Humphreys and others, I believe they are honest appraisals of the situation on the respective ranches and that the reports were made in good faith.
Food Habits
Coyotes are opportunistic feeders and have been documented to eat a broad range of foods (Sperry 1941). Rodents were the most frequent item in coyote scats collected on the monument in 1979, and occurred in approximately 80% of scats examined. Deer were next most frequent occurring in about 30% of scats and they were followed by birds at 17% and insects at 15%. Sheep wool was found in 5% of scats and all scats which contained sheep wool came from that portion of the monument in the vicinity of the Humphreys' sheep ranch. Although it is not an important component of their diet, coyotes which utilize the monument do evidently eat some sheep.
Mule Deer
Mule deer associated with the Sheep Rock Unit of the John Day Fossil Beds National Monument consist of a year-long resident segment and a migratory wintering segment which is generally present from November through April.
In 1979, 150 adult year-long resident deer were estimated to use the John Day River valley from the Mascall Ranch north to the Dick Creek road in Big Basin. Approximately one-third of these deer lived within 0.25 miles of the river and the remainder fed in meadows along the river in the evening but rested in juniper cover up to 1.5 miles from the river during the day. All resident deer were dependent on juniper thermal cover during the hot summer months.
Approximately one-half of the 150 resident adult deer had the major portion of their home ranges within the main Sheep Rock Unit boundary. About 50 of these 75 deer had the major portion of their home ranges on lands owned by the NPS within the boundary; home ranges of the remaining 25 were on private lands within the boundary. Of the 150 total, 75 which had the major portion of their home ranges outside the monument boundary plus the 25 from private lands within the boundary were thus potential members of the area's huntable population. The deer population associated with the monument can be considered to be a potentially exploitable population since the home ranges of about 100 of the 150 total deer were located primarily outside NPS owned lands.
The summer resident population of deer associated with the monument had an estimated 1979 density (7.5/mi2) which was noticeably less than the average for the Northside Wildlife Management Unit (18/mi2). This may be because the Northside Unit includes areas of more productive high elevation summer forage and more extensive thermal cover.
Three situations exist where deer which rest in cover within the boundary of the monument may feed on adjacent private lands. The Foree Unit may contribute 9-12 deer to meadow use on adjacent private lands and approximately 10 deer may come from the monument to feed in Mascall's private lands within the boundary at the south entrance to Picture Gorge. Approximately one-third of the maximum of 45 deer which fed in Munro's meadow on the east side of the road north of Turtle Cove in 1979 may have rested in cover within the monument boundary but on Munro's private land. On the balance it appears that two to three times as many deer come from private or other lands to feed on NPS owned lands as go from NPS owned lands to feed on private lands.
Two radio-collared deer associated with the monument had home ranges of 0.2 mi2 and 0.4 mi2. Observations of these two does and eight other individually tagged does gave no indication that deer associated with the monument made long journeys to utilize forage on adjacent private lands. Use of private lands for feeding is most likely accounted for by deer whose normal home ranges include private lands.
Deer use of meadows increased in July, peaked in August then declined dramatically in late October. There was no evidence that the deer population associated with the monument was greater than in nearby areas of similar habitat. Buck: doe and fawn:doe ratios for the monument were only about one- half that observed on nearby areas of similar habitat. The low fawn:doe ratio of 30:100 may foreshadow a population decline in the vicinity of the monument in the ensuing year.
Deer did not appear to make major use of the monument as a refuge during hunting season as evidenced from spotlite censuses. It seems unlikely that deer would use the monument as a refuge when juniper cover is more extensive on adjacent lands.
Arrival of migratory wintering deer may double or triple the resident population and result in winter densities of 15-22/mi2. This is less than the Northside Unit winter average of 31/mi2 for 1979 and may reflect the lack of extensive thermal cover on the monument.
Substantial deer use of range improvement areas adjacent to the eastern boundary of the monument is reported from November through March. It was not possible to directly estimate how monument resident deer contribute to this use. It is most likely that migratory wintering deer account for most of the use as the season of the problem occurs concurrently with their presence on the area. Monument resident deer would have to make substantial alterations of their home ranges to include the improved areas and to date no evidence that this occurs has been obtained.
Coyotes
No active whelping dens were located on NPS lands in 1979. One family group had its center of activity on NPS lands near the Cant Ranch Visitor Center after whelping. It is suspected that this family group was whelped in the vicinity of Windy Point.
Active dens and centers of activity were located on non-monument lands nearby and the distribution of these areas was consistent with average 7.5 mi2 mutually exclusive home ranges of adult females that has been reported by Hibler (1977) Chesness and Bremicker (1974), and Andelt and Gipson (1979). Only one of the 6 known or suspected activity centers for coyotes in the vicinity of the monument was located on NPS owned lands.
Theoretical calculations of the number of coyotes utilizing the monument suggest pre-whelping populations of 5-10 individuals and fall populations of 8-16. The dispersal contribution of the monument to the surrounding area could average 5 individuals.
Due to the small size and long narrow shape of the monument in relation to the wide ranging nature of coyotes it is doubtful that any coyotes make exclusive use of the monument. Control efforts on nearby areas are moderate to intense and any coyote utilizing the monument must be considered part of the exploited local population.
Coyote populations in the vicinity of the monument appear to be greater than in comparable habitat along the river to the north. This most likely reflects an area phenomenon rather than a characteristic of the monument as the number of coyotes seen and the number responding to a siren on the monument census route were equally distributed between monument and private lands. The number of coyotes killed in the vicinity of the monument in 1979 suggests substantial immigration into the area, particularly in the winter.
Principal food items of coyotes which use the monument, as determined from frequency of occurrence in scats, were rodents (80%), deer (30%), birds (17%), and insects (15%). Sheep wool was found in 5% of the scats examined and these all came from that portion of the monument immediately adjacent to the sheep ranch of Rhys Humphreys. Coyotes which utilize the monument do eat some sheep although it is not a principal component of their diet.
The sheep ranch adjoining the monument experienced substantial losses to coyotes in 1979 but the majority of these losses occurred on spring range 6 miles to the northwest of the monument. These losses were likely caused by coyotes resident on the spring range.
Neither the number of coyotes taken by government trapping nor the complaint levels in the area have increased noticeably since establishment of the monument in 1975. The predation problems experienced in 1979 on adjacent private lands appears to be an area phenomenon that cannot be directly attributed to the presence of the monument.
Mule Deer
No active mule deer population control is warranted at this time. The resident population density is relatively low, productivity is low and more deer appear to come onto the monument to feed in meadows than go off the monument to feed in private meadows. Approximately two-thirds of the resident deer which utilize river meadows are already exposed to hunting mortality. The population can be considered to be potentially exploitable.
If meadow irrigation is ceased when cattle are removed from the monument the effects on resident deer should be investigated. Alteration of the meadow forage base may cause displacement of monument deer or reduce the vigor of the herd. To determine if displacement occurs it will be necessary to use radio telemetry to determine the areas used by deer both before an after irrigation ceases. Determination of the effects on herd vigor will require before and after estimates of herd productivity.
Continue to monitor deer population levels. This study has been conducted during only one year. Information from successive years is necessary to address year to year variation. There is the possibility that populations could increase and necessitate re-evaluation in subsequent years. A more detailed investigation of deer use on adjacent range improvement areas should be included in the continued monitoring.
Determine the summer range of migratory deer. This will allow a more complete understanding of the importance of monument lands to deer populations in the area.
Coyotes
An active coyote control pro-tram on the monument is not warranted at this time. The monument lies within an area of moderate coyote density but is too small, considering the space requirements of coyotes, to contribute substantially to local problems. Any coyote which does utilize the monument is exposed to control efforts when off the monument. Due to their wide ranging nature the monument coyotes are part of the locally exploited population and are as likely to be taken in control operations as coyotes which do not use the monument.
Monitor coyotes on the monument for a second year. Although no active dens were found on the monument in 1979, den locations can fluctuate from year to year. Data from a second year will allow an assessment of year to year variation in coyote use of the monument.
Maintain liaison with U.S. Fish and Wildlife Service, Animal Damage Control and adjacent landowners. Coyotes are noted for their variability and continued monitoring of the local control and predation loss situation will assist in understanding the long-term relationship of the monument to adjacent lands.
Alcorn, J. R. 1970. Directions for censusing problem animal populations. Bur. Sport Fish. Wildl., Div. Wildl. Serv. Unpub. rpt. 6pp. mimeogr.
Andelt, W. F., and P. S. Gipson. 1979. Home range, activity, and daily movement of coyotes. J. Wildl. Manage. 43:944-951.
Chesness, R. A. and T. P. Bremicker. 1974. Home range, Territorality, and sociability of coyotes in north central Minnesota. Presented at the Coyote Research Workshop, 14-17 November 1974; Denver, CO. 17pp.
Dasmann, R. F. and R. O. Taber. 1956. Behavior of Columbia black-tailed deer with reference to population ecology. J. Mammal. 37:143-164.
Gier, H. T. 1968. Coyotes in Kansas. Kansas State Coll. Agric. Exp.
Sta. Bull. 393 (revised). 118 pp.
------, 1975. Ecology and behavior of the coyote. pp. 247-262 in
M. W. Fox (ed.) The Wild Canids. Van Nostrand, New York.
Gruell, G. E., and N. J. Papez. 1963. Movement of mule deer in Northeastern Nevada. J. Wildl. Manage. 27:414-422.
Hanson, W. R., and C. H. McCulloch. 1955. Factors influencing mule deer on Arizona brush lands. Trans. N. Am. Wildl. Conf. 20:568-588.
Hibler, S. J. 1977. Coyote movement patterns with emphasis on home range characteristics. M. S. thesis. Utah State Univ., Logan. 114 pp.
Jeppesen, D. J. 1978. Competitive moisture consumption by the western juniper (Junipervs occidentalis) pp. 83-90 in Proc. of the West. Juniper Ecol. and Mgt. Workshop, Bend, Oregon, 1977. USDA For. Serv. Gen. Tech. Rpt. PNW-24.
Knowlton, F. F. 1972. Preliminary interpretations of coyote population mechanics with some management implications. J. Wildl. Manage. 36:369- 382.
Knudsen, J. J. 1976. Demographic analysis of a Utah-Idaho coyote population. M. S. thesis. Utah State Univ., Logan. 195 pp.
Leckenby, D. A. 1971. Management of mule deer and their habitat: applying concepts of behavior, physiology and microclimate. Proc. West. Assoc. State Fish and Game Comm. 51:206-217.
Murphy, D. A. and J. A. Coates. 1966. Effects of dietary protein on deer. N. Am. Wildl. Nat. Res. Conf. Trans. 31:129-138.
Nellis, C. H. and L. B. Keith. 1976. Population dynamics of coyotes in central Alberta, 1964-68. J. Wildl. Manage. 40:389-399.
Ozoga, J. J. and Em M. Hager. 1966. Winter activities and feeding habits of northern Michigan coyotes. J. Wildl. Manage. 30:808-819.
Overton, W. S. 1969. Estimating the numbers in wildlife populations. (pp. 87- 109.) in R. H. Giles Jr., (ed.) Wildlife Management Techniques. The Wildlife Society, Wash. D.C.
Purcell, A. 1979. Seasonal movements and home ranges of mule deer at Lava Beds National Monument. M. S. thesis. Oregon State Univ., Corvallis, 69 pp.
Robinette, W. L. 1966. Mule deer home range and dispersal in Utah.
J. Wildl. Manage. 39:335-349.
------, D. A. Jones, G. Rogers, and J. S. Gashwiler. 1957. Notes on
tooth development and wear for Rocky Mountain mule deer. J. Wildl.
Manage. 21:134- 153.
Robinson, W. B. and M. W. Cummings. 1951. Movement of coyotes from
and to Yellowstone National Park. U. S. Fish and Wildl. Serv. Spec. Sci.
Rep. Wildl. ll. 17 pp.
------, and E. F. Grand. 1958. Comparative movements of bobcats and
coyotes as disclosed by tagging. J. Wildl. Manage. 22:117-122.
Rodgers, K. J., P. F. Ffolliott, and D. R. Patton. 1978. Home range and movement of five mule deer in a semi desert grass-shrub community U.S.D.A. For. Serv. Res. Note RM-355. 6 pp.
Schneegas, E. R., and R. S. Bumstead. 1971. Decline of western mule deer populations: probable cause, tentative solution. Proc. West. Assoc. State Fish and Game Comm. 51:218-232.
Sperry, C. C., 1941. Food habits of the coyote. U. S. Fish Wildl. Ser. Res. Bull. 4. 70 pp.
Youtie, B. A., and A. H. Winward. 1977. Plants and plant communities of John Day Fossil Beds National Monument. Report on file, John Day Fossil Beds National Monument. 81 pp.
Zalunardo, R. A., 1965. The seasonal distribution of a migratory mule deer herd. J. Wildl. Manage. 29:345-351.
griffith/index.htm
Last Updated: 09-Jan-2000