|

Principle Investigators
Jon L. Riedel, North Cascades National Park
Andrew Fountain, U.S.G.S. Water Resources Division
Bob Krimmel, U.S.G.S. Water Resources Division
North Cascades National Park Service Complex
2105 State Route 20
Sedro Woolley, WA 98274
| INTRODUCTION |
Glaciers are one of the most valuable resources in the North Cascades National Park Service Complex (NOCA). Approximately one-third of all the glaciers in the lower 48 states are within the park (Post et al. 1971). Over 300 glaciers in NOCA are a vital component of hydrologic systems and aquatic ecosystems. They also influence soil development, the distribution of vegetation, flooding and are unique indicators of climate change. Since the end of the Little Ice age in the late 1800's, glaciers have retreated throughout NOCA, and several dozen glaciers have probably disappeared (Riedel, 1987).
To understand climate change, the glacier resource, and the effect of glaciers on other resources at NOCA, long-term monitoring of glaciers is needed. South Cascade Glacier, located just outside NOCA, has been monitored by the U.S.G.S. - Water Resources Division for over 30 years. It is not known, however, how representative South Cascade Glacier is of NOCA glaciers in general because of the influence of non-climatic factors such as geographic position, aspect and elevation. Once the influence of non-climatic factors is understood, a long-term monitoring scheme can be developed.
To develop an understanding of regional mass balance of glaciers, the North Cascades-National Park Service Glacier Monitoring Program began in spring 1993. The current goals of this program are to:
- Monitor annual variation in glaciers across the park;
- Determine how well S. Cascade Glacier represents other glaciers in the park;
- Assess change in glaciers at several time scales;
- Provide data on the importance of glaciers to aquatic ecosystems; and
- Develop methods for monitoring the entire population of glaciers in the park.
| 2002 WORK PLAN |
We are entering our tenth year of this program with A 10-year summary planned for publication next year. In addition to the usual accumulation and ablation measurements each glacier will be remapped in detail to quantify terminus and surface elevation changes from the last 10 years. In July, eight volunteers recruited by the Earthwatch Institute will assist us in summer measurements on the four monitored glaciers. Two North Cascades backcountry rangers will be assisting along with the volunteers to collect extra snow probe depth points.
We have expanded our reach to investigating two glaciers on Mount Rainier (Nisqually and Emmons). Preliminary spring results show a marked snow shadow on the NE side of the mountain (Emmons) compared to the S side (Nisqually).
| GLACIERS SELECTED FOR MONITORING |
Glaciers were selected based on their geography, aspect, elevation range, shape, safety of access, and past monitoring efforts. After careful consideration of all 300 glaciers in the park, four were chosen, and include Noisy Glacier on Bacon Peak, Silver Glacier on Mount Spickard, North Klawatti Glacier on Primus Peak, and Sandalee Glacier on McGregor Mountain.
Noisy Creek Glacier is a cirque glacier located northwest of Bacon Peak, Bacon Peak quadrangle. Post et al. (1971) glacier number 2219-1. Characteristics of the glacier from a 1973 inventory include: area 0.5 square km, length 1.4 km, direct snowfall and minor snow drift accumulation, not appreciably crevassed, ends on moderate to gentle slopes, slight retreat in 1973, elevation range 2040m-1650m (390m range).
Silver Glacier is a valley glacier located on the north side of Mt. Spickard, Mt. Spickard quadrangle. Post et al. (1971) glacier number 2236-6. Characteristics of the glacier from a 1973 inventory include: area 0.9 square km, length 1.8 km, accumulation sources direct snowfall and minor snowdrift, moderately crevassed, 1973 calved into silver lake and slight retreat, elevation range in 1968 based on the 7.5 minute quad is 2713m-1982m (731m range).
North Klawatti Glacier is a valley glacier located south of Primus Peak, Forbidden Peak quadrangle. Post et al. (1971) glacier number 2253-10. Characteristics of the glacier include: area 1.6 square km, length 2.3 km, accumulation sources direct snowfall and minor snow drift, moderately crevassed, ends on moderate to gentle slopes, 1973 slight retreat, elevation range 2270m - 1540m (730m range). The glacier has recently been studied by the USGS (Tangborn, Fountain and Sikonia, 1990; Meier, 1966). Topographic maps and data gathered during these investigations will be useful to this study.
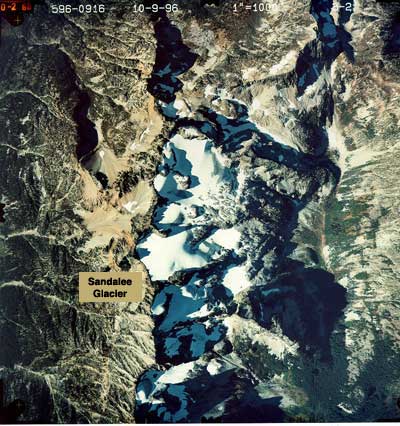
Sandalee Glacier
| METHODOLOGY |
Methods used to monitor these glaciers follow procedures established by the U.S. Geological Survey during more than 40 years of monitoring South Cascade Glacier, which is located just south of the park. In sum, the surface mass balance of these glaciers is monitored using a two-season approach to calculate mass (water) gained and mass lost on a seasonal basis. These glaciers gain most of their mass by surface accumulation of snowfall during the winter, when the park receives approximately three-fourths of its annual precipitation. Likewise, most of the melting (ablation) occurs at the surface, and by monitoring surface changes we account for approximately 90% or more of the annual change of a glacier's mass.
Our methods require us to visit each glacier at least two times annually. In late-April, when the accumulation season is ending, we probe thickness of the snowpack across the surface of the entire glacier. At the same time, we use a backpack-mounted steam drill to melt holes 8-9m into the glaciers. Four to five stakes per glacier are placed in these holes, and are used to monitor the amount of the previous winter's snow, as well as underlying firn and ice, that melts through the following summer. A late September visit is used to measure final melting and remove the stakes. Mid summer measurements are used to provide additional data on rate and processes of melting. Measurements taken at the stakes are averaged across the entire glacier to determine mass balance.
We monitor the area of these glaciers by taking aerial photographs (see below) of them at the end of the melt season. Many people have asked why we don't just monitor changes in the area, or, terminus activity of these glaciers. The reason we don't monitor these aspects only is that glacier movement is a complex process influenced by the steepness of the mountainside a glacier rests on, the absence or presence of water at the base of the glacier, ice thickness, and other factors. Thus, changes in size of a glacier may not give a clear signal of the relationship between the glacier and climate, or allow for the monitoring of more subtle variations.
| ICE RADAR |
Additional monitoring efforts have been conducted on Noisy and North Klawatti glaciers. Ice radar was used to estimate the thickness of these glaciers in 1995 with the assistance of the University of Washington. Noisy Glacier had a maximum thickness of 159m (523 ft), while data from upper N. Klawatti Glacier was difficult to interpret due to the presence of the steep Austera Towers arete along the south edge of the glacier. Laser profiling from a small airplane was used to survey the elevation of a longitudinal profile of these same glaciers in 1996. This new technique was developed and applied by Dr. Echelmeyer from the University of Alaska Fairbanks to dozens of glaciers in a survey from Alaska at the north end and North Cascades National Park at the south end. This survey will provide an important benchmark and elevation control on these glaciers for decades. In 1998, a remote weather station was placed on Noisy Glacier (elevation 1760m-5800 ft) for three weeks to determine how well lower-elevation weather stations represented conditions on higher elevation glaciers. Solar radiation, temperature and wind speed were recorded hourly. Analysis of this data is incomplete, but it is clear that the glaciers receive substantially more solar energy that stations a few hundred meters below them. These comparisons will allow us to use the data at the mid-elevation weather stations more effectively in monitoring all of the glaciers in the park.
| AERIAL PHOTOS OF GLACIERS |
The following are a series of aerial photos of the glaciers under study.
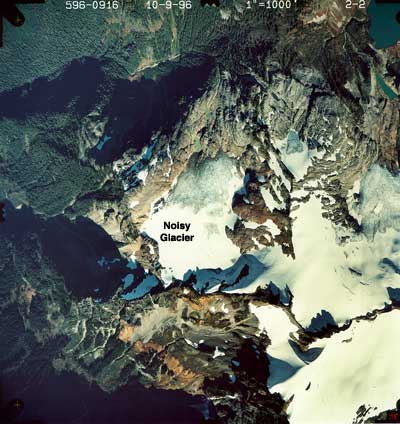
The aerial photo of Noisy Glacier was taken on October 9th, 1996. This glacier is located on the northwest face of Bacon Peak, and drains into Noisy Creek and the Baker River. It is the lowest elevation glacier in our monitoring program, with a terminus at 1650m. This glacier receives abundant snowfall due to its location on the western flank of the North Cascade Range in the wet Baker Watershed. The glacier had a positive balance for the 1996 water year.
As much as 1.5 meters of snow from the previous winter (1995-1996) remained on the upper end of the glacier in late September. The snow surface appears white in this image, and contrasts with the dirty gray of firn (winter 1994-1994 snow), and the blue gray glacial ice. After the hot summers of 1993, 1994, 1995 and 1998 there was no snow left on the surface of this glacier. As a result of several decades of similar conditions, this glacier is presently shrinking rapidly.
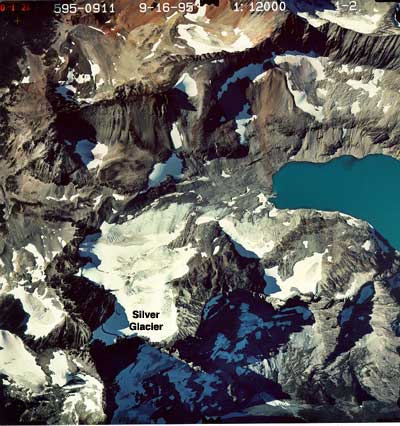
The aerial photo of Silver Glacier was taken on September 16th, 1995. This glacier faces north-northwest on Mt. Spickard, near the border with Canada. It drains into Silver Lake, which feeds into Ross Lake and the Skagit River. It is the highest elevation glacier in our program, with an elevation range of 2713-1982m Silver Glacier had a positive balance in the 1995 water year. As much as 3.5 meters of the previous winter's (1994-1995) snow remained on the upper portion of the glacier in mid-October of 1995.
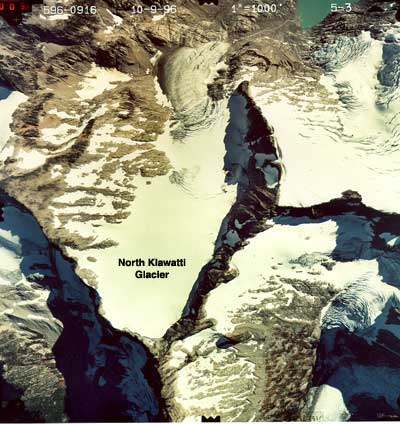
The aerial photo of North Klawatti Glacier was taken on October 9th, 1996. This glacier faces southeast and is located between Austera Towers and Primus Peak. It drains into Klawatti Lake, which feeds into Thunder Creek, Diablo Lake and the Skagit River. With a surface area of 1.5 km2, this is the largest glacier we monitor. Boston Glacier to the southeast is the largest glacier in the park with a surface area of 6 km2 . This glacier had a positive balance for the 1996 water year. Two and a half meters of snow from the previous winter (1995-1996) still remained on the upper portion of the glacier in late September. Note the large expanse of blue-gray glacier ice on the lower part of this glacier, where ice and snow melt is typically more than 8m.
The aerial photo of Sandalee Glacier was taken on October 9th, 1996. This glacier faces almost directly north and is located on the boundary between North Cascades National park and Lake Chelan NRA. Sandalee is a small cirque glacier on the north side of McGregor Mountain and drains into South Fork of Bridge Creek, which drains into the Stehekin River and Lake Chelan. Sandalee Glacier had a positive balance for the 1996 water year. Just over 2 meters of snow from the previous winter (1995-1996) was found in the middle part of the glacier in late September. The middle portion of the glacier often accumulates more snow than the top portion due to drifting of snow from adjacent glaciers.
| 1999 WORK PLAN |
This year will be a very exciting year for those of us fortunate enough to study the glaciers of the North Cascades. First, we should be able to continue mass balance monitoring of the four glaciers. Second, we have secured grants to obtain new maps of these glaciers, and to conduct the first comprehensive inventory of glaciers in the park since the late 1960's. Third, a graduate student from Western Washington University is planning to conduct a research project on melting patterns of Noisy Glacier. Finally, we will continue to collaborate with the US Geological Survey Water Resources Division, and with the USDA Natural Resource Conservation Service by sharing costs on remote weather and snow survey stations.
| MASS BALANCE BY GLACIER AND ELEVATION CHARTS |
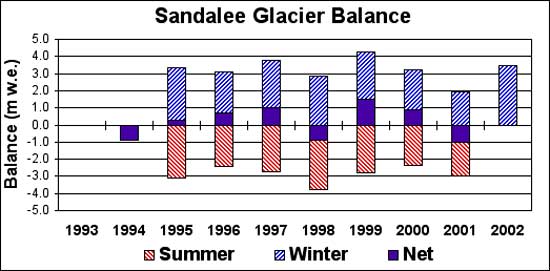
| Glacier Balance Charts |
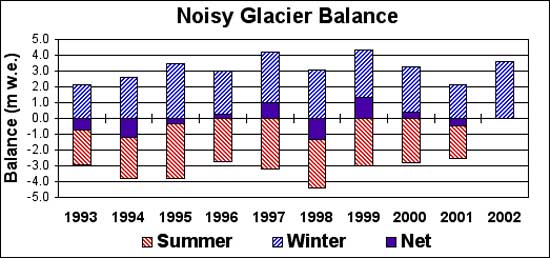
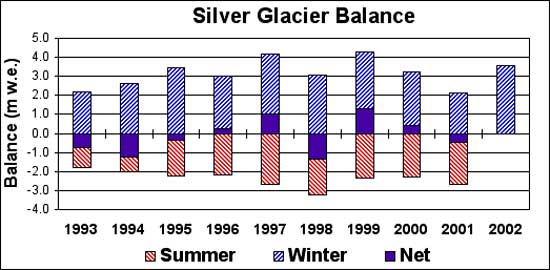
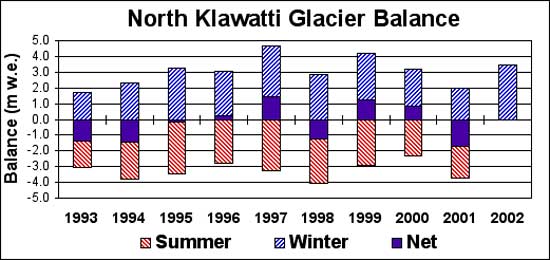
The four charts below summarize data collected over the past six years for each glacier. The vertical axis is the amount of water gained (winter balance), lost (summer balance), and retained (net balance) in meters of water equivalent. We use water equivalent as a measure because of the varying density of snow, ice and firn. This system allows us to summarize the melting of all three as one value. The horizontal axis lists the elevation of each station on each glacier. Note that North Klawatti and Noisy glaciers have five stations, while the others have only four stations each due to their smaller size. Note that the winter balance is always positive, while the summer balance is always negative. The net balance varies depending on whether or not the snowfall from the previous winter survived the following summer. Also note that the lower elevation stations almost always have negative net annual balances, while the upper stations almost always have positive net annual balances. Melting at the lowest stations is often more than 8m vertically! |
    | |
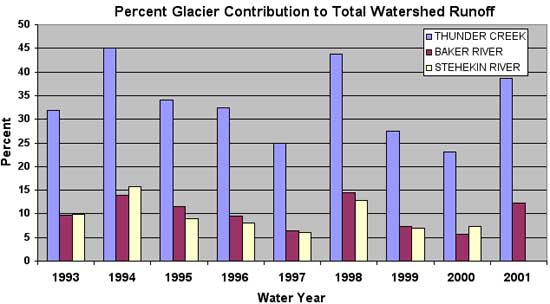
| Glacial Runoff Chart |
The following charts list the annual amount of runoff from the glaciers monitored. It is interesting to note that the amount the glaciers melt varies by as much as 50% from year to year. Further, the glaciers provide a greater amount of water during years when snowpack is minimal. Thus, glaciers buffer streams, lakes and wetlands from annual variations in winter snow accumulation. |
| |
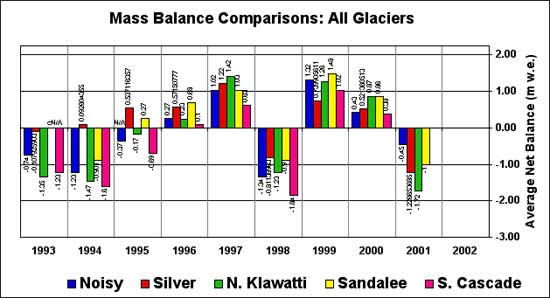
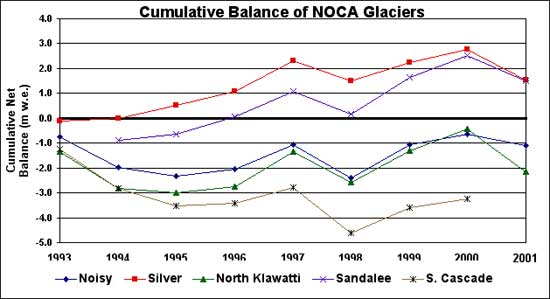
| Mass Balance Summary Chart |
This chart is a summary of the mass balance data for all four glaciers and South Cascade Glacier for the past six years. The vertical axis is in meters of water equivalent. The first two years (1993-1994) were clearly not good ones for these glaciers, as the net annual mass balances of all five glaciers were negative. Things began to turn around in 1995, when the east-side glaciers had positive years. This was somewhat surprising, since we had anticipated that glaciers on the west slope of the range would be the first to show a positive year because they receive more snowfall. In reality, the east side glaciers receive a more consistent amount of snowfall and are better at conserving it due to their relatively high elevations and the fact that most are well shaded on the north sides of mountains. The year's 1996 and 1997 were positive for all of the glaciers, and may have been the first consecutive years of positive balance since the early 1970s. Therefore, the two-year positive gain is by no means a long-term trend, as was confirmed by the return of negative net annual balances in 1998. Finally, we also have learned from this effort that South Cascade Glacier does not represent all of the glaciers, particularly those on the east-slope. |
| |
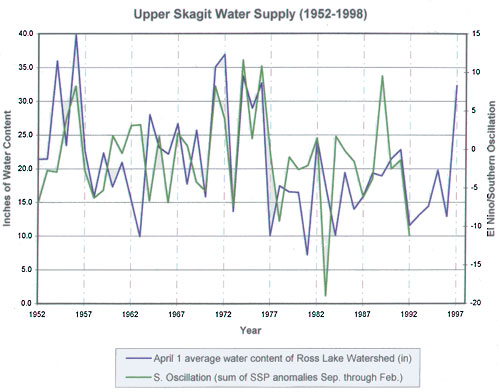
| Water Supply Chart |
The following chart is a comparison of the annual variation in the effect of the Southern Oscillation (El Nino-La Nina) on the winter accumulation of snow in North Cascades National Park for the past 50m years. The vertical axis on the left is the average winter snow accumulation from 20 stations in inches of water. The vertical axis on the right is a measure of the strength of the El Nino and La Nina. |
| |
Examination of this data reveals several important facts. First, during El-Nino years, winter precipitation in the North Cascades is lower than normal. In contrast, years of weak El-Nino or La-Nina conditions usually mean higher than average winter snowfall in the North Cascades. Second, there is a strong one-two year flip-flop in these conditions that results in a year of low precipitation being typically followed by a year of high precipitation. Third, during the past 50 years, this phenomenon seems to swing between two modes or phases. For 15-20 year periods the strength of the Southern Oscillation is weak, and our winter precipitation is generally at or below normal. These periods generally coincide with regional drought, and negative glacier mass balances. Finally, these 15-20 year phases are separated by five-10 year periods when both El-Ninos and La-Ninas are strong. As a result, our winter precipitation during these periods swings between extremes. We are in one of these periods today as witnessed by the high winter snowfalls in 1997 and 1999, which were separated by the dry winter and summer of 1998. Our prediction for 2000 in the North Cascades is below normal winter precipitation.
| SELECTED REFERENCES |
Fountain, A.G. and A.V. Vecchia, 1992. How many ablation stakes are enough?, Poster presented at the fall American Geophysical Union Meeting, San Francisco, California.
Krimmel, R.M., 1993. personal communication, US Geological Survey Ice and Climate Project, Tacoma, Washington.
Meier, M.F., 1961. Mass budget of South Cascade Glacier, 1957-1960,
U.S. Geological Survey Professional Paper 424-B, pp. B206-211.
Meier, M.F. and W.V. Tangborn, 1965, Net budget and flow of South
Cascade Glacier, Washington, Journal of Glaciology, 5, no. 41, pp.
547-566.
Meier, M.F., 1966, Some glaciological interpretations from
remapping programs on South Cascade, Klawatti, and Nisqually glaciers,
Washington, Canadian Journal of Earth Science, 3(6), pp. 811-818.
Meier, M.F., L.R. Mayo, and A.L. Post, 1971. Combined ice and water
balances of Gulkana and Wolverine Glaciers, Alaska, and South Cascade
Glacier, Washington, 1965 and 1966 hydrologic years, U.S. Geological
Survey Professional Paper 715-A, 23 p.
Ostrem, G. and A. Stanley, 1969. Glacier mass balance measurements - a manual for field and office measurements, The Canadian Department of Energy, Mines and Resources, and the Norwegian Water Resources and Electricity Board.
Riedel, J.L., 1987. Chronology of later Holocene Glacier Recession in the Cascade Range, Washington, M.S. Thesis University of Wisconsin-Madison.
Patterson, W.S.B., 1981. The Physics of Glaciers, Pergamon Press, Elmsford, N.Y., 380 p.
Post, A., D. Richardson, W.V. Tangborn, and F.L. Rosselot, 1971. Inventory of Glaciers in North Cascades, Washington, U.S. Geological Survey Professional Paper 705-A.
Tangborn, W.V., R.M. Krimmel, and M.F. Meier, 1971. A comparison of glacier mass balance by glaciological, hydrological, and mapping methods, South Cascade Glacier, Washington, Snow and Ice Symposium, IAHS-AISH Publication no. 104.
Tangborn, W.V., A.G. Fountain, and W.G. Sikonia, 1990. Effect of area distribution with altitude on glacier mass balance - a comparison of North and South Klawatti glaciers, Washington state, Annals of Glaciology, 14, pp. 278-282.