|
NATIONAL PARK SERVICE
Demography of Grizzly Bears in Relation to Hunting and Mining Development in Northwestern Alaska |

|
RESULTS AND DISCUSSION
In 1986 through 1990, we immobilized 146 grizzly bears (78 females and 68 males) on 205 occasions within the NRSA: 67 (43 females and 24 males) were collared. Forty-nine females were captured once, 16 twice, 12 three times, and 1 four times. Of the 68 males, 53 were captured once, 13 twice, and 2 four times.
In 1986, we immobilized 47 bears with phencyclidine hydrochloride or etorphine hydrochloride. Of 27 bears immobilized with phencyclidine in 1986, 1 female died (3.7% mortality), and 1 female of 20 bears (5.0% mortality) immobilized with etorphine died. Exact cause of death was not determined.
During 1987, we tested a combination of tiletamine hydrochloride and zolazepam hydrochloride (Telazol) for immobilizing bears. Telazol had advantages over other drug combinations and was less toxic to humans. Telazol was an excellent drug for immobilizing grizzly bears because of rapid induction times, timely and predictable recovery times, wide margin of safety, and few adverse side effects (Taylor et al. 1989).
We made 158 immobilizations with Telazol using 9-11mg of Telazol per kilogram of body mass. Two concentrations of Telazol were used: 200 mg/mL and 300 mg/mL. The higher concentrations were used on larger adult males to reduce the volume of drug needed for immobilization. Of the 158 immobilizations, one (0.6%) 3.5-year-old emaciated female died. Other details of immobilizations were discussed by Taylor et al. (1989).
Reproduction Parameters
Sex ratios at capture by age class were not significantly different (P > 0.05) from 50:50. Sex ratios of COY through 2.5 years were skewed in favor of males; for bears older than 3.5 years, sex ratios were skewed in favor of females (Table 1). Comparisons with other North American bear populations with sample sizes of more than five (Table 9 in LeFranc et al. 1987) suggest considerable variation in sex ratios by age class, with approximately equal proportions favoring one sex over the other from COY through subadult age classes. For adults, 15 of 21 studies listed sex ratios favoring females similar to this study. We found a complete change in sex ratio between 2.5 and 3.5 years of age (Table 1). The change might be reflective of the small sample size or of a change in mortality of males.
Table 1. Sex rations (%) by age class of grizzly bears (Ursus arctos) immobilized in northwestern Alaska during 1986 and 1990.
| Cubs-of-year |
1.5 years |
2.5 years |
3.5-4.5 years |
>5.5 years | |||||||||||
| Year | n | F | M | n | F | M | n | F | M | n | F | M | n | F | M |
| 1986 | 5 | 60 | 40 | 1 | 0 | 100 | 2 | 0 | 100 | 6 | 67 | 33 | 32 | 53 | 47 |
| 1987 | 5 | 80 | 20 | 7 | 71 | 29 | 15 | 67 | 33 | ||||||
| 1988 | 14 | 50 | 50 | 2 | 50 | 50 | 3 | 67 | 33 | 5 | 80 | 20 | |||
| 1989 | 10 | 0 | 100 | 6 | 50 | 50 | 6 | 50 | 50 | ||||||
| 1990 | 10 | 40 | 60 | 6 | 33 | 67 | 1 | 0 | 100 | 1 | 100 | 0 | 3 | 100 | 0 |
| Totals | 44 | 41 | 59 | 15 | 40 | 60 | 6 | 33 | 67 | 14 | 71 | 29 | 61 | 61 | 39 |
Of 81 adult (>5.5 years) females captured in 1986 through 1990, 36 (44%) were not accompanied by young at the time of capture. Twenty-four of the 36 (67%) were lactating at the time of capture, suggesting they had given birth to COY but had lost them just before den emergence or between emergence and time of capture. Also, of 29 females diagnosed as in estrus at the time of capture, only 11 (38%) were observed with COY the following spring. High cub mortality early in life has been observed in several other Alaska studies; predation by adult males is suspected as the major cause of death (Reynolds and Hechtel 1984; Miller 1985).
Although we did not observe bears breeding, our observations of breeding pairs and the occurrence of estrous females during capture operations seem to indicate that the breeding season was from mid-May through early July. These dates coincide with those reported in other grizzly bear studies in North America (LeFranc et al. 1987) except for the Northern Continental Divide Ecosystem (Aune and Stivers 1983, 1985; Aune et al. 1984, 1986) and Glacier National Park (Mundy and Flook 1973), where breeding apparently begins in late April and runs through mid-June.
Mean size of 35 litters at den emergence in 1986 through 1990 was 2.17 (Table 2). There were no significant differences in numbers of COY per litter among years (F = 1.28, df = 3, P = 0.30), but there were differences in proportions of females producing COY (x2 ± 10.1, P < 0.05) among different years. There seemed to be proportionately fewer litters than expected in 1986, 1987, and 1988 and more than expected in 1989 and 1990. We can not explain these differences. The largest observed initial litter size was four. By the time of den entrance, average litter size had declined to 2.06, reflecting mortality of COY from predation by adult males. Litter size continued to decline, to 1.93 per litter on den emergence as yearlings, then to 1.88 at den entrance. Losses observed after emergence as 2.5-year-olds were considered to be the result of weaning rather than death.
Table 2. Summary of litter sizes and subsequent losses of offspring for radio collared adult (≥3 years) female grizzly bears (Ursus arctos) captured in northwestern Alaska during 1986 through 1990.
| Cub-of-year |
Yearling |
2-5 years | ||||
| EMa | ENTb | EMa | ENTb | EMa | ENTb | |
| Mean | 2.17 | 2.06c | 1.93 | 1.88 | 1.76 | 1.75 |
| SDd | 0.71 | 0.68 | 0.72 | 0.67 | 0.75 | 0.96 |
| n | 35 | 31 | 28 | 25 | 17 | 4 |
a Size of litter at emergence from den in spring. b Size of litter at den entrance in fall. c Excluding two capture-related deaths;  = 2.10, SD = 0.66, n = 30. = 2.10, SD = 0.66, n = 30.d Standard deviation. | ||||||
Bunnell and Tait (1981) and Stringham (1984) determined that litter size was negatively correlated with latitude. They attributed the lower litter sizes at higher altitudes to reduced primary productivity and harsher winter conditions. Litter sizes also were larger among coastal populations than interior populations, presumably due to higher food availability (salmon and marine mammal carrion). Our reported litter size of 2.17 was relatively high in relation to other bear populations in North America and high, particularly, for an arctic population. The abundance of marine mammal carrion and salmon no doubt account for the difference.
We examined initial productivity by age class of female grizzly bears at first sighting after den emergence (Table 3). We used the following assumptions for this analysis: females emerging from den sites with COY, but subsequently losing them, were not eligible to breed that year, while those emerging with 2.5-year-olds were eligible to breed. Using numbers at den emergence underestimates productivity because it does not account for COY that died inside the den or for those that were lost between den emergence and first observation of the female. It also does not consider individual differences in productivity among bears. No females aged 2.5-4.5 (n = 11 bear-years) or 18.5 years or older (n = 3 bear-years) were observed with COY. Excluding the latter groups, of 77 bear-years when females could have produced COY, 57% were observed without COY. Of those that produced COY (n = 33 bear-years), 12, 58, 27, and 3% had 1, 2, 3, or 4 COY, respectively.
Table 3. Observed production of cubs-of-year (COY) by female age class at den emergence in northwestern Alaska during 1986 through 1990.
| Number of COY produced | |||||
| Age class | 0 | 1 | 2 | 3 | 4 |
| 2.5 | 1 | ||||
| 3.5 | 6 | ||||
| 4.5 | 4 | ||||
| 5.5 | 3 | 3 | |||
| 6.5 | 4 | 1 | |||
| 7.5 | 5 | 1 | 1 | ||
| 8.5 | 6 | 3 | 1 | ||
| 9.5 | 6 | 1 | 1 | ||
| 10.5 | 3 | 1 | 2 | 2 | |
| 11.5 | 2 | 1 | 1 | ||
| 12.5 | 2 | 1 | 2 | ||
| 13.5 | 4 | l | l | ||
| 14.5 | 4 | 2 | |||
| 15.5 | 2 | 2 | 1 | ||
| 16.5 | 2 | 2 | 1 | ||
| 17.5 | 1 | 1 | |||
| 18.5 | 1 | ||||
| 19.5 | 1 | ||||
| 20.5 | 1 | ||||
| Totals | 58 | 4 | 19 | 9 | l |
| Percent | 63.7 | 4.4 | 20.9 | 9.9 | 1.1 |
Minimum age of first reproduction averaged 6.1 years (n = 10; range = 5-9 years). Fifty percent of the first litters occurred at 5 years (Females 001, 055, 058, 067, and 070), 20% at 6 years (Females 004 and 053), and 10% each at 7, 8, and 9 years (Females 020, 041, and 002, respectively). Reported minimum age of reproduction for other North American bear populations ranged from 4.5 years on Kodiak island, Alaska, to 9.6 years in the eastern Brooks Mountain Range, Alaska (Table 4). Although Noatak grizzly bears fell within the midrange of reported values, they seemed to reproduce earlier than other arctic populations, which may be related to the relatively abundant food resources.
Table 4. Reproduction characteristics of North American brown bear (Ursus arctos) population.a
| Area | Mean litter size (n) |
Mean age first parturition (n) |
Breeding interval (n) |
Source |
| Yellowstone National Park | 2.24 (68) | 5.6 (16) | 4.3 (68) | Craighead and Mitchell 1982 |
| 1.90(104) | 6.2(12) | 3.0 (33) | Knight et al. 1985 | |
| Rocky Mountain Front (U.S.) | 2.23 (3) | 5.5 (2) | Aune 1985, Aune et al. 1986 | |
| North Fork Flathead River, Montana | 2.50 (8) | 3.4 (5) | McLellan 1984 | |
| Jasper National Park, Alberta | 2.0(3) | Russell et al. 1979 | ||
| Glacier National Park, B.C. | 2.0 (143) | 2-3, some 4 | Mundy and Flook 1970, 1973 | |
| Kluane National Park, Yukon | 1.70(11) | 7.8 (6) | 3+ | Pearson 1975 |
| MacKenzie Mountains, Northwest Territories | 1.83 (6) | 3.8(11) | Miller et al. 1982 | |
| Northern Yukon Territory | 2.0 | 3-4 (4) | Nagy et al. 1983a | |
| Richards Idaho, Northwest Territories | 2.3 (28) | 6.4 (20) | 3.3 (8) | Nagy et al. 1983b |
| This study | 2.17 (35) | 5.1 (10) | 3.3 (10) | This study |
| East Brooks Range, Alaska | 1.78 (13) | 9.6(19) | 4.2 | Reynolds 1976, Reynolds and Hetchel 1980 |
| Eastern Brooks, Canning River, Alaska | 1.6 (69) | Quimby 1974 | ||
| Western Brooks Range, Alaska | 2.03 (23) | 8.4 (11) | 4.0 | Reynolds and Hetchel 1980 |
| Northern Alaska Range, Alaska | 2.07 (30) | Reynolds 1990 | ||
| Denali National Park, Alaska | 1.85 (68) | Murie 1981 | ||
| Susitna River, Alaska | 2.1 (38) | 5.5 (18) | Miller 1987 | |
| McNeil River, Alaska | 2.5 (41) | 6.0 (8) | 3.6 (12) | Glenn et al. 1976 |
| 2.13 (24) | Lentfer 1966 | |||
| Black Lake, Alaska Peninsula | 2.3 (200) | 5.2 | 3 | Glenn 1973 |
| Kodiak National Wildlife Refuge, Alaska | 2.21 (14) | Barnes 1985 | ||
| 2.23 (98) | 4.0-5.0 | 3 | Troyer and Hensel 1969 | |
| Admiralty and Chichagof islands, Southeast Alaska | 1.84 (19) | 8.1 (57) | 3.9 | Schoen and Beier 1990 |
| Admiralty, Baranof, and Chichagof islands, Southeast Alaska | 2.2 (79) | Klein 1958 | ||
aModified from LeFranc et al. 1987. | ||||
Seventy-seven percent (n = 24) of the young were successfully weaned as 2.5-year-olds, and 23% were weaned as 3.5-year-olds. In the north-central Alaska Range, Reynolds (1990) reported similar weaning ages: 62% of the offspring were weaned as 2-year-olds and the remainder as 3-year-olds. In south-central Alaska, Miller (1987) reported that weaning occurred at 2.5 years.
Known minimum interval among COY litters, regardless if COY survived and were weaned, averaged 3.3 years; four litters had 3-year intervals and two had 4-year intervals. Reported breeding intervals in North America ranged from 2.0 to 4.3 years. Similar to other reproduction parameters, Noatak grizzly bears had a relatively shorter breeding interval in relation to other arctic populations. Although the latter statistic may be interesting and is most often reported in the literature, it can be misleading because it may include losses of complete litters, which would cause us to underestimate the interval needed to calculate growth rates (Miller 1987). It is more biologically meaningful to report the interval between successful recruitments into the population, because it includes periods when females may have bred but did not successfully raise young. This latter method of calculation corresponds to the definition of reproduction cycle or interval proposed by Miller (1987) and Reynolds (1990). Ideally, the method would include only periods between successful weanings of litters, but this would require large amounts of data that are rarely available to biologists. Consequently, we also included incomplete histories in our calculations, as did Miller (1987) and Reynolds (1990). For example, if we established radio contact with a female that had COY at capture, we assumed she had weaned 2.5-year-old cubs the previous year. This latter estimate still underestimates the true reproduction interval because minimum values are used. The average minimum reproduction interval between successful weanings was 3.92 years (range = 3-8 years; Table 5). Reynolds (1990) reported a mean reproduction interval of 4.4 years for the north-central Alaska Range, whereas Miller (1987) reported an interval of 3.8 years (range = 4-7 years) for south-central Alaska.
Table 5. Minimum intervals between successful weaning of 2.5-year-old
young by radio-collared adult female grizzly bears (Ursus arctos)
in northwestern Alaska during 1985 through 1994.

(click on image for a PDF version)
Morphometrics
Males were heavier than females for all age classes (Table 6). Weight of females seemed to level off at about 12 years of age, whereas males had increasing weights through 15 years of age (i.e., oldest male examined). Unfortunately, the scales used in this project could only weigh bears up to 227 kg. No females exceeded 227 kg in weight, but four males exceeded 227 kg. We estimated the maximum weight of bears in the Noatak area to be about 275 kg.
Table 6. Weights (kg) of grizzly bears (Ursus arctos) by sex
and age class captured in northwestern Alaska during 1986 through
1990.

(click on image for a PDF version)
LeFranc et al. (1987:14) presented weights of grizzly bears from across North America, but the studies could not be compared because of differences in season of capture and small sample sizes. Bunnell and Tait (1981) reported that bears from coastal populations weighed more than those from interior populations. We expected Noatak bears to weigh more than those from interior arctic areas, and the comparisons provided by LeFranc et al. (1987) generally support that trend.
We estimated each bear's age by size, tooth wear, and general appearance. This practice allowed us to compare our estimates against those provided by cementum analysis. We also took a number of tooth measurements that we hoped might provide some objective criteria for estimating ages. Our subjective estimates of age were correlated with cementum ages (Figs. 5 and 6), but there was a large amount of error associated with those estimates. We accurately estimated the age of 13% of the females and 23% of the males. The age of COY, yearlings, and 2.5-year-olds were accurately estimated, but ages of older bears were underestimated by up to 5 years or overestimated by up to 7 years. Excluding bears whose ages were accurately estimated, the ages of 72% of the females and 85% of the males at least 2.5 years old were overestimated. Our analysis indicated that subjective age estimates must be used cautiously because they may be highly inaccurate beyond the COY through 2.5-year-old classes.

|
| Fig. 5. Relations between ages estimated from tooth wear and replacement versus those obtained from counts of cementum annuli of female grizzly bears captured in the Noatak River study area during 1986 through 1990. |

|
| Fig. 6. Relations between ages estimated from tooth wear and replacement versus those obtained from counts of cementum annuli of male grizzly bears captured in the Noatak River study area during 1986 through 1990. |
While this study was being conducted, concerns were raised that local subsistence hunters in northwestern Alaska do not salvage skulls or hides because this practice purportedly conflicts with their culture and tradition (Loon and Georgette 1989). Currently, state regulations require all successful bear hunters to present the hide and skull to a Department official for placement of a seal on each. At that time, a premolar tooth is extracted for age determination, the skull is measured, and other biological specimens are collected. When subsistence users do not retrieve the skull and hide, they are in violation of those regulations and, more importantly, biologists fail to receive information needed to manage a bear population. As a result, there has been discussion concerning advantages and disadvantages of abolishing sealing requirements for subsistence users. If the sealing requirement were to be voided, biologists might obtain more accurate data on total harvest, but they would lose data on sex and age structure of the harvest (see Assessment of Population Status and Effects of Harvest for more detailed discussion). Because of this discussion, we examined the relations between age and a number of physical measurements to determine if some other types of measurements could be taken by hunters in the field that might collectively provide an indication of sex and age structure. The need for subsistence hunters to retrieve hides and skulls could be replaced by measurements if the relations proved useful.
We examined relations between age and skull width, skull length, length plus width of skull, neck circumference, heart girth, and body length by sex (Tables 7 and 8). We also examined relations between weight and neck circumference, heart girth, and body length (Tables 7 and 8). Although all of these comparisons were significantly correlated with age (P < 0.05), all had significant overlap among age classes so that only COY and yearlings could be reliably identified. Separation by age class seemed more pronounced for males than females, but it is not enough to allow reliable identification of ages. We concluded that there are no simple measurements that hunters could take in the field that would substitute for the cementum age data obtained from the tooth extraction during sealing. Other investigators have detected similar correlations among the variables we measured (LeFranc et al. 1987). For example, strong correlations have been reported between weight and heart girths for bears from several geographic areas (Russell et al. 1979; Glenn 1980; Blanchard 1987). Similar to our results, however, none of these correlations allowed accurate estimation of sex or age.
Table 7. Summary of morphometric measurements (mm) of male grizzly
bears (Ursus arctos) by age class in northwestern Alaska,
1986-1990.
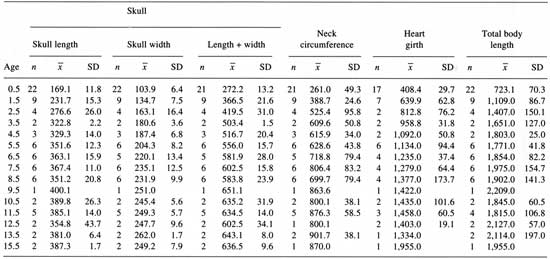
(click on image for a PDF version)
Table 8. Summary of morphometric measurements (mm) of female grizzly
bears (Ursus arctos) by age class in northwestern Alaska,
1986-1990.
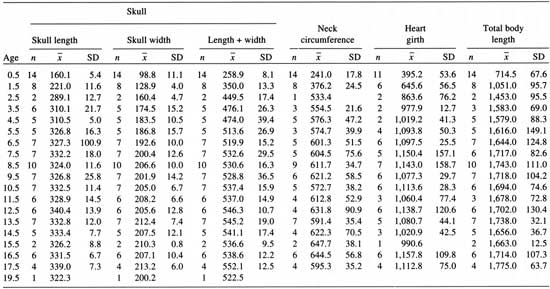
(click on image for a PDF version)
Movements and Habitat Use
During 1986 through 1990, we obtained 1,625
relocations on 67 (43 females, 24 males) radio-collared grizzly bears.
Mean relocations per season for adult females varied from 14.3 in 1987
to 5.3 in 1990 ( = 9.0).
Relocations of each adult male averaged from 6.5 to 11.6 occasions
annually (
 = 8.8).
We removed radio collars from the adult males in 1988 to prevent
lacerations caused by growth.
Grizzly bears emerged from relatively high elevation den sites during April and May. Adult males emerged before adult females, whereas females with COY were the last to emerge. Bears used progressively lower elevations throughout summer; the lowest elevations were used in early to late September (Fig. 7). The use of low elevations in fall seemed to be related to the appearance of chum salmon, which concentrate in the Noatak River downstream of the Kelly River (DeCicco 1983). Other investigators have also attributed attitudinal movements, similar to those described in this study, to tracking of vegetation changes and use of spawning salmon (Martinka 1971; Mundy and Flook 1973; Valkenburg 1976; Schoen and Beier 1990). After mid-September, bears gradually began moving to higher elevations in preparation for denning. Den entry occurred between mid-October and late November.

|
| Fig. 7. Average elevations occupied by grizzly bears at 2-week intervals by sex and family class in the Noatak River study area during 1986 through 1990. |
There were no significant differences (P > 0.05) at 2-week intervals in average elevation use by sex or family class (Table 9). Females accompanied by COY, however, seemed to occupy higher elevations than males throughout spring and summer until early to mid-September (Fig. 7). During each year through mid-June, COY-accompanied females seemed to occupy higher elevations than single females or those accompanied by yearlings. These differences may be related to females with COY avoiding habitats frequented by adult males that may prey on the young. Similar patterns of habitat segregation have been observed in other populations and attributed to the need for security for females with young (Pearson 1975; Gebhard 1982). Predation on cubs by adult males has been documented (Troyer and Hensel 1962; Ballard et al. 1982; Schoen and Beier 1990).
Table 9. Mean elevational (m) use by grizzly bears (Ursus arctos)
by sex and family class in northwestern Alaska during 1986 through 1990.
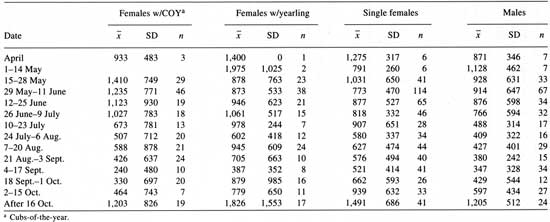
(click on image for a PDF version)
Several distinct movement patterns were discernible from examination of movements of radio-collared bears during 1986 through 1990 (Figs. 8-18). Some bears traveled to denning areas that were distinct from other areas of concentrated activity. At least three adult females (012, 052, and 059) denned in the vicinity of Amphitheater Mountain each year. After den emergence, they moved to the North Slope and remained there through summer and fall. These were the only radio-collared bears that spent any appreciable time there. Other bears denned within areas frequented throughout their active period.

|
| Fig. 8. Relocations of female grizzly bear 014 from 3 June 1986 through 20 September 1990 in northwestern Alaska using conventional radiotelemetry. |

|
| Fig. 9. Relocations of female grizzly bear 022 from 4 June 1986 through 24 May 1990 in northwestern Alaska using conventional radiotelemetry. |

|
| Fig. 10. Relocations of female grizzly bear 028 from 4 June 1986 through 20 September 1990 in northwestern Alaska using conventional radiotelemetry. |

|
| Fig. 11. Relocations of male grizzly bear 034 from 7 June 1986 through 5 June 1988 in northwestern Alaska using conventional radiotelemetry. |

|
| Fig. 12. Relocations of female grizzly bear 043 from 8 June 1986 through 26 May 1990 in northwestern Alaska using conventional radiotelemetry. |

|
| Fig. 13. Relocations of female grizzly bear 053 from 29 May 1987 through 27 September 1990 in northwestern Alaska using conventional radiotelemetry. |

|
| Fig. 14. Relocations of female grizzly bear 056 from 29 May 1987 through 29 May 1989 in northwestern Alaska using conventional radiotelemetry. |

|
| Fig. 15. Relocations of female grizzly bear 058 from 30 May 1987 through 13 November 1989 in northwestern Alaska using conventional radiotelemetry. |

|
| Fig. 16. Relocations of female grizzly bear 063 from 30 May 1987 through 13 June 1989 in northwestern Alaska using conventional radiotelemetry. |

|
| Fig. 17. Relocations of female grizzly bear 069 from 2 June 1987 through 20 September 1990 in northwestern Alaska using conventional radiotelemetry. |

|
| Fig. 18. Relocations of female grizzly bear 070 from 2 June 1987 through 26 June 1990 in northwestern Alaska using conventional radiotelemetry. |
Eleven radio-collared bears had home ranges that included or came within several kilometers of the Chukchi Sea. At least two bears traveled to the coast from as far as the upper Avan River (128 km) and Wrench Creek (96 km). We observed both collared and uncollared bears along the coastline of the Chukchi Sea during late May through August. We suspected the late-spring use of coastline habitats was related to scavenging the numerous marine mammal carcasses that wash up each year. Movements to the coast during mid- to late summer coincided with the appearance of fish at the lower stretches of major creeks and rivers. Several bears made distinct movements to sloughs that contained spawning salmon, the most noticeable of which were along the lower Eli River and along the Noatak River near its confluence with both the Kelly River and Kuchak Creek.
At least 13 radio-collared bears had home ranges that included the Red Dog Mine site (Figs. 8-18). Several others had home ranges adjacent to the mine site. We did not detect any apparent changes in movement patterns using conventional telemetry methods that were related to mine development. Large-scale development of the camp did not begin until 1987, actual development of the mine did not begin until 1989, and full-scale production did not begin until 1990. Even though production did not begin until 1990, the relatively low intensity of monitoring that occurred during much of the study might not have been sufficient to detect anything less than drastic changes in movement patterns resulting from mining development. In 1988, however, we detected (see Satellite Radiotelemetry) movements of three bears to a temporary garbage dump adjacent to the camp airport.
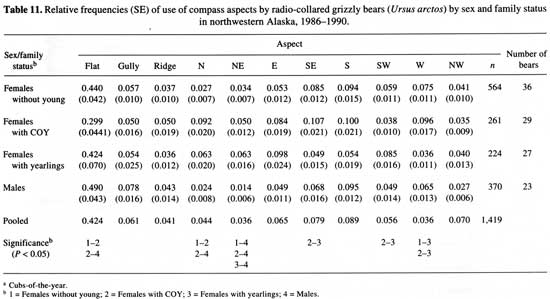
There were significant differences (P < 0.05) in use of slopes, aspects, and habitat types by sex and family class. Females with COY were observed using steep and flat slopes proportionately less and moderate and riverbank slopes and northern aspects more (P < 0.05) than males and single females (Tables 10 and 11). This coincided with the differences in elevational use and may be related to avoidance of adult males. There were no significant differences in use of slopes or aspects between single adult females and males except that females used northeast-facing slopes proportionately more than males (Table 11). Females with COY used steep slopes and southwest-facing aspects less than females with yearlings but also used southeast and western aspects more than the latter group.
Table 10. Relative frequencies (SE) of occurrence of use of slopes
by radio-collared grizzly bears (Ursus arctos) by sex and
family status in northwestern Alaska, 1986-1990.
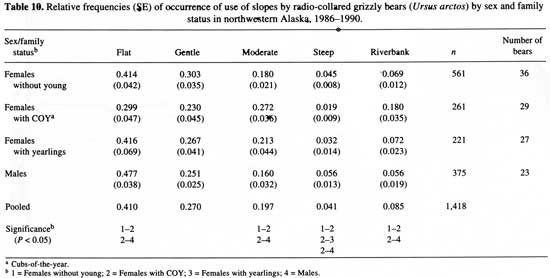
(click on image for a PDF version)
Table 11. Relative frequencies (SE) of compass aspects by radio-collared
grizzly bears (Ursus arctos) by sex and family status in
northwestern Alaska, 1986-1990.
(click on image for a PDF version)
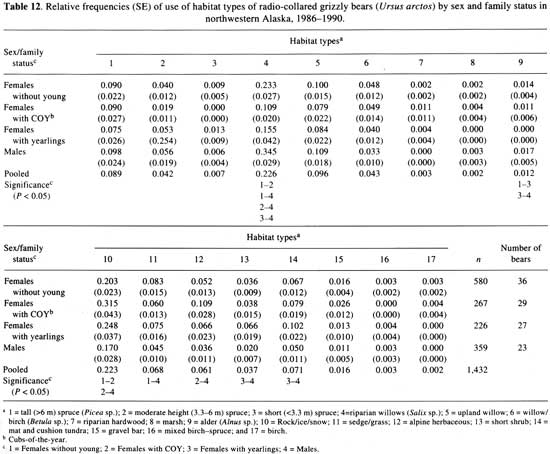
Use of vegetation types mimicked the pattern of usage of elevations and slopes. Females with COY used riparian habitats less and rock—snow and alpine herbaceous vegetation types more than males and single females (Table 12). Single females used riparian willow types less than males but used alpine herbaceous types more than males. Females with yearlings also used riparian willow and alder vegetation types less and short shrub and mat-cushion tundra vegetation types more than adult males.
Table 12. Relative frequencies (SE) of use of radio-collared grizzly
bears (Ursus arctos) by sex and family status in northwestern
Alaska, 1986-1990.
(click on image for a PDF version)
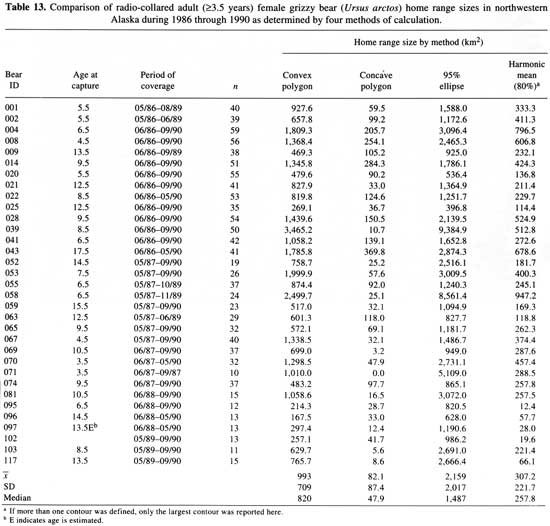
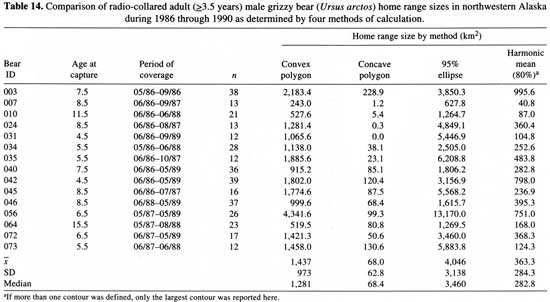
We determined home range sizes of radio-collared
bears by four commonly used methods: minimum convex polygon, concave
polygon, 95% ellipse, and harmonic mean transformation (Tables 13 and
14). Males had larger home ranges than females by three of four methods
of calculation, but only the differences for convex polygon (W = 722,
P = 0.028) and 95% ellipse (W = 686, P = 0.003) were
significant. Male convex polygons averaged 1,437 km2 (range =
243-4,341 km2); females averaged 993 km2 (range
= 167-3,465 km2). Noatak grizzly bear
home range sizes are among the largest reported in the literature
(LeFranc et al. 1987: Tables 5 and 6). Only adult males from the
Yellowstone area ( = 1,970 km2; range = 754-3,238
km2: Knight et al. 1984) and south-central Alaska (
 = 1,941 km2; range = 88-5,923 km2; Miller
1987) exceeded the average sizes reported for the Noatak area. Perhaps
equally important, Noatak grizzly bear home ranges were 1.6 to 8 times
larger than those reported for other arctic populations. Both food and
climate are thought to influence grizzly bear home range sizes (Mace and
Jonkel 1980; Sizemore 1980; Knight et al. 1984; Picton et al. 1986;
Miller 1987). Although located in the arctic, the climate in the Noatak area is
more moderate than that found in interior arctic areas. Also,
availability of food (especially salmon, marine mammals, and caribou) is
greater than in interior areas. We would have expected, based on those
criteria, that Noatak home range sizes would be smaller than those from interior
areas. Smallest reported average home range size was 14 km2
(range = 9-20 km2; n = 6) for adult females
from Karluk Lake on Kodiak Island, Alaska (Berns et al. 1980).
Table 13. Comparison of radio-collared adult (≥3.5 years) female
grizzly bear (Ursus arctos) home range sizes in northwestern
Alaska during 1986 through 1990 as determined by four methods of
calculation.
(click on image for a PDF version)
Table 14. Comparison of radio-collared adult (≥3.5 years) male grizzly
bear (Ursus arctos) home range sizes in northwestern Alaska during
1986 through 1990 as determined by four methods of calculation.
(click on image for a PDF version)
We observed 30 radio-collared bears feeding on 38 ungulate carcasses (17 moose, 9 caribou, 12 unidentified) during this study. Several of the carcasses were relatively old and probably represented scavenging, particularly those that were observed just after den emergence. At least 6 of the 17 moose carcasses were neonate moose that had been killed by bears. In an adjacent study area, Reynolds and Garner (1987) reported that grizzly bears stayed within their established home ranges and utilized caribou as they migrated through individual bear home ranges. Miller (1987) made a similar observation in south-central Alaska. We observed a similar pattern in the Noatak area. Caribou and moose seemed to be utilized on an opportunistic basis. Grizzly bears commonly prey on moose in other areas of Alaska and Canada (Ballard et al. 1981; Boertje et al. 1988; Larsen et al. 1989; Ballard et al. 1990c). We suspect that neonate and adult caribou and moose are important sources of protein for Noatak bears between den emergence and spring greenup.
Den Site Characteristics
Using fixed-wing aircraft, we documented den site characteristics for 86 den sites located by tracking 43 radio-collared bears (32 females, 11 males) during 1986-90. Numbers of consecutive den sites located for each bear ranged from one to four. Den sites were found on moderately (>30°) inclined slopes at an average elevation of 500 m (SD = 139.4, median = 457 m). Seventy-two percent of the dens had orientations between 90 and 270° All dens were excavated by bears. No reuse was observed in successive years because nearly all, if not all, dens collapsed. Although monitoring intensity was not sufficient to precisely document entrance dates, bears (both sexes) usually entered dens between 15 and 30 October each year (n = 71). Earliest den entrance occurred in 1986 when five bears entered dens between 2 and 4 October. Latest den entry (n = 8 bears) occurred between 15 and 29 November each year. Six of eight bears still active after 15 November were associated with open water along rivers that contained spawning salmon. In these instances, accessible food seemed to be more important in the timing of den entry than snow cover, temperature, or amount of daylight. Dates of entry and exit reported in this study are similar to entrance and emergence dates for populations located in the Brooks Range (Curatolo and Moore 1975; Reynolds 1978) and the North Slope (Garner et al. 1984).
First observations of radio-collared bears emerging from dens occurred between 15 April and 2 May (n = 18). Several uncollared adult males were observed outside their den sites as early as 18 March. Most bears were first observed away from dens between 19 May and 1 June (n = 64). This later category included 15 bears that were still in their dens as late as 29 April. The latest dates bears were first documented emerging from dens were between 18 and 21 May (n = 5). All were females accompanied by COY. Of 19 observations of early-emerging bears, 7 were males, 10 were barren females, and 2 had offspring (1 yearling and 1 2.5-year-old). Males emerged from dens earlier than females, especially females accompanied by COY.
We determined den site fidelity by comparing straight-line distances between dens used in consecutive years (n = 69) and in nonconsecutive years (n = 69) for 31 bears. Mean distance between consecutive den sites was 4.4 km (SD = 6.2), and mean distance between all den sites (n = 138) was 5.1 km (SD = 6.4), suggesting strong fidelity to the same area each year. These findings are consistent with those reported in other Alaskan studies (Valkenburg 1976; Reynolds 1978).
Only five bears (004, 028, 042, 070, and 098) had distances greater than 20 km between annual den sites. Bear 070 moved 20.9 km from her 1987 den site in Wrench Creek drainage to a den site within 6 km of the Red Dog Mine in 1988, then continued to den in locations nearby. The shift may have been due to attraction to the temporary garbage dump at the mine—three bears equipped with satellite transmitters (see Satellite Telemetry) did move to the dump site. Bear 028 maintained a high fidelity to her den sites, located 12 km northwest of the mine from 1986 through 1989 and then in 1990 moved 25km south to a den located 20km southwest of the mine. The 1990 den site was located near a fishing site along the Noatak River that had been used by 028 each fall. In 1988, bear 004 selected a den site 25.1 km south of sites used in 1986 and 1987 and then returned to within 7.0 km of those sites in 1990. In 1989, bear 098 denned 36.8 km away from her 1988 site; both sites were in the Kelly River drainage.
The area surrounding the mine site contains important denning habitat for bears, mostly due to its topography and its location to important food resources. Changes in den site selection and denning activity may be indicators of response by grizzly bears to industrial development. Future development plans involve increased activity in road construction, gravel extraction, and additional development in areas where a large percentage of the study area bears denned. Continued monitoring of radio-collared bears is necessary to determine if den site usage is affected by mine development.
Satellite Radiotelemetry
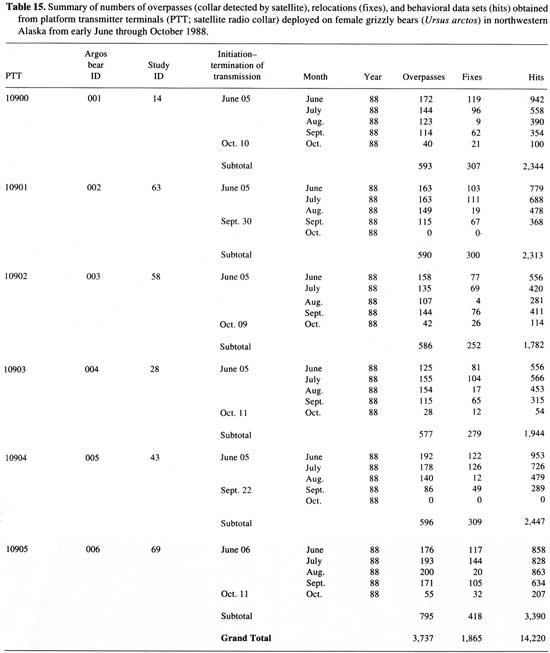
Platform transmitter terminals transmitted daily as programmed from their deployment on 5 June (n = 5) and 6 June (n = 1) 1988 until early October 1988 (Table 15). During 1988, the six PTT's provided 1,865 relocations and 14,220 messages containing temperature and activity data. Each PTT provided an average of 0.5 relocations and 3.8 messages for each overpass—at least one message was received by the satellite during each overpass (Table 16).
Table 15. Summary of numbers of overpasses (collar detected by
satellite), relocations (fixes), and behavorial data sets (hits)
obtained from platform transmitter terminals (PTT; satellite
radio collar) deployed on female grizzly bears (Ursus arctos)
in northwestern Alaska from early June through October 1988.
(click on image for a PDF version)
Table 16. Description of location quality indices used with locations obtained from PTT's with regular, nonguaranteed, and special animal processing by Service Argos.
| LQa Index | Description |
| 3 | Equivalent to NQ = 3. Five messages received used in calculation of position in 420 s. Internal consistency >0.15 Hz, satellite must achieve a maximum elevation between 22 and 550 above horizon relative to PTT. Location reportedly accurate within 150 m on 68% of occasions. |
| 2 | Equivalent to NQ = 2. At least 5 messages must be received and used in calculation position in 420 s. The satellite must achieve maximum elevation of 17=780 above horizon relative to PTT. Location reportedly accurate within 350 m on 68% of occasions. |
| 1 | Equivalent to NQ = 1. At least 5 messages must be received in 240 s or 4 messages in 420 s. Provides a nonguaranteed location but not necessarily of low quality. |
| 0 | ≥4 messages but a pass duration less than 240 s. |
| 0 | Doppler point of inflection does not belong to the pass or mid term oscillator drift is high. |
| 0 | 3 messages. Previous location <12 h old. |
| 0 | 3 messages. Previous location <12 h old. |
| 0 | 2 messages. Previous location <12 h old. |
| 0 | 2 messages. Previous location >12 h old. |
| aLocation Quality Index. | |
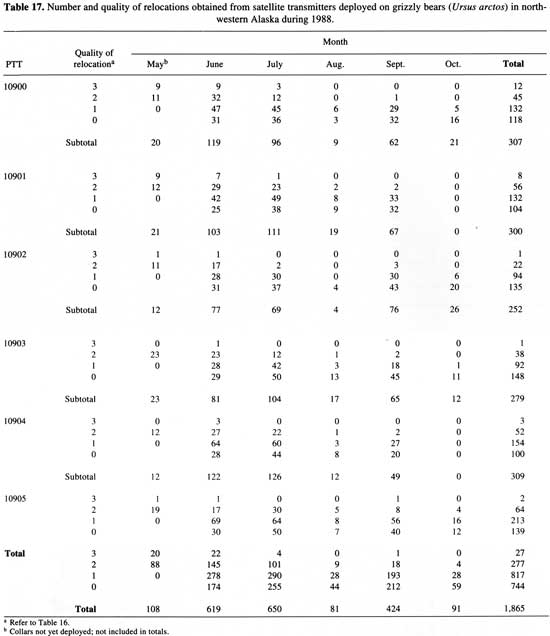
Argos provides a Location Quality index (LQ) with each relocation to indicate the estimated accuracy based on a combination of the number and quality of messages received during the overpass, the stability of the transmitter's oscillator, the geometry of the satellite overpass, and other criteria (Table 16; Fancy et al. 1988; Harris et al. 1990; Keating et al. 1991). Argos's standard processing includes relocations with LQ's ranging from 1 to 3. Harris et al. (1990) reported that the LQ-3 and LQ-2 relocations had 68% of their locations within 150 and 350 m, respectively, of the true value. In addition to standard location processing, Argos provides two other types of processing—nonguaranteed locations (LQ = 1) and special processing that costs an additional $1.25 per PTT per day (LQ = 0)—to wildlife users who are willing to accept some inaccurate location estimates in return for a greater number of location estimates. Approximately 84% of the bear relocations had LQ's of 0 (40%) or 1 (44%; Table 17); LQ-0 relocations were excluded from further analyses because other studies (Harris et al. 1990; Keating et al. 1991) have determined that these relocations are unreliable. Keating et al. (1991) reported errors for LQ-0 relocations ranging from 128 to 396,170 m.
Table 17. Number and quality of relocations obtained from satellite
transmitters deployed on grizzly bears (Ursus arctos) in
northwestern Alaska during 1998.
(click on image for a PDF version)
Between 27 May and 1 June 1988, before deploying the PTT's on bears, we collected data on the accuracy of the six PTT's by placing them at a fixed location in Nome, Alaska. The mean error associated with the 109 fixed relocations for the six PTT's was 1,110 m (median = 940 m; Table 18). This error was considerably greater than that obtained in other wildlife studies (Fancy et al. 1988, 1990; Clark 1990; Harris et al. 1990; Keating et al. 1991). Approximately 60% of the relocations were within 1,200 m of the estimated location, and 90% were within 2,000 m (Fig. 19). All relocations used for the error analysis had LQ's of 2 (73% of locations) or 3 (27%), whereas 73% of the relocations obtained while the PTT's were actually deployed on bears were composed of the lower-quality LQ-1 locations. Deployed transmitters on animals usually provide less accurate relocations than those placed in the open, in part because the animal's body detunes the antenna (S. M. Tomkiewicz, Telonics, Inc.; Mesa, Arizona, personal communication).
Table 18. Location error (m) of six satellite PTT's at sea level
at Nome, Alaska, during Julian days 147 through 152 before deployment
on female grizzly bears (Ursus arctos) in northwestern
Alaska in 1988.

(click on image for a PDF version)

|
| Fig. 19. Average location error (m) expressed as percent of cumulative relocations of six satellite transmitters in Nome, Alaska, for a 1-week period before deployment on grizzly bears in northwestern Alaska in early June 1988. |
Location accuracy varied considerably among the six PTT's. Both Fancy et al. (1988) and Harris et al. (1990) reported similar variation. Mean location error per PTT ranged from 664 m for PTT 10902 to 2,221 m for PTT 10903 (Fig. 20). Sixty percent of the relocations were within 800 to 1,600 m, and 90% were within 1,400 to 4,000 m of the true location. The stability of the oscillator within each transmitter has a major effect on the performance of each PTT.

|
| Fig. 20. Location error of six individual satellite transmitters expressed as percent of cumulative relocations (n = 109) in Nome, Alaska, for a 1-week period before deployment on grizzly bears in the Noatak River study area in early June 1988. |
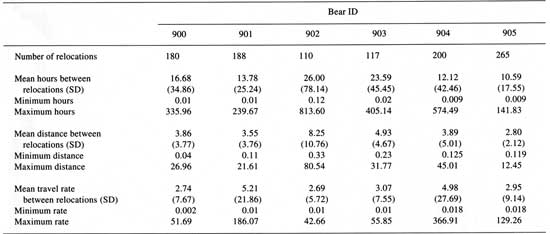
The average time interval between relocations with LQ's of 1-3 ranged from 10.6 to 26.0 h, and the average distance traveled per relocation ranged from 2.8 to 8.3 km (Table 19). Average rates of travel per relocation ranged from 2.7 to 5.2 km/h. Minimum and maximum distances traveled between relocations were 0.04 and 80.5 km. The time between relocations is generally a function of latitude, duty cycle (6 h in our instance), and species. Consequently, the values represented here are probably indicative of what others may expect using a 6-h duty cycle on grizzly bears in an arctic area.
Table 19. Average time, distance (km), and rate of travel (km/h) for
six female grizzly bears (Ursus arctos) as determined by
satellite telemetry during 5 June through mid-October 1988 in
northwestern Alaska.
(click on image for a PDF version)
We calculated the mean distance each bear moved between daily relocations using the highest quality relocation for each day (i.e., highest LQ index). Although this method underestimates actual movements because of the assumption that bears moved in a straight line between successive relocations, it does provide a minimum index of movement distances (Fancy et al. 1989). Movements of the six females were greatest in June, whereas the lowest rates occurred in August (Fig. 21). Movement rates increased in October, just before bears entered dens. Relatively few relocations were obtained for each bear during August, although the number of overpasses in which at least one message was received from the satellite remained high (Table 16). Relatively few relocations were obtained on Kodiak Island brown bears during the same period, because the bears moved into steep canyons to feed on salmon during August (V. Barnes, U.S. Fish and Wildlife Service, Kodiak, Alaska, personal communication). Consequently, the number and quality of messages reaching the satellite were inadequate to determine a location for most overpasses. A similar change in habitat may explain our results. Bears equipped with conventional VHF collars moved to relatively low elevations during August (Fig. 7), which lends support to this hypothesis. Another explanation could be that some problems may have occurred with the Argos system during August. There were, however, no apparent problems in other studies (S. Fancy, unpublished data).

|
| Fig. 21. Mean daily distance between satellite relocations for six transmitter-equipped female grizzly bears, June-October 1988. Movement rates were calculated after selecting the most accurate relocation for each day. |
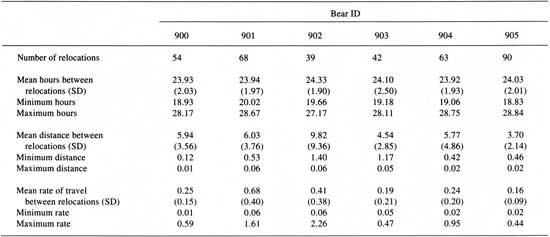
We also determined average movements and rates of movement per day for all of 1988 by using only one (highest quality) relocation per day (Table 20). The interval between daily relocations per adult female bear ranged from 18.8 to 24.3 h. The movement per day ranged from 3.7 to 9.8 km at 0.16 to 0.68 km/h.
Table 20. Distance and time between consecutive daily relocations and
rate of daily travel for six female grizzly bears (Ursus arctos)
equipped with satellite transmitters during 1988 in northwestern Alaska.
(click on image for a PDF version)
The 24-h activity index indicated that bears had peak movement during July and that activity declined thereafter, with lowest activity occurring just before den entrance (Fig. 22). There was no relation (P = 0.89) between distance moved per day and the monthly activity index (Fig. 23). As mentioned earlier, the tip-switch was oriented at —8° to the circuit board. Because no studies had been conducted on grizzly bears, the optimum orientation for the switch was not known. Based on Fig. 23, we suggest the tip switch orientation be moved to 0 or 5° and then tested. Ideally, activity patterns should be studied and results calibrated with captive animals before users should expect reasonably accurate activity indices from this equipment.

|
| Fig. 22. Mean 24-h activity index for five satellite transmitter-collared female grizzly bears in northeastern Alaska, June-October 1988. |

|
| Fig. 23. Relations between movement rates per day and monthly activity indices for six satellite transmitter-collared female grizzly bears in northwestern Alaska, June-October 1988. |
Although we had several reasons for using satellite telemetry during this study, a primary objective was to monitor how bears reacted to construction and operation of the Red Dog Mine. We also used the relocations to evaluate how often some bears may have frequented the garbage dump at the mine site during 1988. During 1987 through 1989, we documented that several species of wildlife, including grizzly bears, were attracted to the Red Dog Mine and port site garbage dumps (Ballard et al. 1990a, 1990b). We assessed the frequency of use of the mine garbage dump by six grizzly bears during 1988, assuming that if a satellite PTT was relocated at or within 3.2 km of the dump site, there was a strong probability that the bear was attracted to the area. Three of six PTT-equipped grizzly bears were relocated at the Red Dog Mine garbage dump on 144 (15%) of 946 relocations during 6 June through 15 October 1988 (Figs. 24-29). One bear visited the dump site regularly throughout summer and fall (73 of 291 relocations); the other two bears visited the area only during June and July. We concluded that several bears were attracted to the dump site. This was confirmed by anonymous informants at the camp, who indicated that several bears were regularly using the area. As a result of this finding, we requested that the permanent dump site be fenced. This request, however, was rejected by the mine owners because no problems with bears had been documented, and the owners stated that once they began incinerating their trash there would be no food available to attract bears and other wildlife.

|
| Fig. 24. Daily satellite relocations of female grizzly bear 014 in the Noatak River study area of northwestern Alaska, 5 June through 10 October 1988. |

|
| Fig. 25. Daily satellite relocations of female grizzly bear 063 in the Noatak River study area of northwestern Alaska, 5 June through 30 September 1988. |

|
| Fig. 26. Daily satellite relocations of female grizzly bear 058 in the Noatak River study area of northwester Alaska, 5 June through 30 September 1988. |

|
| Fig. 27. Daily satellite relocations of female grizzly bear 028 in the Noatak River study area of northwestern Alaska, 5 June through 11 October 1988. |

|
| Fig. 28. Daily satellite relocations of female grizzly bear 043 in the Noatak River study area of northwestern Alaska, 5 June through 22 September 1988. |

|
| Fig. 29. Daily satellite relocations of female grizzly bear 069 in the Noatak River study area of northwestern Alaska, 5 June through 11 October 1988. |
Home range sizes of the six PTT-equipped bears were computed by the same four methods used for conventional telemetry data and compared by date and method of data collection (Tables 21-24). We calculated home range sizes for the entire study period (see Tables 13 and 14) and for relocations obtained only in 1988 using conventional VHF-transmitter data. All estimated home range sizes based on 1988 conventional data (except those based on the 95% ellipse) were significantly smaller (Kruskal—Wallis test; P < 0.05) than those obtained by conventional telemetry over a 3- to 5-year period or by satellite telemetry. This probably occurred because of the relatively small numbers of relocations obtained during 1988.
Table 21. Comparison of home range sizes (convex polygons) for six
female grizzly bears (Ursus arctos) as determined by two
methods of data collection during a 3-5-year period in northwestern
Alaska.
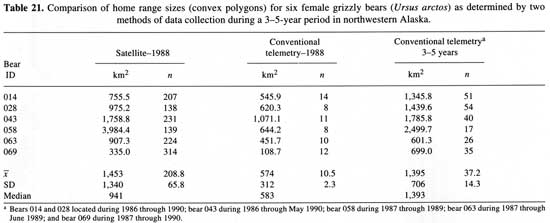
(click on image for a PDF version)
Table 22. Comparison of home range sizes (concave polygons) of six female grizzly bears (Ursus arctos) as determined by two methods of data collection during a 3-5-year period in northwestern Alaska.
| Satellite—1988 | Conventional telemetry—1988 |
Conventional telemetrya 3-5 years | ||||
| Bear ID | km2 | n | km2 | n | km2 | n |
| 014 | 305.9 | 207 | 28.5 | 14 | 284.3 | 51 |
| 028 | 166.7 | 138 | 19.2 | 8 | 150.5 | 54 |
| 043 | 491.6 | 231 | 54.2 | 11 | 369.8 | 40 |
| 058 | 438.2 | 139 | 0.0 | 8 | 25.1 | 17 |
| 063 | 207.7 | 224 | 0.0 | 10 | 118.0 | 26 |
| 069 | 212.4 | 314 | 6.2 | 12 | 3.2 | 35 |
 |
303.7 | 208.8 | 18.0 | 10.5 | 158.5 | 37.2 |
| SD | 134.0 | 65.8 | 21.0 | 2.3 | 144.3 | 14.3 |
| Median | 259.1 | 12.7 | 10.5 | 134.2 | ||
aBears 014 and 028 located during 1986 through 1990; bear 043 during 1986 through May 1990; bear 058 during 1987 through 1989; bear 063 during 1987 through June 1989; and bear 069 during 1987 through 1990. | ||||||
Table 23. Comparison of home range sizes (95% ellipse) of six female grizzly bears (Ursus arctos) as determined by two methods of data collection during a 3-5-year period in northwestern Alaska.
| Satellite—1988 | Conventional telemetry—1988 |
Conventional telemetrya 3-5 years | ||||
| Bear ID | km2 | n | km2 | n | km2 | n |
| 014 | 996.8 | 207 | 1,425.7 | 14 | 1,786.1 | 51 |
| 028 | 1,551.5 | 138 | 4,083.2 | 8 | 2,139.5 | 54 |
| 043 | 2,255.6 | 231 | 4,713.9 | 11 | 2,874.3 | 40 |
| 058 | 9,104.8 | 139 | 4,521.1 | 8 | 8,561.4 | 17 |
| 063 | 983.2 | 224 | 1,915.1 | 10 | 827.7 | 26 |
| 069 | 485.4 | 314 | 429.5 | 12 | 949.0 | 35 |
 |
2,563 | 208.8 | 2,848 | 10.5 | 2,856 | 37.2 |
| SD | 3,261 | 65.8 | 1,819 | 2.3 | 2,897 | 14.3 |
| Median | 1,274 | 2,999 | 1,963 | |||
aBears 014 and 028 located during 1986 through 1990; bear 043 during 1986 through May 1990; bear during 058 1987 through 1989; bear 063 during 1987 through June 1989; and bear 069 during 1987 through 1990. | ||||||
Table 24. Area of home range contours (km2) including 80, 90, and 95% of relocations of satellite transmitter-equipped female grizzly bears (Ursus arctos) as determined by harmonic mean method of calculation in northwestern Alaska during 1988.
| Bear ID | ||||||
| Percent contour | 014 | 063 | 058 | 028 | 043 | 069 |
| 80 | 349.8 | 208.5 | 77.6 | 210.7 | 253.7 | 159.5 |
| 2.1 | 306.6 | 46.6 | 148.3 | |||
| 545.3 | ||||||
| 734.7 | ||||||
| 90 | 467.1 | 480.9 | 107.5 | 342.0 | 378.0 | 218.7 |
| 6.6 | 1,286.1 | 88.4 | 243.0 | |||
| 882.7 | ||||||
| 95 | 735.4 | 2,005.7 | 181.8 | 452.1 | 1,206.9 | 264.1 |
| 4.5 | 2,759.4 | 132.7 | ||||
| 0.6 | ||||||
There were no significant differences (P > 0.05) in average home range sizes for convex polygons, concave polygons, and 95% ellipse between PTT-equipped bears in 1988 and the same bears relocated from fixed-wing aircraft during a 3- to 5-year period. Satellite telemetry in this study provided similar estimates of home range sizes and movement patterns in 1 year that took 3-5 years to estimate with conventional telemetry. Average home range size using convex polygons of adult females equipped with PTT's was 1,453 km2 (SD = 1,340 m); for the same bears using conventional methods, home range size averaged 1,395 km2 (SD = 706 m). The variation among individual bear home range sizes, regardless of method of calculation or data collection, was so large that average home range sizes may have little value for understanding biological relations.
Most PTT's functioned as programmed during the first season of use. One transmitter ceased transmission in fall 1988 on the exact date it was programmed (10 October); three ceased within 1 day of the programmed date, one within 8 days, and one within 10 days (Table 15). The latter two PTT's quit transmitting earlier than expected. During late May of the following year (1989), when the PTT's were programmed to resume transmission, three of six PTT's failed, and no signals were received for the remainder of the year. PTT 902 resumed transmission on 27 May (Julian date [JD] 147) for 1 day and then quit transmitting. PTT 904 failed after providing 1 set of activity data on 22 May 1989. The only PTT that functioned more than 1 day was 905, which resumed transmission on 5 June (JD 156) and apparently transmitted daily through about 30 June 1989 (JD 181) before failing. During late 1988 or late spring of 1989, all PTT's that were deployed on grizzly bears failed prematurely.
High failure rates of PTT's deployed on brown bears have been reported elsewhere in Alaska. Harris et al. (1990) reported that of the 11 PTT's deployed on brown bears in 1987, 8 had been programmed to transmit through the denning season into May and the remaining 3 were programmed to cease transmission while in the den and resume transmission at den emergence the following spring (the latter three were programmed similarly to those used in this study). Of those 11 collars, one bear shed its collar, and 9 of the 10 remaining collars failed. The one remaining functioning collar transmitted for 3 weeks then failed. The three transmitters that were thought to have been programmed similarly to the ones in this study were not programmed properly and did not resume transmission. We wondered if our PTT's may have been incorrectly programmed as well, but the manufacturer indicated that their records showed our PTT's had been programmed properly. It seems that PTT's undergo severe stresses either during denning or immediately after den emergence that result in complete failure of the PTT.
During the past 2 years we have maintained between 30 and 40 conventional VHF transmitters on grizzly bears. Including commute time from Kotzebue to the study area, we were able to locate about two radio-collared bears per hour of flight time in a PA-18 Supercub aircraft. At current commercial charter rates of $135/h, each bear relocation costs about $68, excluding costs of radio collars and personnel. In comparison, including costs of the PTT's ($3,500), data processing for the second season ($9,074), and relocations only with LQ's greater than 1, average cost per relocation was $37. If we had not paid for data processing costs for the second year when there were no data and had not used special processing, the average cost per relocation would have been about $27. Satellite telemetry, on the basis of cost per relocation for this study, was much more cost-effective than conventional telemetry. More importantly, relocations were obtained consistently on a daily basis, regardless of inclement weather that interrupts relocation of conventional units by air. We suggest that if the principal objectives of a project were to estimate home range sizes, movement patterns, and perhaps habitat utilization, then satellite telemetry is far superior to conventional telemetry for use in similar terrain with similar species. The primary limitations would be the number of bears that could be sampled because of the high cost of PTT's. Most studies that use conventional telemetry methods, however, do not obtain enough relocations per season for each animal to confidently measure home range sizes or movement patterns. In this study, the greatest number of relocations obtained for any bear using conventional telemetry was 61, not sufficient for statistical validity for most analyses. The conventional methods were judged necessary for determination of productivity, breeding activity, and den site location. If sample sizes were sufficiently large, the VHF unit on the satellite collar could be used to collect this type of information using conventional telemetry techniques.
Population Estimates and Density
One primary objective was to estimate bear density in an area that included the to-be-developed Red Dog Mine. During 29 May through 4 June 1987, 196.7 h were flown in six fixed-wing aircraft searching for grizzly bears within the 1,862-km2 Red Dog Mine census area (Table 25). Search effort averaged 0.91 min/km2/day. Search effort per count area varied from 0.80 min/km2/day for count area 2 (characterized by relatively flat terrain and low-elevation relief where sightability should have been optimum) to 0.98 min/km2/day for count area 9, a rugged, mountainous area in the north where observability was difficult. The census area had originally included two additional count areas totaling 344.5 km2. but these were eliminated after the first day because they required disproportionate survey effort. On the first day, 40 h 3 min were spent surveying, of which 10 h 33 min were allocated to count areas 11 and 12. With count areas 11 and 12 eliminated, the area of census was reduced to 1,862 km2. On the first day of the survey, 40.1 h of search effort were expended by five aircraft, not including commute time or time spent watching bears to be marked. Six bears were captured and marked the first day within or along the borders of the two count areas that had been eliminated from the census.
Table 25. Survey effort (min/mi2) by count area and day
conducted for a census of grizzly bears (Ursus arctos) from 29
May through 4 June 1987 near Red Dog Mine in southwestern Brooks
Range of northwestern Alaska.
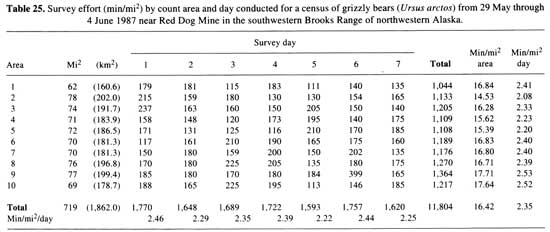
(click on image for a PDF version)
Search efficiency declined with fatigue, and we decided not to extend search effort beyond 4-5 h without several breaks. Average search effort per aircraft was 5.62 h/day, excluding time used for commuting or watching bears during immobilization. Participants indicated that this was close to the maximum effort that should be attempted. We suggest additional aircraft and personnel be used if a larger area needs to be censused.
Before the census, eight female and four male bears that had been captured and radio-collared in 1986 were available as marked bears. The home ranges of these 12 bears overlapped the census area boundaries, and 8 bears denned within the census area boundaries (Figs. 8-18). Female 28 was accompanied by two COY; and female 22 by one 2.5-year-old. Three of the previously marked males and six of the previously marked females were resighted at least once during survey days 2-7. No marked (radio-collared) bears were observed during the first day of the census. Twenty-nine individual radio-collared adult grizzly bears were observed within the census area on one or more occasions while the census was in progress (Table 26).
Table 26. Summary of presence or absence and sightability of individual
radio-collared grizzly bears (Ursus arctos) within the census
study area near Red Dog Mine, Alaska, from 29 May through 4 June 1987.
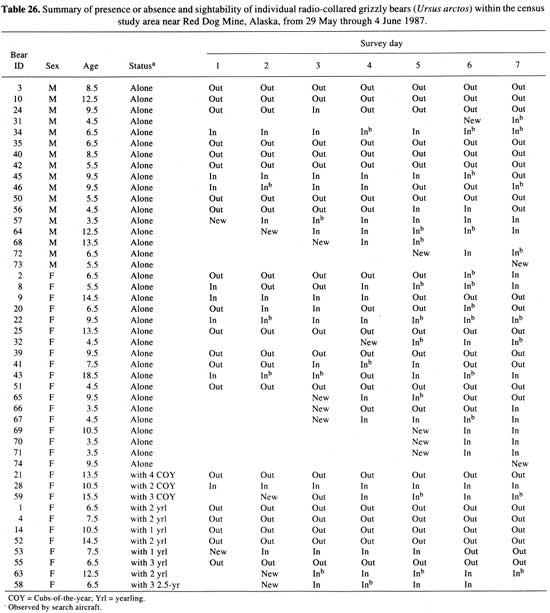
(click on image for a PDF version)
One of the assumptions in mark—resight estimates is that all individuals have an equal chance of being captured (sighted, in our situation). This assumption was probably violated in this study. Several studies reported differences in sightability between females with COY and other age—sex classifications (Spraker et al. 1981; Ballard et al. 1982; Miller and Ballard 1982; Miller et al. 1987). Although we did not statistically test differences in sightability observed among the various sex and age classes because of small sample sizes, there seemed to be a sightability bias against females with COY. Two radio-collared females with COY were within the census area on 11 of 12 possible days but were only observed twice (sightability = times seen divided by times within the area = 18%). The latter was the lowest sightability of the groups examined. Sightability for other groups was as follows: all males, 32.4% (10 individuals, 37 occasions within, 12 occasions seen); all females, 30.6% (19 individuals, 72 occasions within, 22 occasions seen); single females, 34.0% (14 individuals, 47 occasions within, 16 occasions seen); females accompanied by young less than 1 year old, 28.6% (3 individuals, 14 occasions within, 4 occasions seen); and all females except those with COY, 32.8% (17 individuals, 61 occasions within, 20 occasions seen). Sightability for all bears was 31.2% (29 individuals, 109 occasions within, 34 occasions seen).
There may have been some differences in sightability between bears radio-collared before the census versus those captured during the census. Sightability of males was 28.6% before the census versus 36.4% during the census; for single females sightability averaged 40.0% before the census versus 23.5% during the census.
Comparing mark—resight data among four studies (Admiralty Island, Kodiak Island, northwestern Alaska, and south-central Alaska), Becker (1988) indicated there were no significant differences (P > 0.05) in capture sightability of marked bears by family or age class. Becker also tested for capture homogeneity by day and individual, but was unable to detect any differences for the Noatak area (P = 0.316) or among four study areas (P = 0.449) where mark—recapture estimates had been made. The Kodiak Island study area (Unit 8) was significantly different (P = 0.005); reasons for that difference have not yet been established. Overall, there is no basis for rejection of the null hypothesis that sightability is constant among sex, age, or family classes. Data from this study will be combined with several other Alaska studies where mark—recapture techniques have been utilized (S. D. Miller, Alaska Department of Fish and Game, Anchorage, personal communication). With larger sample sizes, the data can be properly tested for statistically significant differences among sex, age, and family groups.
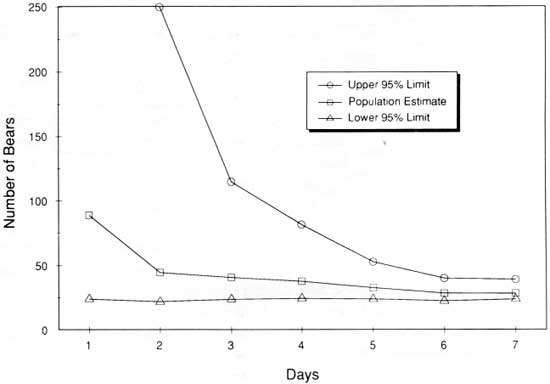
We generated two population estimates based on sex and age class of bears in this study: number of adult bears more than 3 years old and the total number of bears including COY and other offspring. The best estimate was for adult bears more than 3 years old, because it violated fewer assumptions. The adult (>3 years) population estimate within the 1,862-km2 area was 28; the total population estimate was 37. The 80% confidence interval for the adult estimate was 25-35 and 33-43 (Table 27) for the total estimate. Density estimates were 1/66.5 km2 for adult bears and 1/50.3 km2 for total bears, which included young treated with the same status as their mothers (marked or unmarked). The adult estimate was similar to the number of individual radio-collared bears (29) that were known to have been present on one or more occasions within the census area during the 7-day census effort. The estimate for all bears was slightly lower than the number we observed in the area on 1 or more days (37 versus 40). Binomial confidence intervals (CI) at the 95% levels for total and adult population estimates are provided in Figs. 30 and 31. As reported for other bear population estimates (Miller et al. 1987), confidence intervals converged as the census progressed. Population estimates and associated CI's leveled off by day 6. We surveyed one additional day to confirm that result and terminated the census effort after day 7.
Table 27. Grizzly bear (Ursus arctos) mark—resight density
estimates summarizing daily sightability of radio-collared individuals,
bear-days, population, and density estimates with their associated 80%
confidence intervals (CI) for both adults (>3 years) and bears of
all ages for a census within the 1,862-km2 Red Dog Mine study
area of northwestern Alaska from 29 May through 4 June 1987.
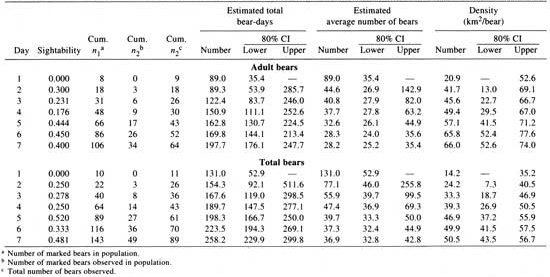
(click on image for a PDF version)
|
| Fig. 30. Changes in population estimates of adult (>3 years) grizzly bears and 95% confidence intervals over time for the Red Dog Mine study area in northwestern Alaska during 29 May through 4 June 1987. |

|
| Fig. 31. Changes in population estimates of grizzly bears of all ages and 95% confidence intervals over time for the Red Dog Mine study area in northwestern Alaska, 29 May through 4 June 1987. |
Eberhardt (1990) evaluated use of mark—resight methods for estimating grizzly bear densities. He concluded that the mean of the daily Petersen estimates was preferable to the bear-days estimator that we used in this study. Using his method of calculation on our data set resulted in bear density estimates that seemed greater than those obtained by using the bear-days estimator: the adult (>3 years) population estimate would have been 35 with an 80% CI of from 22 to 48 (95% CI = 13-57), and the total estimate would have increased to 49 ± 20 (80% CI). Eberhardt's method is sensitive, however, to outlying observations that can produce erroneous estimates. Day 1 of our census could be considered an outlier because no marked bears were observed. If day 1 is excluded from the analysis for both the bear-days estimator and Eberhardt's method, the resulting population estimates are nearly identical.
Particular care should be taken to reduce and minimize developmental effects on grizzly bear populations in Alaska because grizzly bears are threatened with extinction in the lower 48 states. Alaska contains about 65% of the continental population (Peek et al. 1987). Historically, declining or low grizzly bear populations have either failed to increase or the population response has been slow. Management of all grizzly bear populations has been hampered by an inability to accurately monitor their status in a timely and cost-effective manner. Typically, remedial actions are severe and often ineffective by the time an adverse change in status has been identified. For these reasons, we recommend that the 80% CI be used for evaluation of effects of the Red Dog Mine development to partially prevent making a Type II error of falsely concluding that there have been no changes in the population (Snedecor and Cochran 1973) as a result of development. The risk of this approach is that remedial actions to protect bears may be taken when no change in their population status has occurred. If errors are made in the other direction, however, a valuable renewable resource may be irretrievably sacrificed.
A large portion of the expense of conducting a mark—resight study on grizzly bears is the cost of marking new individuals during the census. We compared the differences in adult and total bear population estimates and respective CI's had no new individuals been radio-collared (Figs. 32 and 33) with the full data set from this study, which included new marked individuals (Table 27; Figs. 30 and 31). If no new bears had been radio-collared during the census, the resulting adult population estimate would have been only 1.8% less than the estimate obtained by including new individuals; however, the resulting 95% CI would have been much wider if no new bears had been marked (—29 to +64% of estimate, compared with —17 to +39% of estimate obtained by additional marking). The population estimate of all bears without marking new bears would have been 30% greater than the estimate obtained. Differences in CI's for the estimate of all bears were similar to that obtained for adult bears; the CI would have been much wider had no new bears been captured and marked (—31 to +67% of estimate, compared with —16 to +26% of the estimate we obtained). We concluded that the primary benefit of capturing and marking new bears as encountered is the attainment of narrower CI's and perhaps a more accurate population estimate.

|
| Fig. 32. Changes in population estimates of adult (>3 years) grizzly bears and 95% confidence intervals over time if no new bears had been captured and radio-collared as part of the census of the Red Dog Mine study area in northwestern Alaska, 1987. |

|
| Fig. 33. Changes in population estimates of grizzly bears of all ages and 95% confidence intervals over time, if no new bears had been captured and radio-collared, from the census of the Red Dog Mine study area in northwestern Alaska, 1987. |
The most important potential disadvantage with capturing new bears during the census is that captured bears may have a lower sightability following capture. Some bears, particularly those that are heavily dosed with drugs during immobilization, may be less active following capture. Marking new bears during the survey procedure, however, increases the precision of estimate.
The cost of the Noatak bear census was $64,713 (Table 28). Approximately half of that cost was attributed to the capture and radio-collaring of 25 adult bears. The collared bears were used to obtain data desired for other parts of the study, so some of these costs were attributable more broadly. Temporary marking using breakaway collars would have further reduced the cost by several thousand dollars because the transmitters could have been retrieved and used elsewhere. Use of a contract to cover helicopter expenses and use of government-owned or leased aircraft further reduced costs. Projected costs for the census could have reached $108,000 if chartered aircraft at commercial rates had been used (Table 28). Considering the remoteness and size of our census area, our cost of $64,000 was comparable to or lower than the $60,000 needed by Miller et al. (1987) to census a 1,317-km2 area in south-central Alaska.
Table 28. Summary of actual and projected costs for census of grizzly
bears (Ursus arctos) within the Red Dog Mine census area of
northwestern Alaska from 29 May through 4 June 1987.
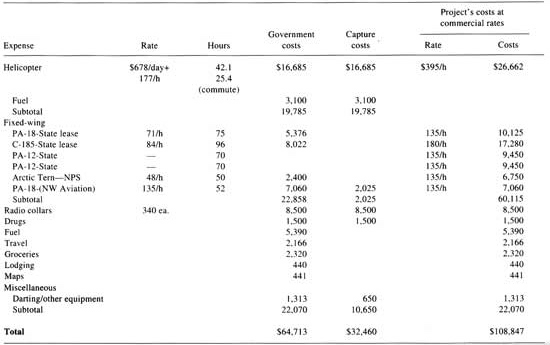
(click on image for a PDF version)
Assumptions of Mark—Resight Population Estimation
Otis et al. (1978) and White et al. (1982) list four assumptions that must be met for capture—resight population estimation methods to be valid:
1. the population is closed,
2. animals do not lose their marks during the experiment,
3. all marks are correctly noted and recorded at each trapping occasion, and
4. each animal has a constant and equal probability of capture on each trapping occasion (this also implies that capture and marking do not affect the ability to resight the animal).
We suggest that the above assumptions are either met or substantially reduced enough to provide for reasonable use of mark—resight methods for estimation of grizzly bear population size in small areas. Use of radio collars to monitor which individual bears (bear-days estimate) are present or absent from the census area satisfies the assumption of population closure or at least substantially reduces violation of the assumption. Assumption two is met even if an animal loses its mark, because with radio collars and subsequent visual identification, the loss would be detected before the animal was included in daily calculations. For example, during this study, one bear shed its collar on the next-to-last day of the census. This was identified on the day that it occurred, and the bear was subsequently treated as an unmarked individual after the loss of its mark. We believe that assumption three was met in all instances.
The largest potential problem concerns possible violation of assumption four. This particular assumption has been difficult to meet in all mark—resight studies, and it was the principal topic discussed by Otis et al. (1978). If Becker's (1988) analyses are valid and accurate, then this assumption may not be violated during bear mark—resight procedures.
One additional assumption not mentioned above is that all observations are independent of one another. The population estimate that includes bears of all ages must be used with caution because this assumption is violated when unmarked young are treated in the same manner as their mothers (marked or unmarked). Because of the violated assumption, similar problems could also occur during the mating season when a second adult is sighted. The largest problem with including these sightings and age classes in the estimate is that it will inflate the sample size and cause the variance of the estimate to be biased toward the low side (E. Becker, Alaska Department of Fish and Game, Anchorage, personal communication). This problem, however, does not seem to cause inaccuracies with the point estimate.
Use of mark—resight procedures in this study was successful partly because a relatively high (>50%) proportion of the population had been marked, and bear densities were relatively high. At lower bear densities, the method has a number of biases and sample size problems that may be overcome with further refinement (Reynolds and Garner 1987; Miller 1990b). In spite of real and potential problems and biases, the method allows managers to quickly and objectively estimate population size and density within a relatively small area. Most importantly, the resulting estimates are repeatable and statistically comparable. Other methods, which have relied to a large extent on the experience and expertise of the investigator, have been expensive, time consuming, and imprecise.
Density Comparisons
Our reported total density estimate of 1 bear/50 km2, based on the bear-days estimator, was near the midpoint of published density estimates for arctic study areas in North America (Table 29). If we had used the mean of the daily Peterson estimates, as suggested by Eberhardt, the total density would have been one of the greatest in an arctic environment. Reynolds (1982) reported that for North Slope Alaska populations, high bear densities in optimum habitat approached 1 bear/50 km2, and low density in lower-quality habitats was about 1 bear/207 km2. Most grizzly bear density estimates are based on the number of bears observed over several years of study; they may be imprecise, contain no variance estimate, and lack an estimate of the area occupied by the population.
Table 29. Comparison of reported grizzly bear (Ursus arctos) densities in arctic areas of North America.
| Area | Density (km2/bear) |
Source |
| Northern Yukon | 33-39 | Nagy et al. 1983a |
| Northern Yukon | 48 | Pearson 1975 |
| Western Brooks Range, Alaska | 42-44 | Reynolds 1984 |
| Northwestern Alaska | 50 (44-57)a | This study |
| Eastern Brooks Range, Alaska | 83-304 | Quimby 1974 Quimby and Snarski 1974 Curatolo and Moore 1975 Reynolds 1976 |
| Northwest Territories | 211-262 | Nagy et al. 1983b |
a80% confidence interval. | ||
Because a high proportion of our census area encompassed denning habitat, the density estimate is not representative of average bear densities in northwestern Alaska. Ninety percent of the marked and unmarked bears observed on the study area during the survey period were located in the mountainous portions (Fig. 2, count areas 5-10). Only 10% of the bears observed during the surveys were found at lower elevations (count areas 1-4), and 80% of those observations were within count area 4. Typically, bears move out of the mountainous terrain and inhabit lower-lying areas as spring and summer progress (Ballard et al. 1988). A similar distribution of bears was evident during 1986, when we initially captured bears for movement and demographic studies.
During spring 1986, we captured 48 bears to aid in defining a census area boundary and to minimize potential observability biases for females with COY. During that capture effort, we attempted to search all portions of the NRSA equally. Thirty-one bears were captured in the mountainous portions of the NRSA, and 17 (45% fewer) were captured in the southern half. We concluded that our reported bear density estimates are probably representative of high-quality denning habitat in an arctic ecosystem and not of overall year-round habitat.
Current Status, Survival, and Mortality Among Radio-collared Bears
Since inception of this study, 14 (21%) of 67 adult radio-collared bears were killed by hunters (Table 30). Status of 43 adult radio-collared females as of 1 November 1990 was as follows: 25 (58%) had functioning collars upon entering dens; 2 (5%) had shed their collars and their current status was unknown; 8 (19%) were missing due to malfunctioning collars or unreported harvest; 7 (16%) had been shot by hunters; and 1 (2%) died in a snow avalanche. As of November 1990, the status of the 24 males radio-collared during the study was as follows: 8 (33%) were last observed alive when their radio collars were removed; 7 (29%) had prematurely shed their collars that had been put on too loosely and their current status was unknown; 1 (4%) was missing because of a malfunctioning collar or unreported harvest; 7 (29%) had been shot; and 1 (4%) probably had been killed by wolves (Canis lupus). Rate of collar slippage was relatively high in this study, but we wanted to avoid rub marks or lacerations from the collars, particularly on young males. Excluding slipped collars, 24% of the radio-collared bears (41% of the males and 17% of the females) were killed by hunters; the latter statistic also includes the one reported defense-of-life-or-property kill during 1986-90. If we excluded missing animals, 29% of the radio-collared bears had been shot (44% of males and 21% of females) by late 1990.
Table 30. Summary of status of 146 marked grizzly bears (Ursus arctos) by category from 1986 through 1990 in the southwest Brooks Mountain Range, Alaska.
| Status unknown | |||||||
| Category | Alive | Slipped collars |
Missing | Collars removed |
Capture mortality | Hunting mortality |
Natural mortality |
| Radio-collared adults | |||||||
| Males | 7 | 1 | 8 | 0 | 7 | 1 | |
| Females | 25 | 2 | 8 | 0 | 0 | 7 | |
| Marked adults (uncollared) | |||||||
| Males | 0 | 0 | 8 | 0 | 0 | 1 | 0 |
| Females | 0 | 0 | 7 | 0 | 3 | 0 | 0 |
| Marked young (uncollared) | |||||||
| Males | 27 | N/A | 6 | N/A | 0 | 2 | 0 |
| Females | 19 | N/A | 6 | N/A | 0 | 0 | 0 |
| Total | |||||||
| All males | 27 | 7 | 15 | 8 | 0 | 10 | 1 |
| All females | 44 | 2 | 21 | 0 | 3 | 7 | 1 |
| All bears | 71 | 9 | 36 | 8 | 3 | 17 | 2 |
Alaskan biologists have frequently used the sex and age structure of the harvest as an input of importance in bear management. We compared the sex and age structure of harvested grizzly bears in northwestern Alaska (State regulations refer to Game Management Unit 23) during 1969 through 1989 with the sex and age structure of bears captured in the NRSA during 1986 through 1990 (Figs. 34 and 35). The age structure of captured males was more skewed toward younger bears, compared with the age structure of the 20-year harvest. Apparently, historical harvests have reduced the number of older males in the NRSA bear population. In comparison, the age structure of captured females does not seem to be as skewed toward younger age classes. The skewed age structure of males observed in this study is one indication that the population may be overexploited. If hunters select larger, older bears, attempts to increase bear harvests may put additional harvest pressure on adult females. Such changes could reduce the bear population as has occurred in other bear populations such as in south-central Alaska (Miller and Miller 1988; Miller 1990b).

|
| Fig. 34. Age structure of female grizzly bears harvested during 1969 through 1989, compared to the age structure of females captured during 1986 through 1990 in the Noatak River study area in northwestern Alaska. |

|
| Fig. 35. Age structure of male grizzly bears harvested during 1969 through 1989, compared to the age structure of males captured during 1986 through 1990 in the Noatak River study area in northwestern Alaska. |
The above analysis assumes that captured bears were representative of the sex and age structure of the standing population. The possibility exists that the tagged sample may not have been representative of the actual population. This was especially true for older bears that may have been more secretive than younger age classes, and females with COY that seem less observable than other family classes (see Population Estimates and Density). If older bears (> 13 years), particularly males, were less likely to be captured, then the male age structure may have underrepresented this age class. We believe, however, that this potential bias was greatly reduced because we captured bears during the breeding season when males should have been accompanying collared and uncollared adult females. Also, if females with COY were less observable and less likely to be captured, this should have resulted in a discrepancy in age structures between the captured and the harvested sample. No discrepancy was observed, so we believe the capture sample was representative of the standing population.
Survival rates of COY during their first summer of life were relatively high, averaging 0.874 (Tables 31 and 32). Unfortunately, this rate may have overestimated survival because 67% of the females without COY had apparently produced COY but lost them between den emergence and capture. Consequently, these lost COY would not have been included in our estimates. Survival of COY through their first winter was also relatively high, averaging 0.955 (Tables 33 and 34). There were no differences (P > 0.05) in COY survival rates between years except that the 1986 rate was significantly different (P < 0.05) than that in 1989. Reasons for the one significant difference are not known.
Table 31. Survival rates of grizzly bear (Ursus arctos) cubs of the year (COY) from den emergence to den entrance in northwestern Alaska, 1986 though 1990.a
| Year | n | Rate | Variance | 95% CI |
| 1986 | 7 | 1.0000 | ||
| 1987 | 9 | 0.6667 | 0.0247 | 0.3587-0.9747 |
| 1988 | 22 | 0.9545 | 0.0020 | 0.8675-1.0416 |
| 1989 | 22 | 0.8021 | 0.0085 | 0.6216-0.9827 |
| 1990 | 16 | 0.9286 | 0.0047 | 0.7937-1.0635 |
| Total | 76 | 0.8743 | 0.0016 | 0.7959-0.9528 |
aSurvival rates determined at 2-week intervals with methods described by Pollock et al. (1989). | ||||
Table 32. P-values for comparisons of cub-of-the-year (COY) grizzly bear (Ursus arctos) survival rates within the Noatak River study areas of northwestern Alaska during 1986 through 1990.a
| Year | 1987 | 1988 | 1989 | 1990 |
| 1986 | 0.063 | 0.320 | 0.043 | 0.313 |
| 1987 | 0.107 | 0.469 | 0.152 | |
| 1988 | 0.147 | 0.754 | ||
| 1989 | 0.278 | |||
aDerived from t-tests (Sokal and Rohlf 1969). | ||||
Table 33. Overwinter survival rates of grizzly bear (Ursus arctos) cubs at den entrance to den emergence as yearlings in northwestern Alaska during 1986 through 1990.a
| Year | n | Rate | Variance | 95% CI |
| 1986-87 | 5 | 1.0000 | ||
| 1987-88 | 6 | 0.8333 | 0.0231 | 0.5351-1.1315 |
| 1988-89 | 20 | 0.9500 | 0.0024 | 0.8545-1.0455 |
| 1989-90 | 13 | 1.0000 | ||
| Total | 44 | 0.9545 | 0.0100 | 0.8930-1.0161 |
aSurvival rates determined by methods described by Pollock et al. (1989). | ||||
Table 34. P-values for comparison of overwinter grizzly bear (Ursus arctos) cub survival rates within the Noatak River study area of northwestern Alaska during 1986-1987 through 1989-1990.a
| Year | 1987 | 1988 | 1989 |
| 1986 | 0.315 | 0.320 | |
| 1987 | 0.488 | 0.315 | |
| 1988 | 0.319 | ||
aDerived from t-tests (Sokal and Rohlf 1969). | |||
Yearling grizzly bear survival rates during the study averaged 0.887 (Tables 35 and 36). There were no differences (P > 0.05) in yearling survival rates between years.
Table 35. Survival rates of yearling grizzly bears (Ursus arctos) from den emergence to den entrance in northwestern Alaska during 1986 through 1990.a
| Year | n | Rate | Variance | 95% CI |
| 1986 | 1 | 1.0000 | ||
| 1987 | 16 | 0.8750 | 0.0068 | 0.7129-1.0371 |
| 1988 | 5 | 1.0000 | ||
| 1989 | 20 | 0.9000 | 0.0045 | 0.7685-1.0315 |
| 1990 | 11 | 0.8182 | 0.0135 | 0.5903-1.0461 |
| Total | 53 | 0.8868 | 0.0019 | 0.8015-0.9721 |
aSurvival rates estimated at 2-week intervals by methods described by Pollock et al. (1989). | ||||
Table 36. P-values for comparison of yearling grizzly bear (Ursus arctos) survival rates within the Noatak River study area of northwestern Alaska during 1986 through 1990.a
| Year | 1987 | 1988 | 1989 | 1990 |
| 1986 | 0.149 | 0.152 | 0.146 | |
| 1987 | 0.149 | 0.816 | 0.694 | |
| 1988 | 0.152 | 0.146 | ||
| 1989 | 0.549 | |||
aDerived from t-tests (Sokal and Rohlf 1969). | ||||
Adult female annual survival rates averaged 0.940 (Tables 37 and 38). Rates obtained in 1987 and 1988 were significantly different (P < 0.05) from those during 1990. There were no differences (P > 0.05) in survival rates between the other years. Eight of 43 radio collars on females failed prematurely, so they were censored from the survival data set. Because we replaced radio collars every 2 years, the number of premature radio failures should have been low. We heard rumors that some bears had been shot but not sealed. Loon and Georgette (1989) reported that most bears killed by subsistence users had not been presented to department officials. They estimated that only from 14% to 18% of the rural harvest was actually reported. If their data are correct, there is a high probability that many of the missing adult females were shot and not reported. Five of eight missing collars occurred between 15 May and 25 June; the others were lost after 4 September. The overall survival rate would decline to 0.879 if we assume that all of these missing radio-collared females had been shot.
Table 37. Annual survival rates of radio-collared adult (≥3.5 years) female grizzly bears (Ursus arctos) in northwestern Alaska during 1986 through 1990.a
| Year | n | Rate | Variance | 95% CI |
| 1986 | 16 | 0.9375 | 0.0037 | 0.8189-1.0561 |
| 1987 | 28 | 1.0000 | ||
| 1988 | 30 | 1.0000 | ||
| 1989 | 34 | 0.9063 | 0.0027 | 0.8053-1.0072 |
| 1990 | 32 | 0.8681 | 0.0040 | 0.7445-0.9917 |
| Total | 140 | 0.9406 | 0.0004 | 0.9002-0.9809 |
aSurvival rates estimated at 2-week intervals with methods described by Pollock et al. (1989). | ||||
Table 38. P-values for comparison of adult female radio-collared grizzly bear (Ursus arctos) survival rates within the Noatak River study area of northwestern Alaska during 1986 through 1990.a
| Year | 1987 | 1988 | 1989 | 1990 |
| 1986 | 0.320 | 0.320 | 0.699 | 0.433 |
| 1987 | 0.080 | 0.045 | ||
| 1988 | 0.080 | 0.045 | ||
| 1989 | 0.642 | |||
aDerived from t-tests (Sokal and Rohlf 1969). | ||||
Survival rates of adult males during 1986 through 1988 averaged 0.906, ranging from 0.838 in 1987 to 0.929 in 1986 (Tables 39 and 40). We removed collars from males after 1988 because project objectives had been met. Only one radio collar was classified as missing during the 3 years we maintained radio contact with males. Overall, there were no differences (P > 0.05) in annual survival rates between sex and age classes of bears (Table 41).
Table 39. Annual survival rates of radio-collared adult (≥3.5 years) male grizzly bears (Ursus arctos) in northwestern Alaska during 1986 through 1988a
| Year | n | Rate | Variance | 95% CI |
| 1986 | 16 | 0.9286 | 0.0044 | 0.7986-1.0586 |
| 1987 | 20 | 0.8382 | 0.0076 | 0.6676-1.0089 |
| 1988 | 13 | 0.8889 | 0.0110 | 0.6836-1.0942 |
| Total | 49 0.9055 | 0.0021 | 0.8158-0.9952 | |
aSurvival rates estimated at 2-week intervals by methods described by Pollock et al. (1989). | ||||
Table 40. P-values for comparisons of adult male radio-collared grizzly bear (Ursus arctos) survival rates within the Noatak River study area of north western Alaska during 1986 through 1988.a
| Year | 1987 | 1988 |
| 1986 | 0.415 | 0.752 |
| 1987 | 0.713 | |
aDerived from t-tests (Sokal and Rohlf 1969). | ||
Table 41. P-values for comparison of annual survival rates of grizzly bears (Ursus arctos) by sex and age class within the Noatak River study area of northwestern Alaska during 1986 through 1990.a
| Sex-age class | COYb | Yearling | Adult female | Adult male |
| COYb | 0.833 | 0.141 | 0.609 | |
| Yearling | 0.265 | 0.768 | ||
| Adult female | 0.485 | |||
aDerived from t-tests (Sokal and Rohlf 1969). bCub-of-the-year. | ||||
Assessment of Population Status and Effects of Harvest
One of the objectives of this study was to resolve conflicting views over the status of grizzly bears in northwestern Alaska. Some local residents have expressed concerns about losses of property and potential threats to human life (Larsen 1988). Some residents in northwestern Alaska also believe that bear populations are currently higher than historical levels (Loon and Georgette 1989). Because of these concerns and because grizzly bears are classified as a subsistence use species in northwestern Alaska, many local residents have advocated liberalizing grizzly bear hunting seasons and bag limits. Subsistence use is defined as "customary and traditional uses by rural Alaska residents of wild, renewable resources for direct personal or family consumption as food, shelter, fuel, clothing, tools, or transportation and for the making and selling of inedible portions for handicraft articles for barter, customary trade, and sharing" (Alaska National Interest Land Conservation Act, Public Law 96-487, Title 8, 1980). Many local residents of northwestern Alaska believe bear densities are too high, preferring a smaller population (Loon and Georgette 1989).
Alaska hunting regulations require that the hide and skull of all grizzly bears harvested be presented to officials of the Alaska Department of Fish and Game (ADF&G) within 30 days of the date of harvest for sealing. Sealing of bear hides and skulls has been required since statehood (1959); but compliance in some management areas, especially northwestern Alaska, has been low. Annual reported harvests of grizzly bears showed an increasing trend from 8 in 1962 to 57 in 1979 (Fig. 36). Since 1979, annual reported harvests have ranged between 22 and 48. Patterns of annual reported harvests within the bear study area have paralleled those of northwestern Alaska, but an increasing proportion of the total harvest has come from NRSA (Fig. 37). There has been no trend in the proportion of the reported harvest composed of females.

|
| Fig. 36. Reported annual harvest of grizzly bears in northwestern Alaska, 1962 through 1989. |

|
| Fig. 37. Proportion of the reported northwestern Alaska grizzly bear harvest that occurred within the Noatak River study area, 1962 through 1989. |
Use of grizzly bears for food purportedly is widespread in northwestern Alaska (Loon and Georgette 1989). Based on key respondent interviews in selected villages, Loon and Georgette (1989) estimated that only 14-18% of actual harvests of grizzly bears are reported to the ADF&G. Most of the reported harvests were by nonlocal Alaska residents and nonresidents (Larsen 1988). Compliance with sealing regulations by guides and nonlocal residents is thought to be high. Although the accuracy and precision of Loon and Georgette's (1989) harvest estimate, noncompliance with regulations, and historic use of bears are not known because of the methodology used, they provide the only attempt at quantification of these parameters. If we assume their estimates were correct, the actual harvests in northwestern Alaska could be from 103 to 142% larger than reported. Many knowledgeable authorities consider the use of harvest statistics for assessing population status as marginal at best, even when the sex and age structure of a high proportion of the harvest is known (Harris 1984; Harris and Metzgar 1987a, 1987b). The use of such data, when more than 50% of the harvest is unreported, would be nearly meaningless. Because of unreported harvests and problems with using harvest data to assess population status, it was necessary to evaluate the status of the population and the potential for allowing higher harvests using other methods in addition to analysis of harvest data.
To assess the potential effects of human harvests on the study area population, it was necessary to extrapolate the bear density estimate from the census area to a much larger area, herein referred to as harvest area, and compare this estimate with known minimum harvests. We estimated the bear population within the NRSA and adjacent areas (Fig. 38). This area encompassed nearly all of the home ranges of the radio-collared bears (i.e., as determined in 1986 and 1987). For this analysis, we assumed that bear densities in the mountainous portions of the NRSA were similar to those in the census area (1 bear/50.5 km2). In the lower-elevation southern areas, we assumed densities were 50% lower, or about 1 bear/100.5 km2. This was based on the distribution of bear sightings and captures in 1986 and 1987. Based on our stratification of the harvest area, these densities were then extrapolated to the harvest area and into one of two density strata. Approximately 5,947 km2 were classified as high-density habitat and 6,932 km2 as low-density habitat. The extrapolated bear population for the 12,879-km2 area (Fig. 38) was 188 bears, or 1 bear/69 km2. If our stratification was correct, overall bear density was much lower than 1 bear/50 km2, as reported in Table 29.

|
| Fig. 38. Boundaries of individual harvest areas (12,879 km2) used to asses harvest rates of grizzly bears in northwestern Alaska, 1962 through 1989. |
Minimum reported annual harvests within the NRSA harvest area have ranged from 0 to 23. From 1983 through 1989, reported harvests have ranged from 4 to 23. Comparison of these latter annual harvests with the estimated size of the bear population results in annual harvest rates ranging from 2 to 12% of the bear population (Fig. 39). If estimated unreported harvests from communities within or adjacent to the NRSA (Noatak, Kivalina, and 25% of Kotzebue harvests [from Loon and Georgette 1989]) were added to known reported harvests, the estimated annual harvest rates during 1983 through 1989 would increase to 4-16%. These rates may also be low, however, because in addition to unreported subsistence harvests, a number of unreported defense-of-life-or-property kills were known to have occurred (Alaska Department of Fish and Game files). These latter kills were not represented in Loon and Georgette's (1989) sample.
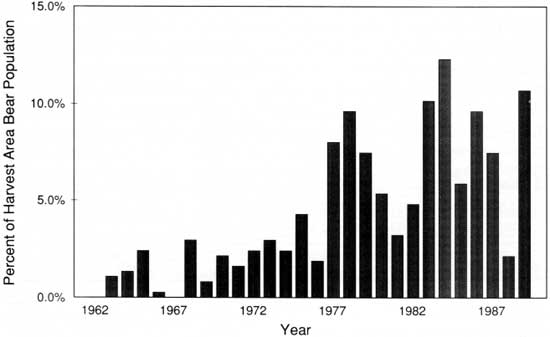
|
| Fig. 39. Estimated annual harvest rates of grizzly bears within a 12,879-km2 area that encompassed the Noatak River study area, 1962 through 1989. This assessment assumed a stable bear population of 188 individuals based on the bear-days estimator and considered only known reported harvests. |
Earlier, Ballard et al. (1990d) used Eberhardt's method of estimating bear density in addition to the bear-days estimator. Because no marked bears were observed during the first day of the census, the use of Eberhardt's method resulted in an overestimation of the density. Consequently, the annual harvest rates of 6-12% reported by Ballard et al. (1990d) underestimated the actual rates and should be disregarded.
We also attempted to assess allowable harvests for this bear population using population modeling. We used the deterministic model developed by Miller and Miller (1988). The model allows users to input reproduction and mortality parameters from their individual study area. We estimated relative mortalities of each age class based on study data or estimates provided in the literature. Although the model has a number of uses, we were most interested in the predicted allowable harvests using our reproduction and mortality data. After inputting our best estimates of survival (Tables 31-41) to determine allowable harvests, survival rates were then adjusted until the population growth curve became level. The population is defined as stable when recruitment equals mortality. This exercise suggested that our estimates of adult male survival may have been too high and that mortalities for the 2- to 4-year-old age classes may be relatively high. All simulations suggested that an annual harvest rate of about 8% may be sustainable, assuming males have a higher vulnerability to harvest than females.
Although our harvest rate estimates are admittedly crude, comparison with harvest rates reported elsewhere in North America (LeFranc et al. 1987:81) suggests that current harvests equal or exceed the maximum allowable harvest. Harvest certainly exceeds the conservative exploitation rates of 2-4% recommended for northerly latitudes by Reynolds (1976) and Sidorowicz and Gilbert (1981). They also exceed the 5.7% maximum sustainable rates for grizzly bears suggested by Miller (1990a), who used "generous estimates of reproduction rates and survivorship." Our estimates, even if only a rough approximation of actual harvest rates, when combined with other data in the modeling efforts, suggest that hunting seasons and bag limits cannot be liberalized without the resulting harvest causing a reduction in the bear population. If unreported harvests are actually larger than our estimates, the population is probably being overexploited and restrictions in harvest may be appropriate.
Some local residents have expressed a desire for changes in current bear hunting regulations to accommodate customary and traditional uses and methods of harvest (Loon and Georgette 1989). Current bear hunting regulations in northwestern Alaska require that hunters possess a $25 tag and a state hunting license, take only one bear every 4 years, and present the skull and hide of all harvested bears to an ADF&G representative for sealing. When sealed, skull measurements are taken, a tooth is extracted for age determination, and sex is determined from the hide. Hunting seasons during this study were 1 September-10 October and 15 April-25 May. Only 25 permits to harvest a bear are issued to nonresidents each year (7 in spring and 18 in fall). Loon and Georgette (1989) suggested that many local hunters view the purchase of a special tag as an announcement of the hunters intention to kill a bear, which conflicts with their traditional values.
Loon and Georgette (1989) reported that the bag limit of one bear per 4 years was largely ignored by local hunters. Apparently, some hunters killed many bears, whereas others killed bears less frequently or not at all. The concept of bag limits conflicts with the tradition where only a few hunters do the majority of the hunting for most villages.
Subsistence hunters prefer to hunt in spring and fall, but current hunting season lengths are not adequate (Loon and Georgette 1989) to encompass traditional hunting practices. Apparently, hunters frequently take bears as soon as they emerge from their dens; in inland areas, this can be as early as March or as late as May. The early harvest practices are dependent on snow machines for access. Bears, particularly boars that emerge first, are vulnerable to this method of hunting because den sites are usually easy to spot and access by snow machine is relatively easy.
Loon and Georgette (1989) also reported that requiring subsistence hunters to salvage the skull and hide conflicts with traditional practices because some hunters leave them in the field or in camp as a sign of respect for the bear and that sealing is an additional burden on them.
Subsistence users believe that regulations should require the salvage of meat (Loon and Georgette 1989). Current regulations require only the salvage of the hide and skull. We found one instance during our study of a marked bear that had been obviously killed for meat rather than hide. The skull, radio collar, ear tags, and hide were left at the kill site, whereas the four quarters and other parts were removed.
Current state regulations also prohibit the taking of female bears accompanied by cubs (includes COY and yearlings) and the purchase, selling, or bartering of any bear part. It has not been determined whether these issues impose undue restrictions on subsistence bear hunters.
If all of the changes suggested above were implemented, there would be few, if any, restrictions on the harvesting of grizzly bears by subsistence users. The current Alaska regulations on bear hunting were developed over a period of years in response to an ever-increasing demand on a limited supply of bears. Seasons and bag limits were imposed as methods of limiting the harvest within sustained-yield limits. We do concur, however, that the regulations are biased towards trophy hunting rather than toward use of bears as meat. It should be recognized, however, that even under the restrictive federal definition of qualified subsistence hunters, both traditional and nontraditional subsistence hunters will be allowed to hunt.
Although only 14-18% of the bear harvest by subsistence users may be reported, what is not known is how many subsistence hunters comply even to some degree with state hunting regulations. Certainly fear of being apprehended and general respect for laws cause some individuals to comply with all or some of the regulations. Because the bear population in the study area and adjacent areas is probably being harvested at or above sustained-yield levels, eliminating all restrictions on bear hunting would, in our opinion, have disastrous consequences for the bear population. Widespread availability of snow machines, motor boats, and aircraft to subsistence hunters in northwestern Alaska emphasizes the concern. Loon and Georgette (1989:49) maintain that local hunters would be more likely to report their bear harvests if regulations accommodated their hunting practices and the reporting procedure was simple. However, caribou hunting regulations have been changed in recent years to accommodate some of the local hunting practices, and the reporting system is quite simple—yet reporting compliance for caribou remains low. If compliance with bear hunting regulations could be assured and biological data gathered on the entire harvest, some changes in bear hunting regulations might be possible and appropriate.
Some individuals have suggested that bag limits and season dates could be eliminated for resident subsistence hunters by establishing a village quota system; however, whether such regulations are legally possible needs to be established. Such a system would have to be administered by village Indian Reorganization Act Councils or some other local organization. Strict compliance would be essential. We recommend initial quotas based on the findings of Loon and Georgette (1989) be established, and that additional refinement occur through joint research by the State Division of Wildlife Conservation, the State Division of Subsistence, the National Park Service, and the U.S. Fish and Wildlife Service. All recent and objective analyses suggest that current harvests are at or above sustained-yield levels. Any changes in subsistence harvest regulations must result in absolute compliance with the harvest reporting requirements for such a system to work.
Biologists have traditionally used the sex and age structure of the harvest as one tool for assessing the trend and status of a bear population. For the method to work, however, a large representative portion of the harvest must be reported and the appropriate biological samples collected. Data from this region are probably meaningless because most of the subsistence harvest is not reported.
It becomes obvious that serious conflicts exist in management of the bear populations. Analysis of the status of bear populations can be accomplished within the resources available to managers only if a representative and adequate sample of harvested bears is presented for gathering of data. Apparently, some subsistence hunters would prefer not to retrieve the skull or hide, and some would prefer not to report harvested bears. The resulting loss of sex and age information for the population precludes analysis of the status of the population. If hunters willingly presented the front portion of the lower jaw and accurately recorded several field measurements of their bear the sealing requirement may not be necessary. Reporting of each harvested bear, whether taken for sport or subsistence, is vitally important for assessing the status of each population and essential for managers to determine sustainable yields available for harvest.
Evaluation of Hypotheses
We reject our original hypothesis Ho1 that bear densities within the NRSA are relatively high in relation to those found elsewhere in arctic Alaska. Bear densities within the NRSA were within the midrange of other arctic estimates. Our estimate of 1/50 km2 was representative of high-quality denning habitat. Year-round density for a 12,879-km2 area was about 1/69 km2.
Comparison of harvest estimates, survival rates, and population modeling suggest that the bear population is being overharvested. Consequently, we reject Ho2 that human harvests of grizzly bears were within sustained yield levels. This finding will complicate attempts to determine effects from mine development. Originally, we had intended to compare pre- and postmine development bear densities. A decline in density would have been assumed to have been caused by mine development. If our conclusions of overharvest are correct, however, any reductions in bear density may be due to overharvest rather than mine development. This possibility will make assessments of movement patterns and fates of radio-collared adults more important than previously planned to the evaluation of mine development.
Use of satellite telemetry for monitoring movements of bears in relation to mine development was successful and cost effective. We accepted Ho3, that satellite telemetry is a useful and cost effective tool for evaluating bear movements.
We detected no avoidance of the mine site and associated facilities by radio-collared bears, at least during the construction phase of the project. In fact, three bears were attracted to the site because of food at a temporary garbage dump. No further attraction of bears was detected or reported after the dump was removed. The full scale production of ore, however, did not begin at the site until 1990, when this study was near completion. We reject the portion of Ho4 that adult male and female grizzly bears would be displaced from the Red Dog Mine area due to construction, but continued monitoring of radio-collared bears is necessary to evaluate the portion of Ho4 related to mine operation.
Our last and perhaps most important hypothesis, Ho5—that as a result of displacement and increases in incidental mortality, bear densities surrounding the mine site will be less than before development—cannot be evaluated at this time. Separating causes of reductions in bear density due to hunting versus mine development will be difficult because the bear population seems to be harvested above sustained yield levels. Intensive monitoring of movements of radio-collared bears that utilized the mine site before development and a postdevelopment density estimate, along with an assessment of current harvest rates, may allow some insight into the effects of the mine on the grizzly bear population.
| <<< Previous | <<< Contents >>> | Next >>> |
23/results.htm
Last Updated: 08-Oct-2008