
|
GLACIER
Glaciers and Glaciation in Glacier National Park Special Bulletin No. 2 |

|
SHRINKAGE OF PARK GLACIERS
Prior to the beginning of the present century all glaciers in the park, and practically all others throughout the Temperate Zone of the Earth, began to shrink in response to a slight change in climate, probably involving both a temperature rise and a decrease in annual snowfall. From about 1900 until 1945 shrinkage of park glaciers was very rapid. In other words these glaciers were not in equilibrium with the climate, for less ice was added to them each winter than disappeared by melting and evaporation during the remainder of the year.
Over a period of several years such shrinkage is apparent to the eye of an observer and is manifest by a lowering of the glacier's surface, and more particularly by a "retreat" of the lower edge of the glacier. This part of the ice is generally referred to as the ice front. When sufficient snow is added to the upper part of the glacier to cause the ice at the front to move forward equal to the rate at which it melts away, the glacier is in equilibrium with the climate. When the yearly added snow decreases in amount the ice front seems to retreat or move back whereas the mass of the glacier is merely decreasing by melting on top and along the edges, just as a cube of ice left in the kitchen sink decreases in size.
The National Park Service initiated observations on glacier variations in 1931. At first the work consisted only of the determination of the year by year changes in the ice front of each of several glaciers. In 1937, 8, and 9 the program was expanded to include the detailed mapping of Grinnell, Sperry, and Jackson Glaciers, respectively, to serve as a basis for comparisons in future years. Aerial photographs were obtained of all the known Park glaciers in 1950 and 1952 and again in 1960. Since 1945, the glacier observations have been carried on in cooperation with the U.S. Geological Survey. The work has included the periodic measurement of profiles to determine changes occurring in the surface of Grinnell and Sperry Glaciers and also the determination of the rate of annual movement. Some of the more important data yielded by surveys on Grinnell and Sperry, the two largest glaciers in the Park, are summarized in the following tabulations:*
GRINNELL GLACIER
(Change in area in acres)A
| Year | Area | Remarks |
| 1901 | 525 | From Chief Mountain topographic quadrangle map. |
| 1937 | 385 | From map by Dyson of lower portion of glacier plus area of upper glacier (57 acres) as shown on 1950 U.S.G.S. map. |
| 1946 | 337 | Same as above. |
*This information by Mr. Dyson which appears on pp. 97-102 in Vol. 38 of the GEOGRAPHICAL REVIEW, has been revised by Mr. Arthur Johnson of the U.S.G.S.
AGrinnell Glacier originally consisted of an upper and lower portion connected by a narrow ice tongue. This tongue disappeared in 1926 and since then the two portions have been separate.
| Year | Area | Remarks |
| 1950 | 314 | From 1950 U. S. G. S. map including upper portion. |
| 1960 | 300 (approx.) | Very little decrease in area since 1950. Surface area in 1960 estimated to be not more than 10 or 15 acres less than in 1950. (Including upper portion.) |
Recession of front, in feet, of half-mile section of front southeast from lake at north end of glacier.
| Period | Recession During Period |
Total Recession Since 1937 |
Average Annual Recession |
| 1937-45 | 270 | 270 | 34 |
| 1945-50 | 75 | 345 | 15 |
| 1950-60 | 44B | 389 | 4 |
The above data indicates that there has been no significant change in the area of Grinnell Glacier during the past decade. The surface elevation varies somewhat from year to year. The average elevation of the ice surface at the end of the melting season in 1960 was approximately 10 feet less than in 1950.
The movement of Grinnell Glacier, based on observations since 1947, has been about 35 to 40 feet per year.
SPERRY GLACIER
(Change in area in acres)
| Year | Area | Remarks |
| 1901 | 810 | From Chief Mountain topographic quadrangle map. |
| 1938 | 390 | From map by Dyson. |
| 1950 | 298 | From 1950 U.S.G.S. map of the glacier. |
| 1961 | 275 | From 1950 U.S.G.S. map of the glacier with front corrected to 1961. |
BMuch of this apparent change is due to the change in the lakeshore which varies considerably from year to year and is not a true indication of recession.
Recession of front, in feet, of central half-mile section
| Period | Recession | Total Recession Since 1938 |
Average Annual Recession |
| 1938-45 | 351 | 351 | 50 |
| 1945-50 | 177 | 528 | 35 |
| 1950-56 | 85 | 613 | 14 |
| 1956-61 | 196 | 809 | 39 |
Sperry Glacier, in contrast with Grinnell Glacier, has shown a continuing recession and consequent shrinkage in area. The shrinkage has been most pronounced in the portion of the glacier below an altitude of 7,500 feet.
The forward movement of Sperry Glacier, based on observations since 1949, has averaged 13 feet per year.
It is of interest to note from the above data that the changes in Sperry Glacier are more pronounced than those in Grinnell Glacier although the straight-line distance between them is only 9 miles. One possible reason—Grinnell Glacier is on the eastern slope of the Continental Divide whereas Sperry Glacier is on the western slope.
Sperry Glacier in 1900 had a surface area of 1.31 square miles (840 acres.) By 1938 the area had shrunk to 390 acres, and in 1946 to about 330 acres.
Even more significant is the lowering of the glacier's surface, from which volume shrinkage may be obtained. In 1938 Sperry Glacier had a thickness of 108 feet at the site of the 1946 ice margin. At this same place in 1913 the thickness was nearly 500 feet, and the average thickness of the glacier over the area from which it has since disappeared was at least 300 feet.
The average thickness of Grinnell Glacier in 1937 at the site of the 1946 ice front was 73 feet. The surface of the entire glacier was lowered 56 feet during that nine-year period. This means that each year the glacier was reduced in volume by an amount of ice equivalent to a cube 450 feet high.
|
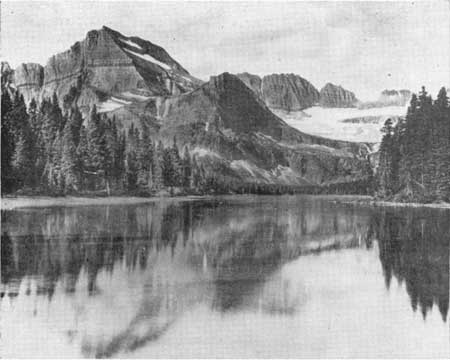
| GRINNELL GLACIER AS IT LOOKED PRIOR TO 1926 WHEN THE LOWER AND UPPER SEGMENTS WERE STILL CONNECTED. |
At the northern terminus of Grinnell Glacier, which is bordered by a small marginal lake, a large section of the ice front fell into the water on or about August 14, 1946, completely filling it with icebergs. This event, although witnessed by no one, must have been comparable to many of the icefalls which occur at the fronts of the large glaciers along the southeast coast of Alaska.
The volume of Grinnell Glacier was reduced by about one-third from September 1937 to September 1946. Several other glaciers have exhibited a more phenomenal shrinkage than Sperry or Grinnell. The topographic map of Glacier National Park, prepared in 1900-1902, shows several comparatively large glaciers such as Agassiz, Blackfoot and Harrison. Their shrinkage has been so pronounced that today Agassiz has virtually disappeared and the other two are pitifully small remnants, probably less than one-fifth the size they had been when originally mapped.
Since 1945, because of above-normal snowfall and subnormal temperatures, glacier shrinkage has slowed down appreciably, coming virtually to a standstill in 1950; and in 1951, for the first time since glacier changes have been recorded in the park, Grinnell Glacier increased slightly in volume. This was also reflected by a readvance of the front. Although no measurements were made in 1951 on other park glaciers some of them certainly made similar readvances. Thus the climatic conditions which caused glaciers to shrink for fifty or more years seem to have been replaced by conditions more favorable to the glaciers. Time alone will tell whether the new conditions are temporary or mark the beginning of a long cycle of wetter and cooler climate.
| <<< Previous | <<< Contents>>> | Next >>> |
glac/gnha/2/sec3.htm
Last Updated: 11-Jul-2008