
|
Geological Survey Professional Paper 1365
Ice Volumes on Cascade Volcanoes: Mount Rainier, Mount Hood, and Mount Shasta |
RESULTS FROM FOUR CASCADE VOLCANOES
MOUNT RAINIER
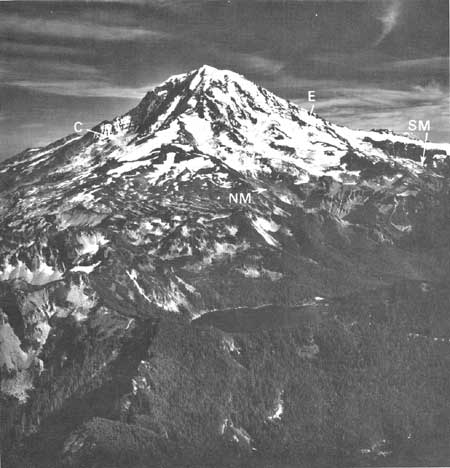
Mount Rainier is west of the Cascade crest about 40 miles southeast of Tacoma, Wash. (fig. 8). The mountain, rising to 14,410 ft above sea level, dominates the landscape, and in fact, its geologic development has affected much of the surrounding local topography.
|
| FIGURE 8.—Mount Rainier, Wash., as seen from the northwest, showing the Carbon (C), North Mowich (NM), Edmunds (E), and South Mowich (SM) Glaciers. Mowich Lake is in the foreground. (U.S. Geological Survey photograph by Robert Krimmel on August 17, 1981.) |
Water flows from the mountain in five major drainage basins. The Nisqually, Puyallup, Carbon, and White Rivers flow into Puget Sound, and the Cowlitz River flows into the Columbia River. Figure 9 indicates that the largest areas of snow and ice cover are in the watersheds of the Puyallup River (29 percent) and the White River (29 percent).
There are presently 23 major glaciers on Mount Rainier. These glaciers are some of the most accessible to the public in the nation. Descriptions and research on some, such as the Nisqually Glacier, date back to 1870 (Heliker and others, 1983, p. 3).
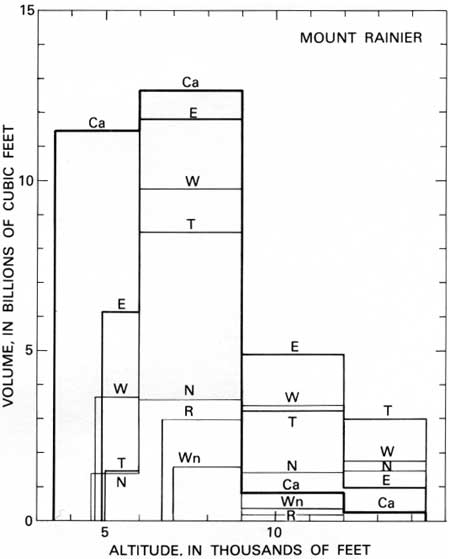
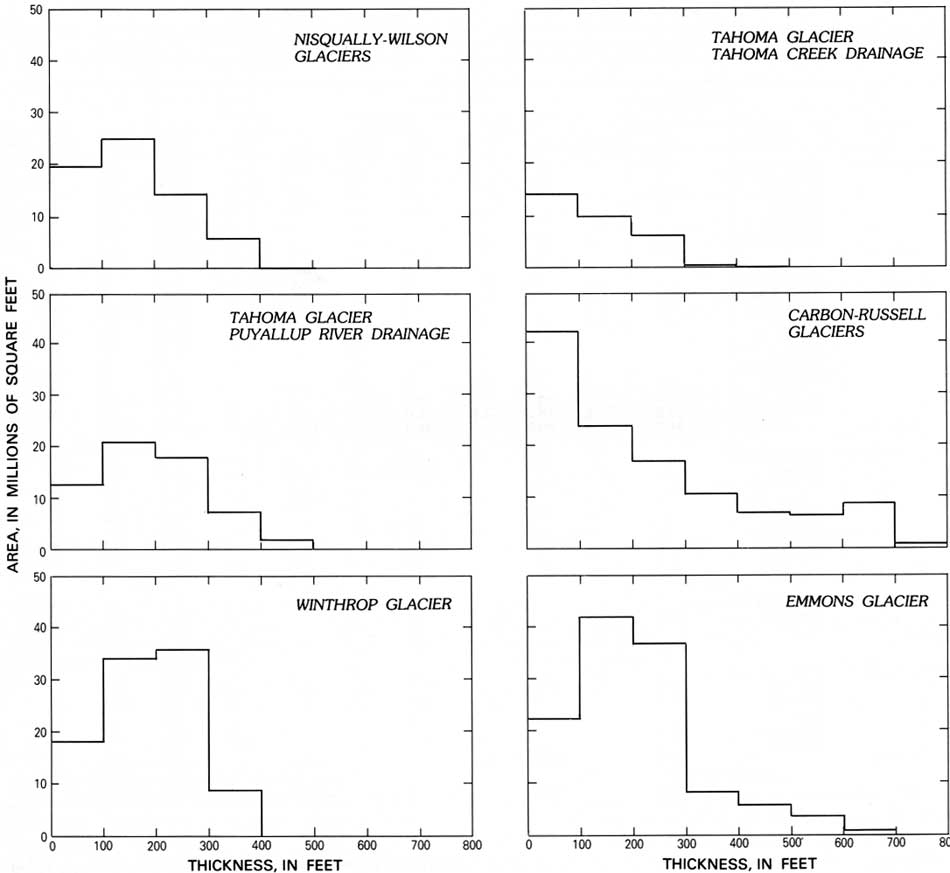
The five glacier systems measured on Mount Rainier are the Nisqually-Wilson, Tahoma, Carbon-Russell, Winthrop, and the Emmons. The volume of ice and snow on Mount Rainier is 156.2 billion ft3. Glacier and snow patch dimensions are listed by drainage area and by altitude in table 2. The maximum ice thickness measured on Mount Rainier is 705 ft, in the Carbon Glacier. With a volume of 25.1 billion ft3, the Carbon Glacier has the largest volume of the Rainier glaciers. At 3,500 ft in altitude, its terminus is the lowest of any in the conterminous States. The Nisqually Glacier, a glacier more commonly viewed by the public, has a surface area of 49.7 million ft2, whereas the Emmons has the largest surface area, at 120.2 million ft2. Figures 9 and 10 show ice areas by drainage as a function of altitude and ice volumes for radar-measured glaciers, respectively. Figure 11 shows measured ice areas at the indicated thickness intervals. Plate l is a map showing 1981 snow and ice boundaries and basal contours for the measured glaciers. Plate 2 shows the isopach maps derived from the surface-basal mapping of measured glaciers.
TABLE 2.—Areas and volumes of glacier ice and snow on Mount Rainier
[Methods of determination: A, volume estimated by using area correlation; B, volume estimated with calculation of basal shear stress; M, glacier thickness measured by ice radar. Because total glacier areas are required in the application of both volume estimation methods, volumes are available by total glacier. Area measured in ft2 (x 106); volume measured in ft3(x 109).—in the area column means no ice or snow present for glacier at that elevation, and in the volume column it means volume by elevation not determined for that glacier]
| Altitude Interval |
||||||||||||
| Drainage Area |
Glacier or Snow patch |
3,000-6,000' | 6,000-9,000' | 9,000-12,000' | 12,000-14,410' | Area total |
Volume total |
Method of determination | ||||
| Area | Volume | Area | Volume | Area | Volume | Area | Volume | |||||
| Cowlitz River | Snow patches | 2.5 | -- | 11 | -- | 0.5 | -- | 0.02 | -- | 14.0 | 0.7 | A |
| Whitman | -- | -- | 19.0 | -- | 4.8 | -- | -- | -- | 23.8 | 4.4 | B | |
| Ingraham | 3.56 | -- | 18.8 | -- | 16.6 | -- | 3.6 | -- | 42.6 | 7.0 | B | |
| Cowlitz | 4.5 | -- | 21.3 | -- | 11.0 | -- | -- | -- | 36.8 | 6.0 | B | |
| Paradise | -- | -- | 10.9 | -- | -- | -- | -- | -- | 10.9 | .8 | A | |
| Ohanapecosh | .3 | -- | 17.0 | -- | -- | -- | -- | -- | 17.3 | 1.3 | A | |
| Subtotal | 10.9 | -- | 98.0 | -- | 32.9 | -- | 3.6 | -- | 145.4 | 20.2 | ||
| Nisqually River | Snow patches | -- | -- | 7.4 | -- | .5 | -- | .4 | -- | 8.3 | .3 | A |
| Muir Snowfield | -- | -- | 2.8 | -- | 7.3 | -- | -- | -- | 10.1 | .7 | A | |
| Nisqually | 5.7 | 1.4 | 20 | 3.5 | 12.4 | 1.4 | 11.6 | 1.5 | 49.7 | 7.8 | M | |
| Wilson | -- | -- | 10.8 | 1.6 | 4.7 | .3 | -- | -- | 15.5 | 1.9 | M | |
| Kautz | -- | -- | 6.4 | -- | 5.7 | -- | .3 | -- | 12.4 | 1.3 | A | |
| Success | -- | -- | 3.6 | -- | 3.8 | -- | -- | -- | 7.4 | .5 | A | |
| Van Trump | -- | -- | 5.6 | -- | 1.1 | -- | -- | -- | 6.7 | .5 | A | |
| Pyramid | -- | -- | 5.6 | -- | .2 | -- | -- | -- | 5.8 | .4 | A | |
| S. Tahoma | 2.6 | -- | 19.5 | -- | 8.1 | -- | .2 | -- | 30.4 | 4.6 | B | |
| Tahoma | 3.6 | .4 | 18.2 | 2.9 | 5.0 | .5 | 5.3 | .5 | 32.1 | 4.3 | M | |
| Subtotal | 11.9 | 99.9 | 48.8 | 17.8 | -- | 178.4 | 22.3 | |||||
| Puyallup River | Snow patches | -- | -- | 9.7 | -- | .2 | -- | -- | -- | 9.9 | .4 | A |
| Tahoma | 5.1 | 1.0 | 23.0 | 5.6 | 18.8 | 2.7 | 13.96 | 2.5 | 60.8 | 11.8 | M | |
| N. Mowich | 3.0 | -- | 48.3 | -- | 13.7 | -- | 1.4 | -- | 66.4 | 9.5 | A | |
| Liberty Cap | -- | -- | -- | -- | .4 | -- | 1.3 | -- | 1.7 | .1 | A | |
| Flett | -- | -- | 3.2 | -- | -- | -- | -- | -- | 3.2 | .2 | A | |
| Edmonds | -- | -- | 11.3 | -- | 3.7 | -- | - | -- | 15.0 | 1.1 | A | |
| S. Mowich | .8 | -- | 16.4 | -- | 19.5 | -- | 1.7 | -- | 38.4 | 4.5 | B,A | |
| Puyallup | 1.1 | -- | 38.2 | -- | 13.6 | -- | 1.9 | -- | 54.8 | 10.2 | B | |
| Subtotal | 10.0 - 150.1 | -- | 69.9 | -- | 20.2 | -- | 250.2 | 37.8 | ||||
| Carbon River | Snow patches | .3 | -- | 9.2 | -- | -- | -- | -- | -- | 9.5 | .5 | A |
| Carbon | 26.6 | 11.4 | 46.1 | 12.6 | 9.4 | .8 | 3.1 | .2 | 85.2 | 25.1 | M | |
| Russell | -- | -- | 33.2 | 3.0 | 2.3 | .1 | -- | -- | 35.5 | 3.1 | M | |
| Subtotal | 26.9 | -- | 88.5 | -- | 11.7 | -- | 3.1 | -- | 130.2 | 28.7 | ||
| White River | Snow patches .9 | -- | 16.6 | -- | 1.1 | -- | -- | -- | 18.6 | 1.0 | A | |
| Winthrop | 18.5 | 3.6 | 44.3 | 9.7 | 23.7 | 3.4 | 11.6 | 1.8 | 98.1 | 18.5 | M | |
| Emmons | 16.4 | 6.1 | 55.7 | 11.8 | 39.4 | 4.9 | 8.7 | .9 | 120.2 | 23.8 | M | |
| Inter | -- | -- | 7.4 | -- | 1.0 | -- | -- | -- | 8.4 | .6 | A | |
| Fryingpan | 32.4 | -- | 2.8 | -- | -- | -- | -- | -- | 35.2 | 2.9 | A | |
| Sarvent | .1 | -- | 6.1 | -- | -- | -- | -- | -- | 6.2 | .4 | A | |
| Subtotal | 68.3 | -- | 132.9 | -- | 65.2 | -- | 20.3 | -- | 286.7 | 47.2 | ||
| Total | 128.0 | 569.4 | 228.5 | 65.0 | 990.9 156.2 | |||||||

|
| FIGURE 9.—Areas of ice and snow in Mount Rainier glacier drainage basins as a function of altitude. Drainage basins listed are as follows: Carbon (Ca), White River (W), Cowlitz (Co), Nisqually (N), and Puyallup (P). |
|
| FIGURE 10.—Ice volume of measured Mount Rainier glaciers as a function of altitude. Glaciers listed are as follows: Carbon (Ca), Emmons (E), Nisqually (N), Tahoma (T), Winthrop (W), Wilson (Wn), and Russell (R). |
|
| FIGURE 11.—Areas of selected thickness intervals of radar-measured glaciers of Mount Rainier. Values are derived from isopach maps. (click on image for an enlargement in a new window) |
The interaction between glacial and volcanic activity predates the existing volcano form. Glacial till estimated to be as much as 600,00 years B.P. is covered by more recent intracanyon lava flows (Crandell and Miller, 1974, p. 17). More recently, the melting of ice and snow has in part been responsible for mudflows which extended to Enumclaw 6,000 years B.P. and to Orting about 500 years B.P (Crandell and Mullineaux, 1981, p. 14). Figure 9 illustrates that 50 percent of snow and ice on the mountain is between altitudes of 6,000 and 9,000 feet; 30 percent is above 9,000 feet.
Lahars are mudflows and debris flows of volcanic material derived from the slope of a volcano and sometimes mobilized with melting snow and ice. They occur most often during periods of eruption, and, at Mount Rainier, they have occurred most frequently during historic times in the valleys of the White, Nisqually, and Mowich Rivers, and in Tahoma and Kautz Creeks. Lahars from Mount Rainier constitute the major threat to people and property during volcanic eruptions (Crandell, 1971, p. 69).
The summit depression contains two craters and is approximately the region above 12,000 ft. The region has an ice volume of 8.7 billion ft3. The tilt of the principal eastern crater toward the east indicates that this may be the first direction that meltwater in the center might flow. In such a situation, the Cowlitz, Ingraham, Emmons, and Winthrop Glaciers would be most affected; lahars and floods in the valleys of the Cowlitz and Whiter Rivers might result. The volumes of ice and snow are 20.2 billion ft3 in the Cowlitz River and 47.2 billion ft3 in the White River drainage areas. Further descriptions of Mount Rainier eruptive hazards are found in a publication by Crandell and Mullineaux (1981).
| <<< Previous | <<< Contents >>> | Next >>> |
pp/1365/sec3.htm
Last Updated: 28-Mar-2006