
|
Geological Survey Professional Paper 1365
Ice Volumes on Cascade Volcanoes: Mount Rainier, Mount Hood, and Mount Shasta |
DETERMINATION OF VOLUMES
MEASURED GLACIERS
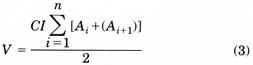
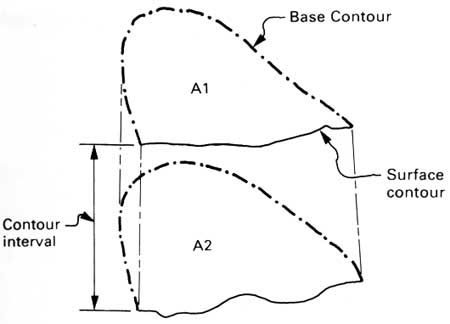
Glacier volumes were found by determining the area between each set of bedrock and surface contours, a pair of which define a volume element (fig. 7). Areas were measured with a planimeter or a digitizer to within 3 percent accuracy and were completed for the length of the glacier. Volumes (V) of each glacier were determined by using the volume-element areas in equation 3, where A1 is the area bounded by equally valued basal and surface contours at a given altitude and CI is the contour interval.
|
| FIGURE 7.—Sketch showing one volume element, which, constructed over the length of the glacier, permits calculation of volume on the measured glaciers. Each element consists of two horizontal planes (A1 and A2) that are formed by surface and basal contours separated by the contour interval (Kennard, 1983). |
The contour interval used was 200 feet on Mount Rainier and 100 feet on Mounts Hood and Shasta and the Three Sisters.
Glacier volumes were calculated by drainage area and altitude. Values for each drainage area, by mountain, are listed in tables 2 through 5. The percentage of the total ice and snow volume measured by radar varied for each mountain as follows: 62 on Mount Rainier, 83 on Mount Hood, 53 on the Three Sisters, and 19 percent on Mount Shasta.
The error in calculating volume varied with each glacier, depending on the number of measurement points per glacier. Error in snow patch and ice boundary corrections was estimated at 5 percent, and error from the original topographic maps was less than 5 percent. A conservative estimate for error in the volume of measured glaciers is ±20 percent.
UNMEASURED GLACIERS AND SNOW PATCHES
Several different approaches have been made for estimating the volume or average thickness of unmeasured glaciers. For instance, Post and others (1971, p. 4) related average thickness to area size classes, using several measured glaciers for calibration. Kotliakov (1980) also incorporated the type of glacier in a similar scheme. Brückl (1973), Müller (1976, p. 12), Shih and others (1981, p. 194), Zhuravlev (1980), and Macheret and Zhuravlev (1982, p. 310) utilized an empirical relation of the form
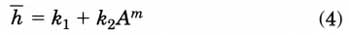
where  is
the mean glacier thickness, k1, k2, and
m are coefficients derived from regression analysis, A is
the glacier area, and m ~0.5.
is
the mean glacier thickness, k1, k2, and
m are coefficients derived from regression analysis, A is
the glacier area, and m ~0.5.
Paterson (1970, p. 43) proposed that the shear stress on the bed be treated as a constant. For a simple, infinitely wide glacier with laminar flow, the shear stress on the bed τ is

where ρ is the ice density, g the acceleration of gravity, h the ice thickness, and α the surface slope (Nye, 1952, p. 529). Thus, mean thickness can be calculated from the relation
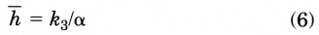
where α is the surface slope and k3 includes the assumed shear stress as well as ice density and geometric variables. However, none of these relations have been tested on glaciers of the type occurring on Cascade volcanoes.
Because glacier characteristics are related to latitude and climatic conditions, it was necessary to develop a volume estimation method for use in the Cascade Range. The volumes of unmeasured glaciers were estimated from statistical analysis of characteristics for all measured glaciers except the Whitney, which was examined during later study (Kennard, 1983). The variables required for these volume estimations can be determined from topographic maps and aerial photographs.
Paterson's assumption of a constant basal shear stress, which is equivalent to the assumption that glacier flow can be treated by plasticity theory (Nye, 1951, p. 554), was tested by comparing shear stress (eq. 5) with other glacier characteristics. It was found that the larger glaciers had shear stress values in the expected range of 1<τ<2 bars. However, the smaller glaciers had lower values of shear stress, ranging down almost to zero.
It would appear that some glaciers reach a critical basal shear stress, and for these glaciers, the flow is sufficiently fast to adjust the longitudinal profile to a dynamic equilibrium so that the product of thickness and surface slope is related to that stress. Other glaciers are too small to reach that critical shear stress, and their profiles are determined less by dynamic considerations than by local variations in snow drifting and melting. In an analysis of the measured glaciers (table 1), it was found that most glaciers having a length greater than 8,500 ft obtained a critical shear stress, and most glaciers having a length less than this did not. It was also found that an estimated basal shear stress τ* in pounds per square foot for the larger glaciers could be calculated by the empirical relation
TABLE 1.—Table showing glacier lengths, mean glacier basal shear stresses calculated at 1,000-foot intervals, and assignment of a method giving the closest correlation with the glacier's measured volume, where A indicates a closer correlation with area and B indicates a closer correlation using a basal shear stress
| Measured glacier |
Correlation group |
Basal shear stress, in bars |
Map length of glacier, in thousands of feet |
| Emmons | B | 1.6 | 23.5 |
| Winthrop | B | 1.4 | 26.5 |
| Tahoma | B | 1.4 | 24.3 |
| Carbon | B | 1.3 | 31.9 |
| Nisqually | B | 1.4 | 21.7 |
| Eliot | B | 1.4 | 13.1 |
| Wilson | B | 1.2 | 8.5 |
| Coe | B | 1.3 | 10.7 |
| Whitney | A | 0.5 | 9.2 |
| Russell | A | 0.7 | 7.8 |
| Newton-Clark | A | 0.5 | 6.7 |
| Sandy | A | 0.7 | 6.4 |
| Collier | A | 0.3 | 6.9 |
| Prouty | A | 0.5 | 5.1 |
| Ladd | A | 0.8 | 6.6 |
| Reid | A | 0.7 | 6.4 |
| Zigzag | A | 0.6 | 8.0 |
| Hayden | A | 0.6 | 4.3 |
| Diller | A | 0.5 | 3.9 |
| White River | A | 0.4 | 6.1 |
| Lost Creek | A | 0.4 | 4.7 |
| Langille | A | 0.6 | 4.8 |
| Palmer | A | 0.6 | 1.4 |
| Coalman | A | 0.6 | 1.6 |
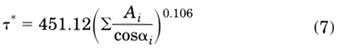
where ΣAi in feet squared is the sum of surface area at 1,000-foot altitude intervals. Noting that volume V = Ah, the estimated volume V* in cubic feet can be calculated by using the estimated shear stress τ* according to

where area and slope were measured at 1,000-foot intervals and then summed.
Small glaciers, those that do not obtain the critical shear stress, were generally those less than 8,500 ft in length (Kennard, 1983). The empirical relationship is

where V equals volume in cubic feet of the total glacier and A equals total area in square feet. The Whitney Glacier on Mount Shasta, though measured by ice radar, is on the border of having a closer area correlation than a basal shear stress correlation. Its length is 9,200 ft but its shear stress is only 0.5 bars. Perhaps this may be explained by the presence of a substantial icefall around 11,800 ft that interrupts the normal glacier flow, essentially making it into two smaller glaciers. Some glaciers do not occupy discrete valley basins and their bedrock topography divides the glacier area into separate units. These should be treated separately for area determination and the results should be summed. Therefore, an experienced eye and much discretion are required in the application of and selection of a method for determining ice volume.
When the estimation methods were developed they were tested by application to glaciers with measured volumes. The standard deviations of errors of estimated and measured volumes were as follows: 5 percent for large glaciers (with volumes found by using equations 6 and 7), 16 percent for small glaciers (using equation 8), and 13 percent for the groups together. Together with a ±20 percent uncertainty in finding measured glacier volumes, the error in using the estimation method is assumed to be about ±25 percent.
| <<< Previous | <<< Contents >>> | Next >>> |
pp/1365/sec2.htm
Last Updated: 28-Mar-2006