
|
Geological Survey Professional Paper 669
The Colorado River Region and John Wesley Powell |
RESPONSE OF A RIVER IN A ROCK CANYON
The question examined here is the extent to which confinement in a rock canyon alters the usual response of a river to the mechanical laws. Are the pools and rapids of a river in a great canyon analogous to the pools and riffles of a small trout stream, or are they of a different origin and nature? The question might best be approached by first describing the nature of the pools or flat reaches and the various kinds of rapids in the Grand Canyon.
Until the U.S. Geological Survey expedition down the Grand Canyon in 1965, there existed no measurements of water depth in any great canyon of the world except at isolated cross sections where a cable has been constructed for water-flow measurements or where a dam or bridge has been constructed. No continuous profile of any canyon riverbed had ever been taken. One reason for this is that a reliable depth measurement cannot be obtained in a swift current by sounding with a lead weight attached to a line. Where the water is deep the weight is swept downstream, and a vertical measurement is impossible. The modern sonic sounder is the only practical way of measuring depth. Such instruments, now widely used in boats, large and small, measure the length of time required for an energy pulse to reach the bed and return upward to the boat. This time lag is automatically converted into depth in feet. Even the sonic equipment fails at times to work satisfactorily in fast rapids, for reasons not known. I presume that air bubbles under the energy-transmitting transducer interrupt the signal.
A recording sounder like those used in oceangoing hydrographic vessels is of no use in a river because the boat proceeds downstream at a varying speed, so that the location at any particular moment must be separately determined. The simple scheme we have used requires merely that aerial photographs be taken beforehand. The photographs are printed on semi-matte paper in an unbroken roll, so that as the party progresses downstream, the pictures are unrolled successively. One man reads the depth dial and calls out the depth at about 5-second intervals. Another keeps collating the aerial photograph with identifiable features of the canyon, so that he knows where the boat is at any moment. He writes the depth directly on the photograph at the boat location. In the Grand Canyon and associated canyons of the Colorado River, these measurements were made through about 500 miles of river distance and totaled more than 6,000 separate readings of water depth.
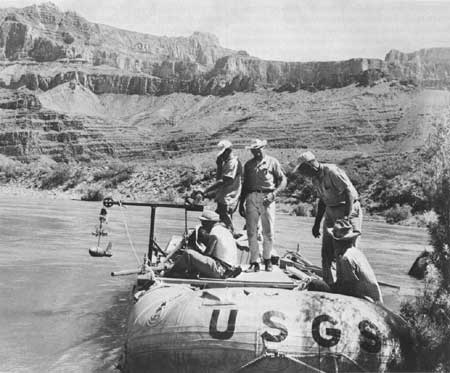
In addition to the large number of depth readings made by echo sounding, a few cross sections were measured with a 100-pound lead weight in connection with current-meter measurements of water velocity (fig. 86).
|
| FIGURE 86.—Flow-measurement gear being readied for observations of velocity and depth. The 100-pound weight hangs below the current meter from a cable on the winch. |
The water-depth data discussed here were measured in June 1965, before the bypass tunnels at Glen Canyon Dam were closed. They represent, therefore, the conditions in the Grand Canyon essentially unaltered by major dams, though many dams were in operation in upper tributaries. The flow at the time of these measurements was 48,500 cfs (cubic feet per second) at Lees Ferry, though some losses occurred to bank storage, making the discharge decrease slightly downstream.
In order to get a broad picture of the Colorado River channel at this flow, the median values of width and depth in lower Marble Canyon and middle Granite Gorge (mile 113 to mile 149) were 220 feet and 40 feet. The average velocity for these dimensions is computed to be 6.2 fps (feet per second) or 4.2 mph (miles per hour). The mean velocity through the rapids was generally 11 to 15 fps, or 7.5 to 10 mph.
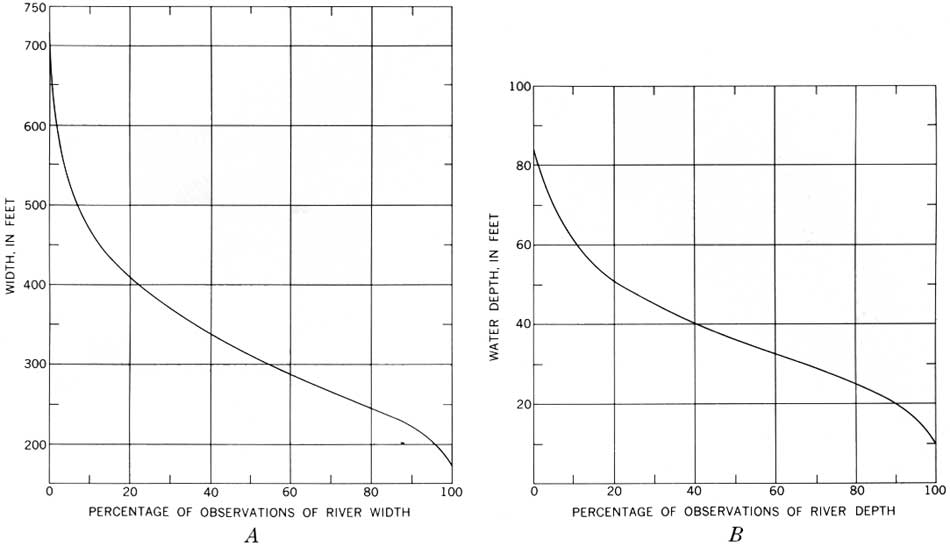
The range of values of width and depth for selected river segments is shown in figure 87. The depth data represent values taken at 1/10-mile intervals in the first 139 miles below Lees Ferry, when the discharge was 48,500 cfs. The width data are measured from aerial photographs taken in the spring of 1965. The maximum depth measured in the Grand Canyon was 110 feet at mile 114.3.
|
| FIGURE 87.—Data on width and depth of Colorado River in Grand Canyon presented as smoothed frequency-distribution graphs. A, River widths. The graph shows, for example, that 20 percent of the width observations equaled or exceeded 410 feet, and that 50 percent of the observations equaled or exceeded 320 feet. Widths were measured at 1/10-mile intervals from aerial photographs of an 82-mile segment from mile 28 to mile 110 (miles measured as distances below Lees Ferry, Ariz.). B, River depth. The graph shows that 20 percent of the depth observations equaled or exceeded 51 feet, and that 50 percent of the observations equaled or exceeded 36 feet. Data represent values at 1/10-mile intervals in the 139 miles below Lees Ferry. (click on image for an enlargement in a new window) |
The river flows alternately in long, relatively smooth pools and short, steep, and violent rapids (fig. 88). What constitutes a rapid is a matter of definition, but there are 93 steep reaches of various lengths between Lees Ferry and middle Granite Gorge, a distance of about 150 miles. In this reach, rapids average about 1.6 miles apart.

|
| FIGURE 88.—Hance Rapids, caused principally by the debris cone from a tributary entering on the left bank. |
The water-surface gradient in the pools is less than 2 feet per thousand (0.002) and typically is about 5 feet in 10,000 (0.0005). In the rapids, on the other hand, the water surface falls from 5 to 17 feet per thousand (0.005-0.017). For example, in Badger Creek Rapids, the water surface falls 14 feet in 860 feet. The surface velocity above the rapids was measured at 7.0 fps and in the rapids, 11.0 fps, when the discharge was 48,500 cfs.
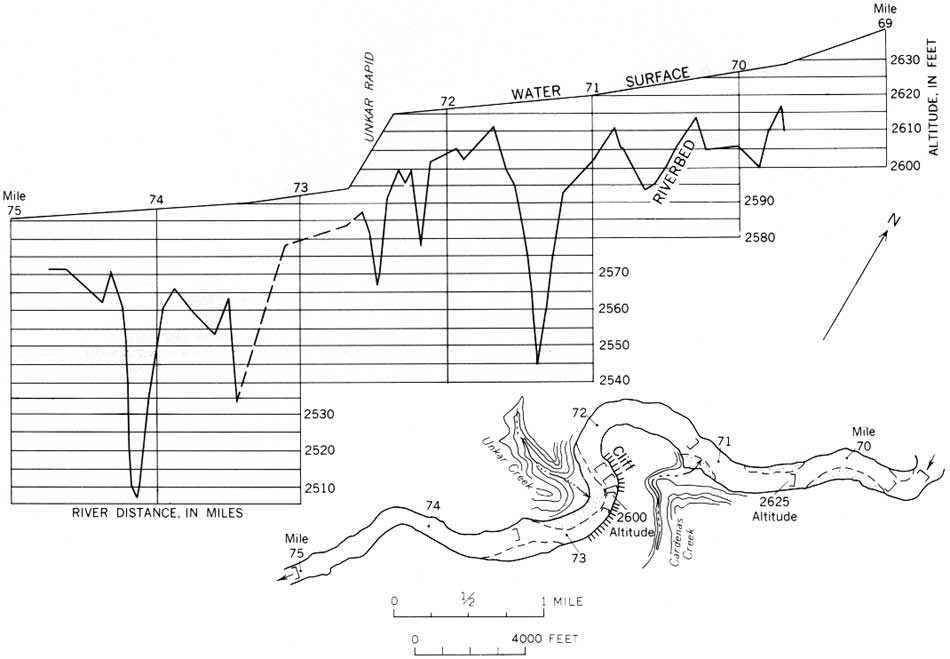
These figures may be made more meaningful by inspection of the profile of water surface and bed through part of Marble Canyon (fig. 89). The profile represents 6 miles of river and includes the rapids near the mouth of Unkar Creek. Upstream and down are pool reaches of relatively flat gradient (fig. 90).
|
| FIGURE 89.—Profile of water surface and riverbed in a 6-mile segment of the Grand Canyon near Unkar Rapid. Below is a sketch map of same reach showing position of 5-foot contours on the water surface and the location of mile points below Lees Ferry. (click on image for an enlargement in a new window) |
|
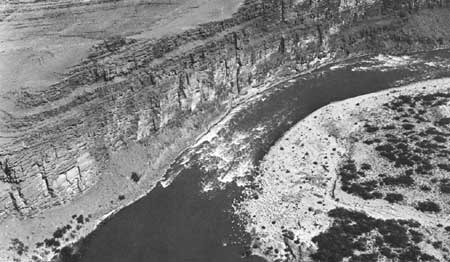
| FIGURE 90.—Looking downstream at Unkar Rapid, which was caused by tributary fan forcing river against cliff on the left bank. |
The first impression transmitted by such a profile is the large variation in water depth. In the pool reach from mile 71 to Unkar Rapid, through which the water-surface slope remains essentially constant at 0.0008 foot per foot, the variation in water depth ranged from 6 to 74 feet, a change which occurred within a distance of 0.3 mile. The median value was 20 feet. Two-thirds of the individual readings were in the depth range from 13 to 30 feet.
The data suggest that long pools having low water-surface gradients tend to be deeper than other parts of the river. Nearly every rapid includes an unusually shallow section, but not all equally shallow places are a high-gradient rapid. Also, some deep holes occur in the rapids, but these generally are at or near the foot.
| <<< Previous | <<< Contents >>> | Next >>> |
pp/669/secd4.htm
Last Updated: 22-Jun-2006