
|
Geological Survey Professional Paper 715—A
Combined Ice and Water Balances of Gulkana and Wolverine Glaciers, Alaska, and South Cascade Glacier, Washington, 1965 and 1966 Hydrologic Years |
1965 HYDROLOGIC YEAR
SOUTH CASCADE GLACIER
Field Program
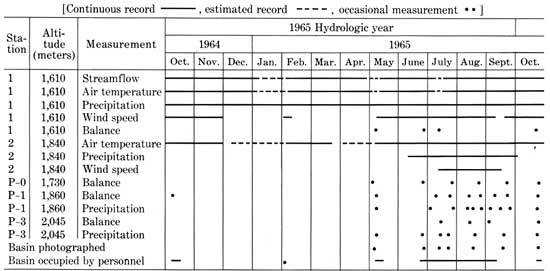
Most of the instrumentation needed for measurements of ice and water balance had been installed by January 1, 1965, the beginning of the IHD. As a consequence, nearly complete records of streamflow at the outlet of the drainage basin, air temperature at two locations, and precipitation catch in a gage at one location were obtained for the 1965 hydrologic year (table 1). Ice-balance, wind-speed, and additional precipitation data were obtained during the summer months.
TABLE 1.—Instrumentation at South Cascade Glacier during the 1965 hydrologic year
Instrument locations together with selected snowline
positions are shown on plate 3A. The distribution of snow cover
over the basin and the late-winter snow balance,  m(s), were measured on May 12, 1965
(pl. 3B), just 15 days before the time of maximum balance. The
minimum-balance condition was reached on November 2, 1965
(t1'; pl. 3C).
m(s), were measured on May 12, 1965
(pl. 3B), just 15 days before the time of maximum balance. The
minimum-balance condition was reached on November 2, 1965
(t1'; pl. 3C).
Climate
The weather in the North Cascades during the 1965 hydrologic year was marked by slightly above average winter snowfall, a cool spring, and a warm autumn (pl. 3D, 1st and 2d graphs). Except for part of June the summer was cloudier but had less precipitation than average. The accumulation season at South Cascade Glacier continued until almost the end of May, and short periods of snow accumulation occurred every month except July (pl. 3D, 1st graph). The mean winter air temperature was -2.97°C, the mean summer temperature +7.3°C, and annual mean temperature +1.3°C.
Ice Balance
Unusually small basin-storage changes occurred during October and November of 1964, as shown by the hydrologic-balance curve (pl. 3D, 3d graph). The near zero balance until November 22 was due to the mild temperatures and low snow accumulation during these two months. Such subtle, seemingly minor climatic aberrancies during the normal accumulation period can significantly alter the ultimate glacier balance.
Table 2 gives snow, ice, and water balances and
related values for the South Cascade Glacier during the 1965 hydrologic
and balance years. The standard error for each measurement is shown
adjacent to each parameter value and is based on calculations of the
reliability of the field measurement. For some parameters the standard
error is estimated. For example, runoff,  a, is measured only for the entire drainage
basin, but a value for the glacier alone can be derived on the basis of
annual ablation,
a, is measured only for the entire drainage
basin, but a value for the glacier alone can be derived on the basis of
annual ablation,  a, and measured precipitation as rain,
pa(r). The much larger standard error for glacier
runoff is then estimated in accordance with ablation errors and errors
arising from an approximation of liquid precipitation runoff from the
glacier.
a, and measured precipitation as rain,
pa(r). The much larger standard error for glacier
runoff is then estimated in accordance with ablation errors and errors
arising from an approximation of liquid precipitation runoff from the
glacier.
TABLE 2—Snow, ice, and water balances, South Cascade Glacier, 1965 hydrologic and balance years
[Parameter values and errors in meters except where indicated, Date: Hydrologic year, Oct. 1, 1965 (t0), to Sept. 30, 1966 (t1)]
| Glacier |
Basin |
Date | Term | Explanation | |||
| Value | Error | Value | Error | ||||
Parameters for annual mass balance | |||||||
| a |
0.07 | 0.10 | 0.04 | 0.18 | Hydrologic year | Annual balance | Net change in glacier mass from t0 to t1; approximately equal to the difference between precipitation as snow and melt-water runoff for one hydrologic year. |
| n |
-.17 | .12 | -.09 | .10 | Nov. 1, 1965 (t0') to Nov. 2, 1965 (t1'). | Total mass net balance | Net change in mass from (t0') to (t1'); change in mass during one balance year. |
| n(fi) |
-.19 | .13 | -.10 | .10 | Nov. 22, 1964 (t0'') to Nov. 22, 1965 (t1''). | Firn and ice net balance | Change in mass of old firn and ice during a single melt season; the mass between two consecutive summer surfaces. |
Parameters relating annual and net mass balance | |||||||
| 0 |
0.03 | 0.01 | 0.02 | 0.01 | Oct. 1 to Nov. 1, 1964 | Initial balance increment | Balance change between first time of minimum balance (t0') and t0; relates balance-year quantities to hydrologic-year quantities. |
| 0(s) |
.03 | .02 | Oct. 1, 1964 | Initial snow balance | New snow accumulated on summer surface (ss0) at t0. | ||
| 0(i) |
-.08 | .05 | -.04 | .05 | Oct. 1 to Nov. 21, 1964 | Initial ice balance | Ice melt in the ablation area after t0 and before ice melt begins the following spring; measured by ablation stakes. |
| 1(s) |
0 | 0 | Final snow balance | New snow accumulated on summer surface (ss1) at t1. | |||
| a(i) |
-.60 | .05 | -.30 | .10 | Hydrologic year | Annual ice balance | Ice and firn melt in the ablation area for the hydrologic year. |
| n(f) |
.60 | .08 | .30 | .15 | Nov. 22, 1965 | Net firnification | The increment of new firn in the accumulation area at t1''; measured after ablation ceases in the autumn. |
Parameters for snow accumulation and ablation | |||||||
| x |
3.67 | 0.18 | 2.48 | 0.20 | May 27, 1965 | Maximum balance | Maximum value of the balance (in relation to balance at t0) for the hydrologic year, similar to the "winter balance" or the "apparent accumulation." |
| m(s) |
3.48 | .15 | 2.40 | .20 | May 12, 1965 | Later-winter snow balance | Balance measured to the summer surface (ss0) in late winter or spring; measured in pits or by probing. |
 a a |
4.00 | .18 | 2.66 | .25 | Hydrologic year | Annual accumulation | Accumulation of snow between t0 and t1. |
| a |
-3.93 | .20 | -2.62 | .20 | do | Annual ablation | Ablation of snow, ice, and firn between t0 and t1. |
Parameters for glacier dimensions | |||||||
| S | 12.90 | 0.04 | 6.11 | 0.02 | Area | ||
| AAR | 2.53 | 2.03 | 2.30 | 2.05 | Sept. 30, 1965 | Accumulation-area ratio | A rough index of annual balance, measured at time t1, neglecting new snow overlying ss1. |
| ELA | 1880 | 20 | do | Equilibrium-line altitude | Do. | ||
| δL | -12 | 3 | Hydrologic year | Advance or retreat | Average horizontal-distance change of terminus in direction of glacier flow. | ||
Parameters for water balances | |||||||
| pa | 2.06 | 0.50 | Hydrologic year | Measured annual precipitation | Value measured with a gage at one point. | ||
| pa(r) | .33 | .05 | do | Measured annual precipitation as rain | Do. | ||
| pa* | 4.25 | 0.30 | 3.43 | .30 | do | Calculated annual precipitation | Calculated average for glacier or basin, using annual basin runoff and balance. |
| a |
4.32 | .28 | 3.39 | .10 | do | Measured annual runoff | |
1Glacier area in km2, is larger than previously published value because small connected snow and ice areas are included with the trunk glacier in this report. 2Dimensionless. | |||||||
The maximum balance, x, was 3.67 m averaged over the glacier, or
2.48 m averaged over the drainage basin (table 2). This is a measure of
the maximum water-equivalent depth of seasonal snow reached in late
winter or early spring, a quantity which has been referred to as the
apparent accumulation (Meier, 1962) or erroneously referred to as just
the accumulation. The annual accumulation, a, on the glacier was 4.00 m. The
maximum balance was reached on May 27, 1965, 15 days after detailed
measurements were made of the late-winter balance,
bm(s), shown on plate 3B. Balance change
between May 12 and May 27, 1965, was estimated on the basis of recorded
precipitation, air temperature, and runoff. For May 12, 1965, the
measured snowpack density, in megagrams per cubic meter, was 0.495 on
the glacier (P-1, alt 1,860 m) and 0.523 off the glacier (site 1, alt
1,610 m).
The late-winter balance, bm(s), net balance, bn, and the summer change in storage, bn—bm(s), are shown as functions of altitude on plate 3E. Note that all three curves become more negative at the highest altitudes. This is presumably due to wind removal of snow and accounts for the patches of bare ice exposed at high altitudes. The balance curves for the basin are near zero at the altitude of South Cascade Lake because the lake (0.24 km2 or 4 percent of the basin area) is incapable of supporting a load of snow except for a small area close to the shore. As snow accumulates on the lake during the winter, it displaces water that runs off directly.
The total mass net balance, n, or change in ice storage was
-0.17 m averaged over the glacier and occurred between the minimum
balances on November 1, 1964, and November 2, 1965 (table 2). The
equivalent 1958-64 average net balance was -0.60 m. Factors tending to
produce a less negative balance were the above-average winter snowpack,
the late spring, and the summer snowfalls. The low altitude of the
previous year's snowline was a significant factor in reducing ice melt
in July. Large areas of ice are usually exposed in July and undergo
heavy ablation owing to the low albedo of ice and to the intense
midsummer radiation. The high albedo 1964 firn covering much of the ice
area significantly reduced the total ice melt during the summer.
Ablation continued throughout October and caused a net change in basin
storage of -4 mm/day during that month. This was an anomalous condition,
since the ablation season usually ends shortly after October 1. The
result was a positive annual balance of 0.07 m on September 30 and a
negative net balance on November 2 (pl. 3D, 3d graph). On the
glacier, the standard error of the net balance was about 0.12 m and the
error in the annual balance about 0.10 m.
Precipitation
One recording precipitation gage is in continuous operation in this drainage basin (site 1, alt 1,610 m, pl. 3D, 1st graph). Because of its low altitude and the inherent inaccuracy of precipitation gages in mountainous areas, however, this gage is considered only an index of the average basin precipitation.
An estimate of the total basin precipitation is made by treating the entire basin as a large gage where annual precipitation equals annual runoff plus annual storage changes plus net evaporation, or
 a* = a + a +
where pa* = calculated precipitation,
a =
measured annual runoff, a = measured annual balance, and = net evaporation-condensation
balance. We assume that is
negligible compared to the other terms; measurements with lysimeters on
the glacier in past years have shown that evaporation and condensation
on snow are nearly equal and tend to cancel each other out. Net
evapotranspiration undoubtedly occurs over the small part of the basin
which is vegetated or becomes bare of snow for a small part of each
year. This water loss is difficult to estimate but must be of the order
of a few millimeters averaged over the whole drainage basin for a whole
year. Assuming zero net evaporation, the calculated basin precipitation
is 3.43 m.
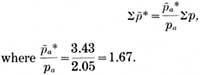
Cumulative basin precipitation, σ* (pl. 3D, 3d
graph), is calculated by multiplying cumulative precipitation recorded
at the gage since t0, σp, by a ratio of
the calculated annual basin precipitation, a*, divided by the
annual gage precipitation, pa:
Hydrologic Balance
An estimation of the daily basin balance (here
designated as the hydrologic balance; see pl. 3D, 3d graph) can
be made by subtracting cumulative runoff from cumulative basin
precipitation. The standard error of the hydrologic balance curve is
large (over 10 percent) because of the large basin-precipitation error.
An independent check of the calculated hydrologic balance against the
measured maximum late-winter balance on May 27 shows a difference of 7
percent (hydrologic balance = 2.31 m, x = 2.48 m).
| <<< Previous | <<< Contents >>> | Next >>> |
pp/715-A/sec4.htm
Last Updated: 28-Mar-2006