
|
Geological Survey Professional Paper 715—A
Combined Ice and Water Balances of Gulkana and Wolverine Glaciers, Alaska, and South Cascade Glacier, Washington, 1965 and 1966 Hydrologic Years |
1966 HYDROLOGIC YEAR
SOUTH CASCADE GLACIER
Field Program
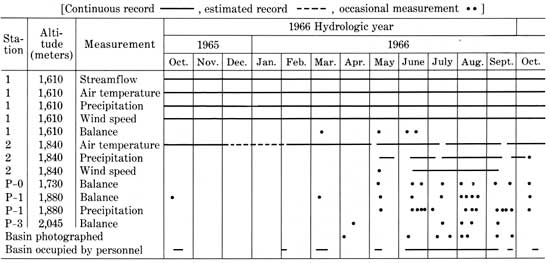
Instrumentation used in 1966 was virtually the same as in 1965, and the same sites were used (pl. 4A). Air temperature at two locations, wind speed, precipitation, and streamflow records are virtually complete for the whole hydrologic year (table 3). The distributions of snow and ice for late winter and for the end of the balance year are shown on plate 4B and C.
TABLE 3.—Instrumentation at South Cascade Glacier during the 1966 hydrologic year
Climate
The climate in the North Cascades during the 1966 hydrologic year was characterized by below-average amounts of precipitation, particularly during the winter season, and by above-average temperatures (pl. 4D, 1st and 2d graphs). In June and July, however, temperatures were below normal and precipitation was slightly above average. Snow fell at altitudes above 1,800 m on several occasions in June. With the exception of March and June, high pressure dominated the weather pattern in the Pacific Northwest during the hydrologic year. The mean winter air temperature was -3.5°C, the mean summer temperature was +6.87deg;C, and the annual mean temperature was +0.8°C.
Ice Balance
The map of measured late-winter balance (pl.
4A) as of May 12, 1966, shows a typical pattern of snow
accumulation but less than normal amounts;  m(s) = 2.52 on the glacier and 1.82
on the whole drainage basin. At this time the snowpack density, in
megagrams per cubic meter, was 0.498 on the glacier (P-1) and 0.615 off
the glacier (site 1). The maximum balance, x, was attained on May 22; the
value for x
is less than that for m(s) because of considerable melting at the
beginning of the hydrologic year (table 4). The annual accumulation,
m(s) = 2.52 on the glacier and 1.82
on the whole drainage basin. At this time the snowpack density, in
megagrams per cubic meter, was 0.498 on the glacier (P-1) and 0.615 off
the glacier (site 1). The maximum balance, x, was attained on May 22; the
value for x
is less than that for m(s) because of considerable melting at the
beginning of the hydrologic year (table 4). The annual accumulation,
 a, was 2.59
m on the glacier or 1.99 m averaged over the drainage basin.
a, was 2.59
m on the glacier or 1.99 m averaged over the drainage basin.
TABLE 4.—Snow, ice, and water balances, South Cascade Glacier, 1966 hydrologic and balance years
[Parameter values and errors in meters except where indicated, Date: Hydrologic year, Oct. 1, 1965 (t0), to Sept. 30, 1966 (t1)]
| Glacier |
Basin |
Date | Term | Explanation | |||
| Value | Error | Value | Error | ||||
Parameters for annual mass balance | |||||||
| a |
-.094 | 0.10 | -0.45 | 0.12 | Hydrologic year | Annual balance | Net change in glacier mass from t0 to t1; approximately equal to the difference between precipitation as snow and melt-water runoff for one hydrologic year. |
| n |
-1.03 | .10 | -.50 | .12 | Nov. 3, 1965 (t0') to Oct. 16, 1966 (t1'). | Total mass net balance | Net change in mass from (t0') to (t1'); change in mass during one balance year. |
| n(fi) |
-1.07 | .10 | -.52 | .12 | Nov. 24, 1965 (t0'') to Nov. 5, 1966 (t1''). | Firn and ice net balance | Change in mass of old firn and ice during a single melt season; the mass between two consecutive summer surfaces. |
Parameters relating annual and net mass balance | |||||||
| 0 |
0.08 | 0.03 | 0.04 | 0.04 | Oct. 1 to Nov. 2, 1965 | Initial balance increment | Balance change between first time of minimum balance (t0') and t0; relates balance-year quantities to hydrologic year quantities. |
| 0(s) |
0 | 0 | Initial snow balance | New snow accumulated on summer surface (ss0) at t0. | |||
| 0(i) |
.20 | .05 | .10 | .05 | Oct. 1 to Nov. 23, 1965 | Initial ice balance | Ice melt in the ablation area after t0 and before ice melt begins the following spring; measured by ablation stakes. |
| 1(s) |
0 | 0 | Final snow balance | New snow accumulated on summer surface (ss1) at t1. | |||
| a(i) |
-1.03 | .08 | -.49 | .10 | Hydrologic year | Annual ice balance | Ice and firn melt in the ablation area for the hydrologic year. |
| n(f) |
.09 | .05 | .04 | .02 | Nov. 5, 1966 | Net firnification | The increment of new firn in the accumulation area at t1''; measured after ablation ceases in the autumn. |
Parameters for snow accumulation and ablation | |||||||
| x |
2.39 | 0.16 | 1.77 | 0.22 | May 22, 1966 | Maximum balance | Maximum value of the balance (in relation to balance at t0) for the hydrologic year, similar to the "winter balance" or the "apparent accumulation." |
| m(s) |
2.52 | .15 | 1.82 | .20 | May 12, 1966 | Later-winter snow balance | Balance measured to the summer surface (ss0) in late winter or spring; measured in pits or by probing. |
| a |
2.59 | .18 | 1.99 | .20 | Hydrologic year | Annual accumulation | Accumulation of snow between t0 and t1. |
 a a |
-3.53 | .20 | 2.44 | .20 | do | Annual ablation | Ablation of snow, ice, and firn between t0 and t1. |
Parameters for glacier dimensions | |||||||
| S | 12.84 | 0.04 | 6.11 | 0.02 | Area | ||
| AAR | 2.30 | 2.05 | 2.14 | 2.03 | Sept. 30, 1966 | Accumulation-area ratio | A rough index of annual balance, measured at time t1, neglecting new snow overlying ss1. |
| ELA | 2140 | 20 | do | Equilibrium-line altitude | Do. | ||
| δL | -16 | 3 | Hydrologic year | Advance or retreat | Average horizontal-distance change of terminus in direction of glacier flow. | ||
Parameters for water balances | |||||||
| pa | 1.77 | 0.35 | Hydrologic year | Measured annual precipitation | Value measured with a gage at one point. | ||
| pa(r) | .46 | .06 | do | Measured annual precipitation as rain | Do. | ||
| pa* | 3.09 | 0.33 | 2.80 | .22 | do | Calculated annual precipitation | Calculated average for glacier or basin, using annual basin runoff and balance. |
 a a |
4.02 | .30 | 3.25 | .15 | do | Measured annual runoff | |
1Square kilometers. 2Dimensionless. | |||||||
The map of total mass net balance, n (pl.
4C), shows the snow and ice cover on the basin at
t1', the date of minimum balance (Oct. 16, 1966). The
change in ice storage of the glacier during the 4-month period since May
22 is very large, amounting to over 3.5 m for the glacier and 2.3 m for
the total basin (pl. 4D, 3d graph). The basin-storage change
during this period represented about 70 percent of the total annual
basin run off, a (3.25 m). The remaining runoff during the
hydrologic year was due to precipitation as rain
(pa(r), 14 percent) and snow and ice melt between
October 1, 1965, and May 22, 1966 (16 percent).
The annual balance, a (-0.94 m on the glacier), was a slightly
greater loss in mass than the average since 1958. The annual loss in ice
storage in the basin contributed 13 percent of the annual runoff from
the basin and about 23 percent of the runoff from the total glacierized
area. The greater-than-average loss in mass can be attributed to both
the deficient winter snowpack, which resulted in an early exposure of
glacier ice, and the warmer-than-average ablation season. This loss of
mass eliminated most of the winter snow on the glacier except at the
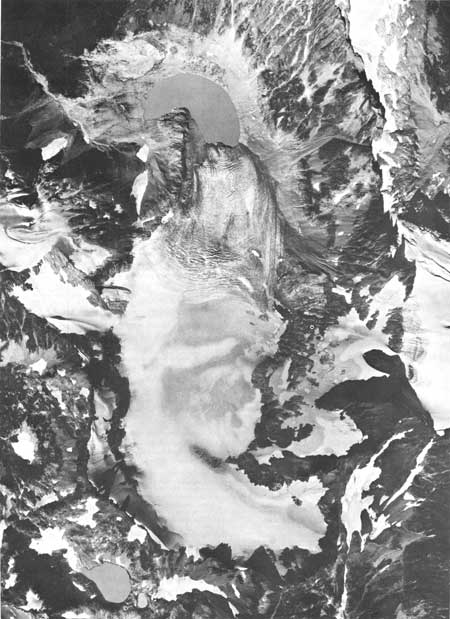
very highest altitudes (pl. 4E and fig. 7).
|
| FIGURE 7.—Vertical air photograph of South Cascade Glacier and basin on September 22, 1966, The thin veneer of snow remaining on the glacier at this time is rapidly disappearing. The transient accumulation-area ratio is 0.40, which can he compared with the values of approximately 0.30 on September 30, 1966, and 0.15 on October 16, 1966, the end of the balance year. Although little snow remains on the glacier, accumulation patterns are still obvious in this photograph. The strong influence of the prevailing western storm wind is indicated by drift patterns and by the predominance of snow remaining on the western side of the glacier (north to top of photograph). |
Precipitation
Precipitation remains one of the most difficult parameters to measure accurately. Standard gages in high mountain environments serve, at best, only as indices of the total precipitation. For example, the well-shielded recording gage at site 1 (alt 1,610 m) measured just 63 percent of the estimated basin precipitation for this hydrologic year. This was due, in part, to this gage's location at the lowest point in the basin. But the gage is inaccurate mainly because about 80 percent of the precipitation occurred as wind-driven snow which is only partially intercepted by the gage.
The actual basin precipitation,  a*,
was estimated as the sum of the annual runoff, a (3.25 m), and the
annual balance for the basin, a (-0.45 m). The ratio of this calculated
precipitation (2.80 m) to the measured precipitation,
pa (1.77 m), is 1.58 as compared with 1.67 in the 1965
hydrologic year. The cumulative basin precipitation, σ* (pl. 4D, 3d
graph), was determined by multiplying the cumulative measured
precipitation, sigmapa, by this fixed ratio. The hydrologic-balance
curve (pl. 4D, 3d graph) is the difference between cumulative
precipitation and cumulative runoff.
a*,
was estimated as the sum of the annual runoff, a (3.25 m), and the
annual balance for the basin, a (-0.45 m). The ratio of this calculated
precipitation (2.80 m) to the measured precipitation,
pa (1.77 m), is 1.58 as compared with 1.67 in the 1965
hydrologic year. The cumulative basin precipitation, σ* (pl. 4D, 3d
graph), was determined by multiplying the cumulative measured
precipitation, sigmapa, by this fixed ratio. The hydrologic-balance
curve (pl. 4D, 3d graph) is the difference between cumulative
precipitation and cumulative runoff.
Contribution of Glacier to Runoff
The runoff from small glacierized basins, such as this one, contributed a significant volume of water to the Cascade River during the months of August and September. During these two months most of the discharge from the South Cascade Glacier basin originated from the melting of glacier ice. The negative balance (-0.94 m) resulting from this high degree of ice melt thus increased the runoff of the low altitude streams to a value far above that produced by precipitation alone. For the South Cascade Glacier basin (6.1 km2), ice melt contributed 85 percent of the total runoff in August and September; for the Cascade River basin (435 km2) during the same period melting of ice in South Cascade Glacier alone contributed 7 percent of the total runoff, and ice melt from all glaciers (16 km2) in the basin contributed approximately 35 percent of the flow. The total runoff from South Cascade Glacier for the 1966 hydrologic year was fairly high (4.02 m).
| <<< Previous | <<< Contents >>> | Next >>> |
pp/715-A/sec5.htm
Last Updated: 28-Mar-2006