
|
Geological Survey Professional Paper 715—B
Combined Ice and Water Balances of Maclure Glacier, California, South Cascade Glacier, Washington, and Wolverine and Gulkana Glaciers, Alaska, 1967 Hydrologic Year |
WOLVERINE GLACIER
DESCRIPTION
Wolverine Glacier (lat 60°24' N., long 148°54' W.) is a valley glacier on the Kenai Peninsula in south-central Alaska. The mean ELA is 1,200 m. Perennial snow and ice covers 72 percent of the 24.6-km2 drainage basin1. The stream from the glacier enters Nellie Juan River, which empties into Kings Bay, a fiord in Prince William Sound.
1Drainage basin area for Wolverine Glacier has been revised from that reported in Meier and others (1971, p. A22).
FIELD PROGRAM
The snow and ice balance measurements which began in the 1966 hydrologic year were expanded in 1967 to a more thorough program. The snow balance was measured on April 1, 14 days before the time of maximum balance. A stream stage recorder (site 1, table 5) was installed 0.1 km below the terminus of the glacier and began recording on May 28, 1967. A 0.2-m diameter (U.S. Weather Bureau 8-in.) storage precipitation gage was also installed at the stream gaging station.
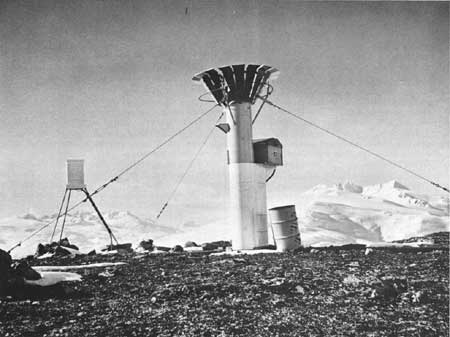
A combination air temperature and precipitation recorder was installed at l,000-m altitude (site 3) and began recording on May 27, 1967. The gage was designed specially for this project and consists of a 0.3-m diameter conical orifice, 3 m above the ground surface, shielded by freely swinging metal slats (fig. 5). The precipitation holding tank area is 5 times larger than the orifice area and accommodates a 0.3-m diameter float sensor. Rain and snow are dissolved in a methanol-glycol (60-40 percent by volume) antifreeze solution that is self-circulating during the addition of snow (Mayo, 1972). Air temperature is sensed by a finned, gas-filled bulb mounted 2 m above a level tundra area in a ventilated white screen. A south-facing sun slot provides noontime marks on the air temperature record. Both precipitation and the air temperature record on a Stevens A-35T spring-powered recorder which operates 4.5 months unattended.
|
| FIGURE 5.—Photograph of precipitation and air-temperature gage at Wolverine Glacier, Kenai Mountains, Alaska. This recording gage operates throughout the year at site 3, l,000-m altitude (see pl. 3A for location). A specially designed antifreeze solution which is self-mixing enables precipitation occurring as snow to be recorded without the addition of heat. The wind screen on the left contains the air temperature sensing element. |
A 0.2-m storage precipitation gage was operated only during the summer season at 940-m altitude (site 2). This gage was read daily during storms when personnel were in the basin.
A network of stakes was installed in the 1966 ablation area in June 1967. Unusually intense melting in 1967 caused many of the stakes to melt out of the ice. The remaining stakes were measured September 15-22 and these data were used to make a map of the ice balance. Continuing intense fall storms prevented all attempts to measure the firn balance.
Aerial photographs of Wolverine Glacier basin were taken at 2-8 week intervals during the ablation season (table 5). A map of the transient snowlines and exposed firn edges (pl. 3A) made from these photographs shows that nearly all snow was removed, leaving only 10 percent of the glacier covered with new firn at the end of the ablation season.
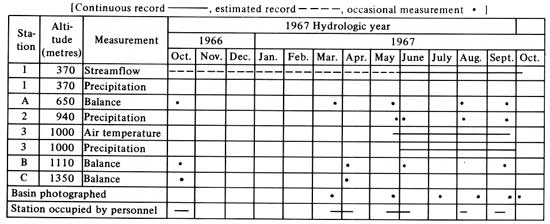
TABLE 5.—Instrumentation at Wolverine Glacier during the 1967 hydrologic year
WEATHER
The weather in Alaska during the 1967 hydrologic year departed markedly from the normal as indicated by the departures from the 44-yr record at Seward, Alaska (U.S. Dept. of Commerce, 1967-68). Seward, 40km southwest of Wolverine Glacier, is the closest long-record weather station to the glacier. October 1966 had above average (115 percent) precipitation and colder (by 2.4°C) temperatures than normal. Precipitation from November 1966 through May 1967 was very low; monthly totals ranged from only 101 mm in December (63 percent of average) to only 21 mm in May (20 percent of average). The dry trend reversed itself in June, became normal throughout July and August, then excessively wet by September, when Seward received 662 mm of rain (272 percent of average). The excessive rain caused flooding in the Kenai Mountains.
The meager winter snowpack was followed by an early spring and a warmer than normal summer. Temperatures at Seward were 0.3° to 1.8°C warmer than average from March through August. The relatively large departures from normal weather at Seward balanced, resulting in an annual average air temperature within 0.1°C of the 44-yr average. The annual precipitation was within 3 percent of the mean.
The results of these departures were very evident on Wolverine Glacier. October 1966 snowfall amounted to 3 m at 1,500-m altitude. The abnormally dry months which followed allowed 1-m tall runway markers, inserted in the snow near the middle of the glacier in October, to still protrude in April 1967. The abnormally warm spring resulted in continuous rapid melting.
The seasonal departures from the normal precipitation regime and the seemingly minor changes in the air temperature combined in this specific way to reproduce large magnitude changes on the glaciers and river flow in the Kenai Mountains during 1967. Therefore, the seasonal distribution of rain, snow, and temperature was, in this case, more important to the glacier regime than the annual total or mean value. This conclusion places large restraints on interpretations of glacier balance which are based on annual climatic data.
GLACIOLOGIC BALANCES
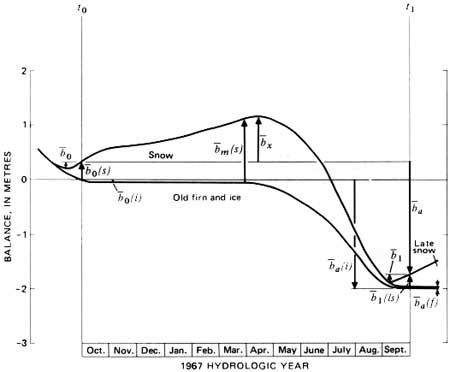
The initial snow balance,  0(s) for the 1967 hydrologic year
was estimated from measurements made in October 1966 to be 0.23-m water
equivalent averaged over the basin. The measured snow balance, m(s) (table 6,
fig. 6), increased from 0.23 m on October 1, 1966, to only 0.89 m by
April 1, 1967. Strong winds during the winter eroded all the snow from
rocky knolls and exposed parts of the glacier. Some of the snow was
redeposited in valleys and part was lost by sublimation. The reversal of
tracks made in the snow before one windstorm indicated wind erosion of
100-200 mm. Inspection of adjacent basins indicated a predominance of
erosion over deposition. Thus, Wolverine Glacier basin served neither as
the recipient of snow blown from upwind basins nor as the contributor to
snow blown into downwind basins.
0(s) for the 1967 hydrologic year
was estimated from measurements made in October 1966 to be 0.23-m water
equivalent averaged over the basin. The measured snow balance, m(s) (table 6,
fig. 6), increased from 0.23 m on October 1, 1966, to only 0.89 m by
April 1, 1967. Strong winds during the winter eroded all the snow from
rocky knolls and exposed parts of the glacier. Some of the snow was
redeposited in valleys and part was lost by sublimation. The reversal of
tracks made in the snow before one windstorm indicated wind erosion of
100-200 mm. Inspection of adjacent basins indicated a predominance of
erosion over deposition. Thus, Wolverine Glacier basin served neither as
the recipient of snow blown from upwind basins nor as the contributor to
snow blown into downwind basins.
TABLE 6.—Ice and water balances, Wolverine Glacier basin, 1967 hydrologic and balance years
[Values and errors in metres water equivalent expressed as averages over the glacier and basin except where indicated. Date: Hydrologic year, Oct. 1, 1966 (t0) through Sept. 30, 1967 (t1)]
| Glacier |
Basin |
Date | Term | Explanation | |||
| Value | Error | Value | Error | ||||
Yearly mass balances | |||||||
| a |
-2.04 | 0.52 | -1.49 | 0.50 | Hydrologic year | Annual balance | Total change in snow, firn, and ice storage during the 1967 hydrologic year, from t0 to t1; approximately equal to difference between precipitation as snow and melt-water runoff for the hydrologic year. |
| n |
-2.06 | .52 | -1.50 | .52 | Sept. 10, 1966 to Sept. 5, 1967 | Total mass net balance | Change in storage from the minimum balance in 1966 autumn (t0') to the minimum in the 1967 autumn (t1'). |
| a(fi) |
-1.95 | .50 | -1.42 | .36 | Hydrologic Year | Autumnal firn and ice balance | Change in firn and ice storage during the 1967 hydrologic year; excludes initial and late snow on the basin. |
Accumulation and ablation | |||||||
| m(s) |
1.17 | 0.10 | 0.89 | 0.10 | April 1, 1967 | Measured winter snow balance | Snowpack on the 1966 summer melt surface (ss0); measured in late winter or spring in pits and by probing. |
| x |
.86 | .14 | .68 | 0.13 | May 5, 1967 | Maximum balance | Storage change from the beginning of the hydrologic year
(t0) to the maximum in the spring. Winter balance (bw)
equals maximum balance (x) plus the absolute
value of the initial balance increment (0). |
| a(f) |
.03 | .03 | .02 | .02 | Hydrologic Year | Annual firnification | The increment of new firn in the accumulation area at t1, measured after melting from this residual snowpack (firn) ceases in the autumn. |
| a(i) |
-1.98 | .50 | -1.44 | .36 | do | Annual ice balance | Ice and old firn melt in the ablation area during the hydrologic year. |
 a a |
2.06 | .25 | 1.55 | .20 | do | Annual accumulation | Total accumulation of snow between t0 and t1. |
 a a |
4.10 | .50 | 3.04 | .50 | do | Annual ablation | Total ablation of snow, ice, and old firn between t0 and t1. Approximately equal to the difference between annual rainfall and runoff. |
Values relating annual and net ice balances | |||||||
| 0 |
0.10 | 0.10 | 0.09 | 0.09 | Sept. 10-30, 1966 | Initial balance increment | Storage change between time of minimum in 1966 autumn (t0') and beginning of hydrologic year (t0). |
| 0(s) |
.30 | .10 | .23 | .08 | Oct. 1, 1966 | Initial snow balance | Snow accumulated on the 1966 summer surface (ss0) at beginning of hydrologic year (t0); measured in pits and by probing. |
| i |
-.05 | .05 | -.04 | .04 | Oct. 1-12, 1966 | Initial ice balance | Ice and old firn melt after t0 and before the winter snowpack covers the glacier; measured by ablation stakes. |
| 1 |
.12 | .10 | .10 | .10 | Sept. 5-30, 1967 | Final balance increment | Storage change between time of minimum in 1967 autumn and the end of the hydrologic year. |
| 1(ls) |
0.21 | .10 | .16 | .10 | Sept. 30, 1967 | Final late snow balance | Snow accumulated on the 1967 summer surface (ss1) at t1. |
| 1i |
-.02 | .01 | -.01 | .01 | Oct. 1-20, 1967 | Final ice balance | Ice and old firn melt after t1 and before the next year's snowpack covers the glacier. |
Glacier and basin dimensions | |||||||
| S(fi) | 117.7 | 0.2 | 18.2 | 0.2 | Sept. 30, 1966 | Glacierized area | Glacier value includes firn and ice areas which normally are attached to the main trunk glacier. Basin value is the main glacier plus all other small glaciers and perennial snowfields in the drainage basin. Ice-cored moraine and other permafrost areas are not included as glacierized areas. |
| S | 117.7 | .2 | 24.6 | .2 | do | Total area | Glacier and water drainage basin above the stream-gaging station. |
| AAR | 2.10 | .02 | .07 | .02 | do | Accumulation area ratio | Area of new firn, accumulation area, divided by the total area. An index of annual balance. |
| ELA | 1,700 | do | Equilibrium line altitude | Average altitude where snow ablation equals snow accumulation. An index of annual balance. | |||
| δL | -5 | 3 | Hydrologic year | Advance or retreat | Average horizontal distance change of terminus of the glacier in direction of flow. | ||
Precipitation and runoff | |||||||
| pa | 2.90 | 0.30 | 2.44 | 0.30 | Hydrologic year | Annual basin precipitation | Area averaged snow and rainfal measured during the hydrologic year by precipitation gages and snow-balance measurements. |
| pa(r) | .84 | .20 | .89 | .20 | do | Annual basin precipitation as rain | Area averaged rainfall measured during the hydrologic year. Rain distinguished by air temperature records, visual observations, and photographic record. |
| pa* | 3.58 | .95 | 2.98 | .70 | do | Calculated annual precipitation | Area average snow and rain precipitation; the sum of annual stream runoff
and annual storage change (a). |
 a a |
5.62 | .80 | 4.47 | .50 | do | Annual runoff | Stream discharge for the year divided by glacier or basin area, expressed as average depth of water over the area; measured by stream-stage recorder and stream-discharge measurements. |
1Square kilometres. 2Dimensionless. | |||||||
|
| FIGURE 6.—The balance of Wolverine Glacier, 1967 hydrologic year. (Refer to table 6 for additional values.) |
The maximum snow depth observed in April 1967 was 5.5 m and the average was about 2.5 m. The snow density ranged from 340 to 470 kg/m3 depending primarily on total snow depth. The average density was 410 kg/m3. The temperature in a 4.4-m snow pit at 1,350-m altitude ranged from a low of -9°C at 1 m depth to -4° at 4 m depth. The temperature at the base of 1-m snow on glacier ice at 1,020-m altitude was -6.5°C.
The initial ice balance, 0(i), the amount of ice ablated
from October l until winter, was small, -0.05 m averaged over the
glacier. Part of the glacier remained bare of snow throughout the winter
because of wind erosion. Measurement at one stake in bare ice indicated
no winter ablation. Sun-cup type scalloping of the ice surface suggests
that some sublimation had occurred but was judged to be less than 0.02
m.
Melting of snow and ice began in April. By July, much
of the previous year's firn was exposed and melting. The annual old firn
and ice balance, a(i), was -1.98 m averaged over the
glacier. The small amount of residual snow which became firn, the annual
firnification, a(f), was only 0.03 m, resulting in an
annual firn and ice balance, (fi), of -1.95 m for Wolverine Glacier in 1967. This
is a relatively large change in glacier mass during one year, and was
probably caused by the fact that ice and old firn have a lower albedo
than snow.
The glacier plus perennial snowfield area was 18.2 km2 at the beginning of the 1967 hydrologic year. The total area of ice and firn was 17.7 km2 by the end of the year. The most pronounced losses in area were from melting of perennial snowfields adjacent to the glacier.
HYDROLOGIC BALANCE
The difference between input (mostly precipitation) and output (mostly runoff) is designated the hydrologic balance as distinguished from the glaciologic balance. No recording precipitation gage was operating in Wolverine Glacier basin until June 1, 1967, so the gage at Seward, Alaska, was used as an index to daily precipitation at Wolverine Glacier. From October 1, 1966, to March 31, 1967, the precipitation at Wolverine Glacier was estimated by:
σ =
m(s) - 0(s) +
σ (Oct. 1, 1966, to Mar.
31, 1967) + 0(i) = 0.89-0.23+0.09-0.04=0.71 m
=
m(s) - 0(s) +
σ (Oct. 1, 1966, to Mar.
31, 1967) + 0(i) = 0.89-0.23+0.09-0.04=0.71 m
During the same period, 0.65 m precipitation was recorded at Seward. The daily cumulative precipitation (pl. 3D) was computed by multiplying Seward precipitation by 71/65=1.09. For April and May, the ratio used was 1.6, the same ratio determined for the later period June l to September 30 by gages in Wolverine Glacier basin. The inferred precipitation in April and May was 0.08 m or only 3 percent of the annual total.
The recording precipitation gage (site 3, data on pl.
3D) is located in one of the driest (as determined by gages in
subsequent years) and possibly one of the windiest parts of the basin,
so its catch is at best only an index of the total precipitation into
the basin. The gage at 370-m altitude (site 1) received three times more
than the recording gage because it is more protected from wind and
because low clouds produce rain at site 1 while they do not cover site
3. This situation is persistent and common. The altitude distribution of
the annual precipitation (pl. 3E) was determined using the
distribution of the measured snow balance plus the catch of the three
gages in the summer. The annual precipitation, a, was computed using the snow
balance measurements, a 2-month estimate based on the Seward gage, and
the gages placed in the basin, and was 2.44 m for the 1967 hydrologic
year.
An estimate of the total basin precipitation can also
be made by treating the entire basin as a large gage where the annual
runoff plus annual storage change (neglecting condensation and
evaporation) equals precipitation. This calculated annual precipitation,
a*, for 1967 was 2.98-m water
equivalent.
The daily runoff from Wolverine Glacier basin (pl. 3D) from May 28 through September 30, 1967, shows a close correlation between air temperature plus rain precipitation. The cumulative runoff (pl. 3D) includes 0.3 m (7 percent of the total) estimated runoff from October 1966 through May 27, 1967, plus the measured daily stream-flow. The 1967 annual runoff, ra, was 4.47 m averaged over the basin.
The recorded stream stage (height) shows a strong diurnal fluctuation with minimums at approximately 4 a.m. (local time) and peaks at about 2 p.m. Abrupt decreases in streamflow for 5 to 15 minutes occur randomly in the record, followed immediately by an unusual rise then a return to normal. None of these abrupt events are caused by weather changes, so must represent short-term plugging and release within the subglacial drainage system. Some rises are sufficiently abrupt to be a threat to persons wading the stream.
An estimate of the daily basin balance and annual
balance (pl. 3D) can be calculated from the precipitation and
runoff measurements (hydrologic balance.) This can be compared with the
balance measured at points (such as index stations A, B, and C) or with
the basin balance determined by glaciologic methods. The maximum basin
balance occurred on April 14, 1967, the last date with winter
temperatures. The cumulative runoff equaled the precipitation by June
21. By September 5, the amount of streamflow runoff exceeded the
precipitation 2.8 times, which illustrates one way in which a glacier
can have a large influence on a glacier-fed river. At the end of the
1967 hydrologic year, the hydrologic balance, a = a, was -2.03 m. The annual balance, a, for the basin
measured glaciologically was -1.49 m. These two values are independent
measurements of the annual storage change. The difference between the
two values is primarily due to the large uncertainties in the
measurements for this year or to the possible release of liquid storage
from within the glacier.
| <<< Previous | <<< Contents >>> | Next >>> |
pp/715-B/sec4.htm
Last Updated: 28-Mar-2006