|
Forests and National Prosperity A Reappraisal of the Forest Situation in the United States |
|
OUR USE OF THE TIMBER RESOURCE
Shrinking Supply Limits Timber Use
The continued shrinkage and deterioration of forest growing stock is the heart of the Nation's forest problem. It means that we cannot use timber as generously as in the past. For example, the difficulty of getting lumber has driven lumber prices up more than those of other construction materials. Relief that may come from more rapid cutting of the present timber stand will at best be temporary or partial. The tide of depletion must be turned if the forests are to make their full contribution to the economic and social life of the Nation.
To help turn the tide every effort should, of course, be made to reduce waste in logging, manufacture, and use. Losses from fire, insects, disease, and other destructive agents should also be reduced. But above all, more timber should be grown—the extent of denuded land and the widespread occurrence of poor stocking and inferior quality indicate that much of the productive capacity of the land is going to waste. Good cutting practices in the virgin timber also offer opportunity for increasing timber growth. But saw timber cannot be grown overnight—and timber shortage is pressing us now. To bring the problem of timber use and depletion into focus, it is necessary to examine current growth and drain. [13]
Timber Growth
The forests of the United States are now growing at a yearly rate of 13.4 billion cubic feet of all timber including 35.3 billion board feet of saw timber [14] (table 9). Over half of the saw-timber growth (56 percent) is in the South. Only one-fourth is in the North, although the North has almost as much commercial forest land as the South. The remaining one-fifth is in the West.
TABLE 9.—Current annual timber growth1
| Section and region |
Saw-timber growth | All-timber growth | ||||
| Total | Softwood | Hardwood | Total | Softwood | Hardwood | |
| Billion bd. ft. |
Billion bd. ft. |
Billion bd. ft. |
Billion cu. ft. |
Billion cu. ft. |
Billion cu. ft. | |
| North: | ||||||
| New England | 1.80 | 0.91 | 0.89 | 0.90 | 0.42 | 0.48 |
| Middle Atlantic | 2.71 | .60 | 2.11 | 1.40 | .27 | 1.13 |
| Lake | 1.40 | .34 | 1.06 | .81 | .18 | .63 |
| Central | 2.25 | .13 | 2.12 | 1.44 | .10 | 1.34 |
| Plains | .19 | .02 | .17 |
.12 | .01 | .11 |
| Total | 8.35 | 2.00 | 6.35 | 4.67 | .98 | 3.69 |
| South: | ||||||
| South Atlantic | 6.11 | 4.02 | 2.09 | 1.76 | 1.01 | .75 |
| Southeast | 8.22 | 5.28 | 2.94 | 2.71 | 1.48 | 1.23 |
| West Gulf | 5.61 | 3.62 | 1.99 |
1.92 | 1.03 | .89 |
| Total | 19.94 | 12.92 | 7.02 | 6.39 | 3.52 | 2.87 |
| West: | ||||||
| Pacific Northwest: | ||||||
| Douglas-fir subregion | 3.74 | 3.67 | .07 | 1.02 | .99 | .03 |
| Pine subregion | .48 | .48 | --- |
.22 | .22 | --- |
| Total | 4.22 | 4.15 | .07 | 1.24 | 1.21 | .03 |
| California | 1.16 | 1.16 | --- | .33 | .33 | --- |
| North Rocky Mtn. | 1.31 | 1.30 | (2) | .54 | .54 | (2) |
| South Rocky Mtn. | .32 | .32 | (2) |
.20 | .18 | .02 |
| Total | 7.01 | 6.93 | .08 | 2.31 | 2.26 | .05 |
| United States | 35.30 | 21.85 | 13.45 | 13.37 | 6.76 | 6.61 |
1Data for 1944.
2Less than 0.005.
| ||||||
In the eastern half of the country, where practically all the forest land has been cut over one or more times, current growth really measures the extent to which present practices utilize the productive capacity of the land. In the West, on the other hand, timber growth may be expected to increase as cutting progresses, because two-fifths of the commercial forest land is still in virgin timber, making little or no net growth. Effective saw-timber growth can be obtained promptly in some virgin forest types by selective cutting, which would take the overmature and decadent trees and leave a vigorous growing stock. Clear-cutting of a whole area, however, usually postpones effective saw-timber growth 50 years or more.
The current estimate of saw-timber growth is 3.3 billion board feet greater than the 1938 estimate. Most of the difference may be due to the nature of the estimates rather than to changes actually taking place. For example, earlier estimates were weaker and generally lower than current estimates in regions not reached by the Forest Survey, notably the New England, Middle Atlantic, Central, and California regions. [15] Such increases were partly offset by a reduction in the area of commercial forest land in the Rocky Mountain regions. An improved method of calculating growth led to an increase over the earlier estimate for the Douglas-fir subregion. Only for the Lake region and the South are the estimates comparable.
In the Lake region saw-timber growth dropped 24 percent in 10 years, with the decline more acute for softwoods than hardwoods. Total cubic-foot growth declined 17 percent.
In the South [16] saw-timber growth is 3 percent greater than it was 10 years ago. However, the net increase of 622 million board feet is the result of an increase of 886 million board feet (12 percent) of hardwoods and a decrease of 264 million board feet (2 percent) of softwoods. Similarly, two-thirds of a 9-percent increase in all-timber growth is in hardwood. Thus break-down of the growth figures confirms evidence in the previous section on the replacement of the more desirable pine by hardwoods. The over-all figures, which superficially indicate an improvement, really reflect deterioration of the forest.
Timber Drain
Forest drain, or the volume taken by cutting, and by fire and other destructive agents, was 13.7 billion cubic feet in 1944 (tabulation following). Of the all-timber drain, almost 80 percent, or the equivalent of 53.9 billion board feet, was saw timber. Hardwoods comprise 40 percent of the all-timber drain, but less than 30 percent of the saw-timber drain.
| Forest drain | ||
| All timber1 (billion cu. ft.) |
Saw timber2 (billion bd. ft.) | |
| Timber cut, 1944 | 12.18 | 49.66 |
| Fire losses3 | .46 | .86 |
| Insect and disease losses3 | .62 | 1.93 |
| Windstorm and other3 | .40 | 1.44 |
| Total | 13.66 | 53.89 |
|
1Excluding bark.
2Lumber tally. 3Average volume destroyed yearly in period 1934-43. | ||
Although domestic use of wood was sharply reduced because of the war, saw-timber drain in 1944 was over 6 billion board feet more than in 1936, the year of the last previous comprehensive estimate. During the peak years 1941-43, saw timber drain was close to 60 billion board feet annually. It was again close to this figure in 1947.
About nine-tenths of the drain is due to cutting. The remainder is the work of fire, insects, diseases, and other natural causes. Not included in the drain figures is the loss by destructive agents of millions of small trees below 5 inches in diameter, which are no less important for future timber supply. Also serious are the deterioration of forest soil and the adverse watershed conditions resulting from fire and destructive cutting.
Nearly half the all-timber drain occurs in the South, which has only 28 percent of the Nation's timber, while about one-fourth each occurs in the North and West, with 21 and 51 percent of the timber, respectively (table 10).
TABLE 10.—Annual forest drain, by region1
| Section and region |
Saw-timber growth | All-timber growth | ||||
| Total | Softwood | Hardwood | Total | Softwood | Hardwood | |
| Billion bd. ft. |
Billion bd. ft. |
Billion bd. ft. |
Billion cu. ft. |
Billion cu. ft. |
Billion cu. ft. | |
| North: | ||||||
| New England | 2.20 | 1.44 | 0.76 | 0.76 | 0.37 | 0.39 |
| Middle Atlantic | 2.30 | .58 | 1.72 | .85 | .18 | .67 |
| Lake | 2.01 | .84 | 1.17 | .74 | .32 | .42 |
| Central | 2.34 | .12 | 2.22 | 1.20 | .05 | 1.15 |
| Plains | .18 | .01 | .17 |
.12 | .01 | .11 |
| Total | 9.03 | 2.99 | 6.04 | 3.67 | .93 | 2.74 |
| South: | ||||||
| South Atlantic | 6.14 | 4.30 | 1.84 | 1.60 | 1.06 | .54 |
| Southeast | 11.93 | 7.54 | 4.39 | 3.02 | 1.79 | 1.23 |
| West Gulf | 6.83 | 3.80 | 3.03 |
1.84 | .85 | .99 |
| Total | 24.90 | 15.64 | 9.26 | 6.46 | 3.70 | 2.76 |
| West: | ||||||
| Pacific Northwest: | ||||||
| Douglas-fir subregion | 12.00 | 11.98 | .02 | 2.15 | 2.15 | (2) |
| Pine subregion | 2.53 | 2.53 | -- |
.47 | .47 | -- |
| Total | 14.53 | 14.51 | .02 | 2.62 | 2.62 | (2) |
| California | 3.16 | 3.16 | -- | .49 | .49 | -- |
| North Rocky Mtn. | 1.79 | 1.76 | .03 | .32 | .31 | .01 |
| South Rocky Mtn. | .48 | .47 | .01 |
.10 | .10 | (2) |
| Total | 19.96 | 19.90 | .06 | 3.53 | 3.52 | .01 |
| United States | 53.89 | 38.53 | 15.36 | 13.66 | 8.15 | 5.51 |
1Drain for commodities is based on 1944 data;
estimates for loss by destructive agents are based on 1934-43
averages.
2Less than 0.006.
| ||||||
Saw-timber drain from the South (25 billion board feet) is 25 percent greater than that from the West (20 billion board feet), even though the timber in the South is now almost all second growth and the West still has a large volume of virgin timber. Because of the advanced stage of depletion in the North, only 17 percent of the saw-timber drain now comes from that section, despite its great consumption of lumber. The rate of drain in relation to saw-timber volume is greater for softwoods than for hardwoods in both North and South.
Lumber is by far the largest item (table 11 and fig. 8), making up about 70 percent of the saw timber and 55 percent of the cubic-foot cutting drain. The lumber cut in 1944 was about 5 billion board feet more than in 1936 but 6 billion less than in 1929, and 5 billion less than in 1947. About three-fourths of the 34.4 billion board feet of lumber drain in 1944 was softwood and one fourth hardwood. Two-fifths came from the South and another two-fifths from the Northwest and California (table 12). Only 14 percent came from the 37 percent of the commercial forest land that is in the North.
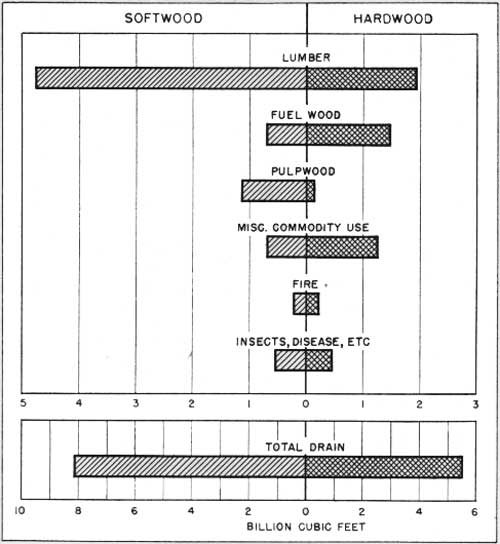
|
| FIGURE 8.—Annual forest drain by cutting (1944) and destructive agents (1934-43), United States. |
TABLE 11.—Forest drain, by commodities cut, 1944
| Commodity | Saw-timber drain | All-timber drain | ||||
| Total | Softwoods | Hardwoods | Total | Softwoods | Hardwoods | |
| Billion bd. ft. |
Billion bd. ft. |
Billion bd. ft. |
Billion cu. ft. |
Billion cu. ft. |
Billion cu. ft. | |
| Lumber | 34.39 | 26.13 | 8.26 | 6.71 | 4.78 | 1.93 |
| Fuel wood | 3.86 | 1.96 | 1.90 | 2.20 | .72 | 1.48 |
| Pulpwood | 4.76 | 4.50 | .26 | 1.31 | 1.17 | .14 |
| Hewn ties | 1.64 | .78 | .86 | .36 | .15 | .21 |
| Fence posts | .23 | .08 | .15 | .22 | .06 | .16 |
| Veneer logs | 1.97 | .94 | 1.03 | .39 | .16 | .23 |
| Mine timbers | .32 | .07 | .25 | .23 | .04 | .19 |
| Cooperage | .75 | .20 | .55 | .17 | .04 | .13 |
| Shingles | .33 | .33 | --- | .07 | .07 | --- |
| Other | 1.41 | .60 | .81 |
.52 | .16 | .36 |
| Total | 49.66 | 35.59 | 14.07 | 12.18 | 7.35 | 4.83 |
Fuel wood, which makes up 18 percent of the cutting drain, amounts to 2.2 billion cubic feet (table 11 and fig. 8). This drain item is relatively important in the South and in the North, and of little consequence in the West (table 12). Two-thirds is in hardwoods, one-third in softwoods.
TABLE 12.—Major items of forest drain by region, 1944
| Section and region |
Lumber | Fuel wood |
Pulpwood | Other commodities1 |
Fire2 | Insects, disease, etc.2 | ||
| Million bd. ft. |
Million cu. ft. |
Million cu. ft. |
Million cu. ft. |
Million cu. ft. |
Million bd. ft. |
Million cu. ft. |
Million cu. ft. | |
| North: | ||||||||
| New England | 864 | 201 | 194 | 154 | 82 | 3 | 5 | 125 |
| Middle Atlantic | 1,361 | 313 | 224 | 52 | 204 | 23 | 18 | 35 |
| Lake | 1,170 | 333 | 96 | 179 | 90 | 8 | 6 | 43 |
| Central | 1,479 | 395 | 380 | 32 | 291 | 102 | 57 | 46 |
| Plains | 36 | 9 | 79 | --- |
10 | 1 | 1 | 19 |
| Total | 4,910 | 1,251 | 973 | 417 | 677 | 137 | 87 | 268 |
| South: | ||||||||
| South Atlantic | 3,536 | 707 | 373 | 166 | 133 | 48 | 24 | 193 |
| Southeast | 6,867 | 1,356 | 498 | 257 | 473 | 229 | 149 | 289 |
| West Gulf | 3,819 | 774 | 298 | 152 |
398 | 156 | 107 | 113 |
| Total | 14.222 | 2,837 | 1,169 | 575 | 1,004 | 433 | 280 | 595 |
| West: | ||||||||
| Pacific Northwest | 10,877 | 1,934 | 36 | 309 | 232 | 131 | 44 | 63 |
| California | 2,496 | 372 | 2 | --- | 22 | 91 | 29 | 65 |
| North Rocky Mtn. | 1,499 | 246 | 19 | 5 | 20 | 61 | 17 | 9 |
| South Rocky Mtn. | 387 | 71 | 4 | --- |
7 | 6 | 3 | 19 |
| Total | 15,259 | 2,623 | 61 | 314 | 281 | 289 | 93 | 156 |
| United States | 34,391 | 6,711 | 2,203 | 1,306 | 1,962 | 859 | 460 | 1,019 |
1Veneer logs, hewn ties, mine timbers,
fence posts, cooperage stock, shingles, and other small items.
2Volume destroyed annually, 1934-43. | ||||||||
More than half of the 65 million cords of fuel wood used each year is obtained from tops and limbs of trees cut for sawlogs and other products, from dead and dying trees, from mill waste, etc., and so does not add to forest drain. Only 45 percent of the fuel wood used is shown as drain.
Nevertheless, this is too much. Two-fifths of the direct fuel-wood drain is from saw timber, and much of this is potentially more valuable for other products. It should not be necessary to cut much saw timber for fuel, or to clear-cut pole timber, if cutting for fuel were regarded as a tool of good forestry rather than the end point in timber harvest. Farmers, especially, could improve their stands by getting more fuel wood from thinnings, from trees of undesirable form or species, and from more complete utilization of trees cut for other purposes.
Pulpwood is a rapidly increasing element in drain (table 11 and fig. 8). In 1929 it totaled 4 percent of the commodity drain; in 1936, 6 percent; and in 1944, 11 percent. This increase has been largely due to the rapid expansion of the pulp and paper industry in the South. Remarkable advances in adapting the sulfate pulping process (using pine) to a wide variety of important commercial products, have led to the erection or enlargement of some 20 mills in the South since 1931 and additional units are under construction.
Pulpwood drain in the South now exceeds that of the North by nearly 40 percent. It exceeds that of the West by over 80 percent (table 12). In the Pacific Northwest, however, is concentrated some 309 million cubic feet, which is almost one-fourth the total for the country.
Nearly nine-tenths of the pulpwood cut in the South is pine. In the North, spruce, fir, hemlock, and pine make up three-fourths. Pulpwood in the West is chiefly spruce, true fir, and hemlock.
Although the specifications are more exacting than for fuel wood, more of the pulpwood also could be obtained from thinnings, improvement cuttings, and waste. As it is, however, all but a small fraction of the pulpwood cut is taken from the forest in harvest cuttings.
Other products.—Whereas lumber, fuel wood, and pulpwood make up 84 percent of the total commodity drain, the remaining 16 percent comprises more than 25 items including, in order of cubic volume cut annually, veneer logs, hewn ties, round mine timbers, fence posts, cooperage stock, and shingles. Although small in volume, poles for rural electric lines are an important item. The South accounts for more than half the drain in these miscellaneous items, the North one-third, and the West only one-seventh.
Comparison of Growth and Drain
Comparison of growth and drain is an instructive but often overworked criterion of the Nation's forest situation. Because of the great difference between regions as to forest conditions and stage of depletion, over-all figures may be misleading; and for the same reason regional figures should not be uniformly interpreted. Furthermore, it would be of little value to balance growth and drain by bringing timber use down to the present inadequate level of growth. To fully meet national needs and objectives, as will be shown in the next chapter, it will be necessary to balance growth against a level of consumption and drain higher than at present.
The near balance between all-timber drain (13.7 billion cubic feet) and all-timber growth (13.4 billion cubic feet) is deceptive (table 13). These figures mask the fact that for softwoods the drain is 21 percent more than growth, while for hardwoods it is 17 percent less. Furthermore, four-fifths of the drain is in saw timber. Saw-timber drain is more than 50 percent greater than saw-timber growth. The Nation should not be satisfied with a balance based on poles and saplings when its forest industries depend so largely on saw timber.
TABLE 13.—Comparison of timber growth and drain, 1944
| Species group and section |
Saw timber |
All timber | ||||
| Growth | Drain | Drain ratio1 |
Growth | Drain | Drain ratio1 | |
| Billion bd. ft. |
Billion bd. ft. |
Percent | Billion cu. ft. |
Billion cu. ft. |
Percent | |
| All species: | ||||||
| North | 8.4 | 9.0 | 108 | 4.7 | 3.7 | 79 |
| South | 19.9 | 24.9 | 125 | 6.4 | 6.5 | 101 |
| West | 7.0 | 20.0 | 285 |
2.3 | 3.5 | 152 |
| United States | 35.3 | 53.9 | 153 | 13.4 | 13.7 | 102 |
| Softwood: | ||||||
| North | 2.0 | 3.0 | 150 | 1.0 | 1.0 | 96 |
| South | 12.9 | 15.6 | 121 | 3.5 | 3.7 | 105 |
| West | 6.9 | 19.9 | 287 |
2.3 | 3.5 | 155 |
| United States | 21.8 | 38.5 | 176 | 6.8 | 8.2 | 120 |
| Hardwood: | ||||||
| North | 6.4 | 6.0 | 95 | 3.7 | 2.7 | 74 |
| South | 7.0 | 9.3 | 132 | 2.9 | 2.8 | 96 |
| West | .1 | .1 | 75 |
(2) | (2) | 25 |
| United States | 13.5 | 15.4 | 114 | 6.6 | 5.5 | 83 |
1 Computed before rounding data to tenths of billions.
20.05 or less.
| ||||||
In the West, drain is much greater than growth (fig. 9), but the virgin timber eases the situation there for the present. Nevertheless, hard times will come for dependent communities unless the virgin stands are cut at a rate and in a manner that will promote future growth. Without good forest practice and farsighted planning for both private and public lands, waning of the virgin timber may usher in a long period when there will not be enough saw timber to fully sustain the timber industries. This has already happened in some localities, notably around Puget Sound in western Washington and Klamath Falls in central Oregon.
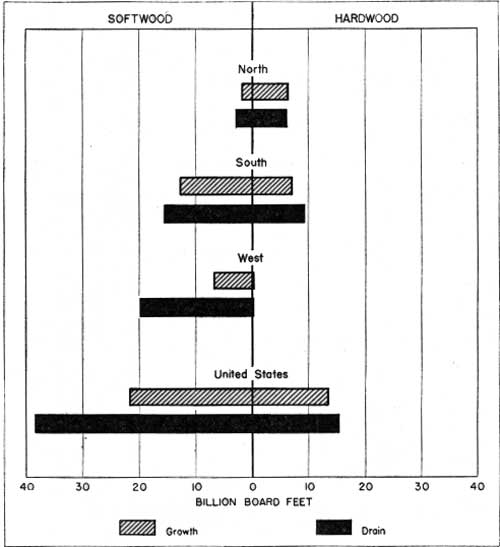
|
| FIGURE 9.—Annual growth and drain of saw timber, United States, 1944. |
In the North, saw-timber drain is only 7 percent more than saw-timber growth; drain for all timber is 21 percent less than growth. Yet the forest situation is more acute than in the other sections. Largely as a result of the advanced stage of forest depletion and deterioration, many of the older wood-using plants have been forced out of business and the shortage of good timber makes it difficult for new plants to start. The excess of all-timber growth over drain is a reflection of the inferior quality and small size of a large part of the timber. Growth on timber of this character is a doubtful asset. In fact, one of the major forest problems of the North is to find markets for the small low-grade timber which should be gotten out of the way to make room for more valuable growth.
In the South all-timber drain is not far out of balance, but saw timber—both hardwood and softwood—is being cut much faster than it is growing.
These trends, if continued, mean an increasing shortage of good timber and a serious handicap to the timber industries.
A Twenty-Year Projection
What has been happening to our saw-timber supply may be emphasized by theoretically projecting 1944 drain and cutting practices ahead for, say, 20 years. Actually, of course, the increasing difficulty of obtaining timber, especially in the North and South, makes it unlikely that the forest industries could produce for long at the 1944 rate. Furthermore, an increasing number of private owners are practicing better forestry; and fire protection is becoming more effective. But if the 1944 cutting practices and rate of drain were continued regionally, the saw-timber stand would fall 27 percent in the next 20 years (table 14).
TABLE 14.—Estimated effect of continuing 1944 drain and cutting practices for 20 years
| Section and region |
Present stand |
Prospective growing stock |
Change |
| Billion bd. ft. |
Billion bd. ft. |
Percent | |
| North: | |||
| New England | 58 | 49 | —16 |
| Middle Atlantic | 62 | 71 | +14 |
| Lake | 50 | 35 | —30 |
| Central | 44 | 43 | —2 |
| Plains | 6 | 6 | --- |
| Total | 220 | 204 | —7 |
| South: | |||
| South Atlantic | 97 | 93 | —4 |
| Southeast | 136 | 55 | —60 |
| West Gulf | 105 | 73 | —30 |
| Total | 338 | 221 | —35 |
| West: | |||
| Pacific Northwest: | |||
| Douglas-fir subregion | 505 | 299 | —41 |
| Pine subregion | 126 | 84 | —33 |
| Total | 631 | 383 | —39 |
| California | 228 | 187 | —18 |
| North Rocky Mtn. | 127 | 119 | —6 |
| South Rocky Mtn. | 57 | 52 | —9 |
| Total | 1,043 | 741 | —29 |
| United States | 1,601 | 1,166 | —27 |
In this theoretical projection the Southeast region would suffer the biggest drop (60 percent), with the Pacific Northwest second (39 percent). Significantly, these are the Nation's principal timber-producing regions.
For the South as a whole, a continuation of the 1944 cut and prevailing forest practices for 20 years would mean a decline of 117 billion board feet, or one-third of the present saw-timber volume (fig. 10). Obviously such a decline in saw-timber volume would mean curtailment of the forest industries and drastic readjustment in dependent communities. Such economic and social losses would be serious for the South, which needs additional industrial development to offset the displacement of labor by reduction of the acreage in cotton and by mechanization of its cultivation and harvesting.
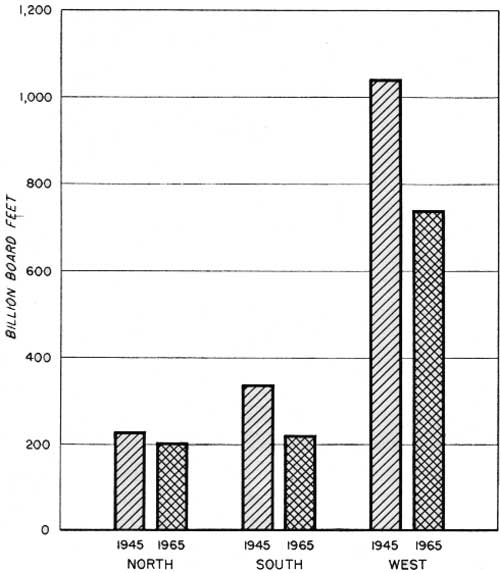
|
| FIGURE 10.—How saw-timber volume would change in 20 years, if 1944 drain and cutting practices were continued. |
In actual quantity, the greatest reduction of saw timber is taking place in the Douglas-fir subregion where 20 years more at the 1944 rate would bring the volume down 206 billion board feet. Such a reduction, while not alarming statistically, would be accompanied by the closing of many established mills and continued shift of industrial activity from one locality to another.
Twenty years more of the present drain would not materially reduce the saw-timber stands in the rest of the country. However, depletion of ponderosa pine, western white pine, sugar pine, and redwood would force western forest industries to adapt themselves to the production and marketing of a different class of products.
If this 20-year projection were to become a reality, it would impair the chances for full employment, increase the burden of taxation on other forms of property, and affect our national security.
Though some adverse effects of timber depletion can hardly be avoided, the United States need not remain the victim of such circumstances. Our land resource is adequate; our people are making some progress in protecting and managing the forests for future timber crops. The time is ripe for more positive measures to make our forests more productive.
| <<< Previous | <<< Contents>>> | Next >>> |
|
misc-668/sec4.htm Last Updated: 17-Mar-2010 |