|
NATIONAL PARK SERVICE
Fauna of the National Parks of the United States No. 7 The Wolves of Isle Royale |

|
DYNAMICS OF WOLF-MOOSE COACTION
SINCE the approximate size and reproductive rate of the moose herd, and rate of kill by the wolves are known, deductions can be made about the long-range effect of predation on moose numbers. Unrefined calculations suggest that annual production and loss in the moose herd are about equal. If the winter rate of kill for the large pack (one moose per 3 days) applies year around, this pack removes about 122 moose per year. The smaller packs (totaling five or six members) probably kill about a third as many, or 41, giving a total annual mortality of 163 moose. An estimated 564 are present in late May when calves are born. Since calves composed 25 percent of the summer observations, extrapolation suggests that at least 188 calves are produced, indicating that the population would remain stable or increase slightly. However, a precise evaluation obviously is not this simple.
A more thorough appraisal of moose-population dynamics requires consideration of two key figures, annual calf production, and percentage of yearlings in the total population. As used here, the term "short-yearling" is a calf in its first winter or spring, and "long-yearling" is an animal 1 to 1-1/2 years old.
Pregnancy rates are not known for the Isle Royale herd, so data from other studies must be used. In British Columbia, 75 percent of 80 adult uteri were pregnant, including some from before the end of the breeding season (Edwards and Ritcey, 1958). Pimlott (1959b) found that in Newfoundland 81 percent of 239 adults taken after November were gravid, and he believes this is less than the actual percentage. The assumed rate for Isle Royale moose is 80 percent, a conservative estimate, in view of the fact that heavily cropped populations usually are most productive.
Calf-production figures are derived from the pregnancy and twinning rates, and number of adult cows present in calving season. The estimated size of the herd on March 1 is 600 (page 98), including 102 yearlings (17 percent), but by calving season it should decrease to about 564 because of continued predation.
The known kill of the large pack is 19 adults and 17 calves in 110 days (based on data from three winters, table 11). If the small packs take a third as many moose, the kill for the entire population is 25 adults and 23 calves in 110 days. At this rate, the wolves remove 19 adults and 17 calves from March 1 to May 20, when calving season begins, so the herd then should contain about 479 adults and 85 yearlings. Half of the 479, or 239, would be adult cows, assuming an even sex ratio. If 80 percent (191) breed and bear an average of 1.19 calves each (see page 105), the calf crop is 227.
Yearling-total population ratios for Isle Royale are given in table 13, and the average annual ratio for early March is believed to be about 17 percent (page 106), which agrees with statistics from other areas. Figures from de Vos (1956) indicate that long-yearlings composed 10 percent of the population minus calves in the Chapleau Crown Game Preserve, and 13 percent in the general Chapleau District of Ontario. The ratio calculated from Knowlton (1960) for the Gravelly Mountains of Montana was 25 percent, for short-yearlings. Pimlott (1959b) found that reported ratios varied from 9 percent to 23 percent. Such variations might result from differences in methods of obtaining the figures. Some are based on summer observations, others on hunter-kill data and still others on winter aerial observations. Probably the study most comparable to the Isle Royale work is that of Spencer and Chatelain (1953). Pimlott calculated that short-yearlings composed 17 percent of their 9,436 winter aerial observations made in four Alaskan areas over a 3-year period. Most low ratios reported were from summer, whereas the Isle Royale figure applies in March, so it compares favorably with the others. This ratio is significant because it is an excellent indicator of annual increment to the herd. Mortality statistics demonstrate that very few individuals aged 1 to 5 are lost (table 18). As calculated above, an estimated 85 animals survive their first year.
Having estimated calf production and annual increment, we can compare them with expected annual mortality. Since the calculated kill is 25 adults and 23 calves per 110 days in winter (see above), annual adult mortality approximates 83 animals, assuming the same rate of adult kill year round. The rate of calf kill cannot be projected for the entire year because summer calves are so much smaller than calves in winter. If the rate is constant from November 1 to May 20, 42 calves are consumed in this period. An indication of summer calf loss can be obtained from the percentage of calves present in the autumn population. The only autumn sample taken showed that 22 percent of 150 moose were calves (page 104). Theoretically, 40 adults should have perished between May 20 and late October, when the survey was made, leaving 524. If calves composed 22 percent of the total population, then 148 calves survived; this indicates that approximately 79 died from May 20 to November 1. On this basis, annual mortality would be 83 adults and 121 calves (42 plus 79), or a total of 204. Since approximately 227 animals are believed to be produced each year, the herd would increase annually by about 23, on the basis of the above computations.
However, more substantial figures show that about 85 calves survive to their first year; 227 minus 85 equals 142 calves lost, 21 more than previously calculated. This discrepancy could result from a mistaken assumption that the winter rate of calf kill applies from November to May. Most likely more calves are taken in autumn and early winter, when they are smaller, more numerous and presumably more vulnerable. If this is true, a more realistic figure than 42 for calf mortality from November to May would be 142 minus 79 (summer kill), or 63.
The annual calf kill is a useful figure, but the statistics most indicative of the future trend in moose numbers are annual adult kill and annual increment. The calculated figures are 83 and 85 respectively. If these approximate actual numbers, the Isle Royale herd will remain stable for as long as they apply.
The annual-kill figure can be checked by comparing the approximate weights of animals killed with the total annual consumption (based on figures averaged from all three winter study periods). The large pack consumed a total of approximately 20,295 pounds in 110 days, or 184 pounds per day (page 77), and if the smaller packs ate a third as much, consumption for the entire population would be about 245 pounds per day, or 89,425 per year.
The weight of animals killed is more difficult to determine. Assuming that 85 adults are taken annually and that each provides about 800 pounds of food, then adults contribute 68,000 pounds per year. If 63 calves at 275 pounds are killed between November 1 and May 20, they provide 17,325 pounds. The estimated 79 calves taken between May 20 and November 1 should average about 81 pounds apiece—calculated from weekly calf weights given by Peterson (1955), Denniston (1956), and Dodds (1959)—so these furnish approximately 6,399 pounds. The three estimates total 91,724 pounds, which compares well with the calculated annual consumption. The close agreement is not important, since most of the figures are estimates; the significant point is that both numbers are within the same order of magnitude.
Another figure that compares favorably with production and loss statistics is the summer ratio of calves to total population (25 percent) based on field observations (page 103). The calculated calf production (227) is 33 percent of the estimated herd, but numbers undoubtedly dwindle rapidly during the first few weeks because of predation. Probably the loss rate declines as calves grow and provide more food. Since the summer calf ratio is an average of observations from about May 20 to September 20, it should be less than the percentage present on May 20 and more than the September ratio. Although the latter is unknown, the figure for November, based on 150 moose, is 22 percent. Thus the conservative estimate of the average summer ratio falls into line.
The following non-assessable factors could affect the production-loss calculations, but probably none is influential enough to destroy the worth of the proposed figures: the importance of beavers as summer food, possible waste of adult moose killed by small packs in summer moose mortality other than predation, and difference in wolves' summer food requirements. Regarding the latter factor, E. H. McCleery, who has maintained a wolf kennel for years, wrote me that he feeds his animals an estimated five-sixths as much in summer as in winter.
The computed proportion of calves in the summer kill does not correlate well with the wolf-scat analysis (table 10). Calf hair composed 48 percent of the occurrences from May to August, and adult hair constituted 16 percent. If 40 adults and 79 calves are killed between May 20 and November 1, calves furnish about 6,399 pounds of food, whereas adults provide about 32,000. There could be several reasons that the scat analysis might not accurately indicate absolute or even relative ratios of calves to adults consumed: (1) Calves are covered with a higher proportion of hair than are adults; (2) all hair is consumed from summer calf kills, whereas large chunks of hide are left at adult kills at least in winter; (3) a wolf could eat much meat from an adult without getting hair, but this would be difficult with a calf; and (4) when an adult is killed in summer, probably the wolves travel little until it is finished, so most scats would be left nearby; however, wolves probably finish a calf quickly and then continue, leaving a higher proportion of scats containing calf remains on trails. These and other possible biases indicate that scat-analysis figures are not a valid check on calculated kill rates.
Postulated seasonal trends in the moose herd are diagramed in figure 102. This model is not a precise estimate of actual numbers; rather it is an idealized scheme based on limited data. As such, it should be useful for considering the effects of wolves on moose numbers, even though future work may necessitate its modification.
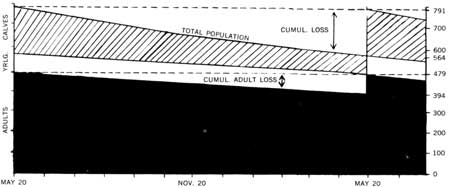
Figure 102—Seasonal trends in the moose herd.
The age-structure curve of the moose herd also can be plotted. Remains of 39 ageable adult moose were discovered at random and segregated into wear classes indicating relative age (table 18); these provide estimates of the percentage of mortality (from wolf predation and all other factors) occurring in each class. Assuming an annual increment of 85 yearlings and a mortality of 85 adults, one can determine the number of individuals in each wear class by subtracting the calculated mortality from the previous class, starting with 85 members in class I. When these are plotted on a graph, a profile of the age structure of the herd (just before calves are dropped) results (figure 103 and table 22). This total moose in each wear class, 493, compares favorably with the estimated population size just before calving season (564).
TABLE 22.—CALCULATED AGE COMPOSITION OF THE MOOSE HERD JUST BEFORE CALVING SEASON
| Wear classa | Number of moose remains found |
Percent of total mortalityb |
Mortality | Population |
| I | 1 | 2.56 | 2.17 | b85.00 |
| II | 2 | 5.12 | 4.34 | 82.83 |
| III | 1 | 2.56 | 2.17 | 78.49 |
| IV | 4 | 10.24 | 8.68 | 76.32 |
| V | 8 | 20.48 | 17.36 | 67.64 |
| VI | 8 | 20.48 | 17.36 | 50.28 |
| VII | 6 | 15.36 | 13.02 | 32.92 |
| VIII | 5 | 12.80 | 10.85 | 19.90 |
| IX | 4 | 10.24 | 8.68 | 9.05 |
| IXA | ... | ... | ... | .37 |
| Total | 39 | 99.84 | 84.83 | 492.80 |
bCalculated annual adult mortality and annual increment is 85.
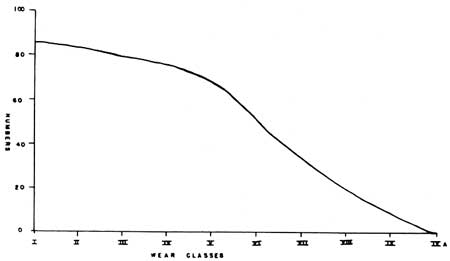
Figure 103—Profile of the age distribution of the herd.
The browse-moose-wolf complex can be summarized for the Isle Royale ecosystem in terms of weight, on the basis of data from this study and one figure from the literature. Since no attempt was made to measure browse consumption of moose, figures from other studies will be used. Hickie (1937) determined that a captive moose requires 25 pounds of browse per day, and Kellum (1941) found that captive animals that were supplied "unlimited" food consumed 40 to 50 pounds per day in winter and 50 to 60 in summer. He believes that summer consumption appears higher because of the high water content of summer foods. In addition, Palmer (1944) estimated, on the basis of tests with caribou, reindeer, and musk-oxen, that a 1,200-pound moose requires about 35 pounds per day. Because wild moose must gather their food, they probably do not consume as much as captive animals, so I will assume that an adult eats 25 pounds daily in winter and 35 pounds in summer.
The Isle Royale wolf population annually devours an estimated 89,425 pounds of moose (page 163), which equals about 112 adults at 800 pounds each. (Since browse consumption figures are based on adults, the wolves' consumption must be converted to adults only.) If the summer rate applies from May 1 to September 1 and the winter rate for the rest of the year, each moose eats about 10,325 pounds per year; the 12 would consume 1,156,400 pounds annually. Since the average Isle Royale wolf is assumed to weigh 72 pounds (page 77), the entire population should weigh about 1,512 pounds. The ratio of moose to browse is 7.7 percent; of wolves to moose, 1.7 percent; and of wolves to browse, .13 percent. Thus, yearly, about 762 pounds of browse are consumed for each 59 pounds of moose, in turn consumed for each 1 pound of wolf.
The above calculations demonstrate the tremendous energy loss that occurs from one trophic level to an other. However, since it takes an estimated 564 moose to produce the weight or number consumed, the annual weight of browse consumed is more realistically in the neighborhood of 5,823,300 pounds—or 3,851 pounds of browse per pound of wolf! The true amount of available or total browse, versus the amount consumed by the herd, is unknown.
Control of the Moose Population
Although the wolves are killing many moose and the herd seems stable, is it accurate to say they are controlling the moose population? It might be argued that they are not, for Isle Royale supports one of the highest year-round moose densities reported (page 98), and the yearling-total population ratio compares favorably with figures from wolf-free areas. This agrees with work by Cowan (1947) in the Rocky Mountain national parks of Canada. He found that yearlings composed 22 percent of 178 moose observations in wolf-inhabited areas and 23 percent of 187 observations in wolf-free areas. There also was no apparent difference in survival rates of young elk, deer, or sheep in the two areas. Evidently wolf predation compensates to a greater or lesser degree for other types of calf mortality. The important question is whether wolves merely substitute for other mortality factors or whether they kill more animals than other factors would.
The history of the Isle Royale moose herd affords an answer. Before wolves became established, the herd increased to an estimated 1,000 to 3,000 animals in the 1930's, decreased drastically a few years later, and built up again in the late 1940's (page 22). The limiting factor was food supply. Signs of severe over-browsing are still evident. In fact one species, Canada yew (Taxus canadensis), has been suppressed greatly on Isle Royale, whereas it grows luxuriantly on nearby Passage Island, which is uninhabited by moose. Today there appears to be sufficient browse, because much of the second-growth birch, aspen, and willow in the 1936 burn is growing beyond the reach of moose, and new stands of balsam fir and aspen a few feet high have become evident in other areas for the first time in decades. Apparently the wolves are maintaining the moose population below the level at which food would restrict it. If the wolves were exterminated, a significant increase in moose numbers probably would be noticed within a few years; when the population overtook its food supply, another die-off would occur, and the cycle would repeat itself. Malnutrition, disease, and parasitism probably would be the mortality factors, and these tend to cause catastrophic losses instead of the low, steady mortality which characterizes predation.
Apparently the Isle Royale wolf and moose populations have reached a state of dynamic equilibrium. Each is relatively stable, so any substantial fluctuation in one probably would be absorbed by the other until another equilibrium is reached. For example, wolves must travel long distances and test many animals before dispatching one. If some extraordinary factor suddenly reduced the moose population by half, the wolves probably would have such difficulty killing enough animals that inferior individuals might not be allowed to share what prey is taken. Conversely, if the moose population increased significantly, wolves would find easier hunting and might eat only preferred parts of their prey, as the wolves did in Minnesota when deer were more plentiful (Stenlund, 1955). Increased predation then might reduce the herd to a level that again rendered hunting more difficult.
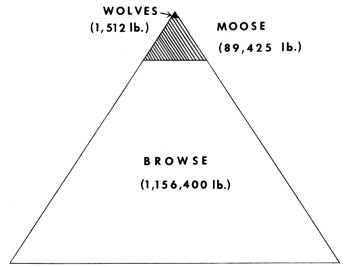
Figure 104——Pyramid of biomass— based on biomass consumed only.
Probably a close predator-prey equilibrium would most likely occur in such a situation as the Isle Royale ecosystem, where populations are discrete and the wolf depends on only one prey species. Undoubtedly the low prey-predator ratio, 30 moose per wolf, also is important. In Mount McKinley National Park, where Murie (1944) concluded that wolves controlled the Dall sheep, there is an estimated 25 to 37 sheep per wolf (calculated from Murie). However, in areas where wolves do not control prey populations, the ratio is much larger. Figures from Cowan (1947) show that there are 300 to 400 head of big game per wolf in the Rocky Mountain national parks of Canada. Cowan concluded (p. 172) the following about predation in the area:
Under the existing circumstances the predators present, coyote, wolf, fox, lynx, wolverine, mountain lion, grizzly, and black bear, together are not taking the annual net increment to the game herds, nor even removing the cull group, a large part of which becomes carrion following death from disease, parasitism, or malnutrition.
In wolf-inhabited areas of Minnesota, there are about 153 deer per wolf (calculated from Stenlund, 1955), and Stenlund estimated that wolves were killing about 16 percent of the herd, much less than the annual turnover.
In British Columbia, Hatter (1950a) found that wolves could not control the irrupting moose population. Arnold (1954) reported that in Michigan, where deer greatly outnumber wolves, the wolves were not controlling the herd. In Alaska, Klein and Olsen (1960), found that deer-inhabited areas free from wolves are characterized by stable or slowly increasing populations exceeding carrying capacity; heavy winter mortality; and severely deteriorated range, whereas in wolf-inhabited areas, range and deer appeared to be in fair to good condition, with light winter mortality from starvation. The authors emphasized that factors other than the wolf may be involved.
Maintenance of a Healthy Herd
An obvious result of intensive predation on Isle Royale moose is the elimination of heavily parasitized, diseased, old, or otherwise inferior individuals. Since 14 of 36 wolf-killed adults (39 percent) showed debilitating conditions even though only bones were examined from most, it seems safe to assume that every adult killed is either inferior or a victim of some circumstance predisposing it to predation. This becomes especially evident when one considers that the 15 to 16 wolves tested an average of 13 moose for each one they killed while under observation (page 144). If this ratio applies from November 1 to May 20, when a calculated 146 moose should be killed, approximately 1,898 moose would be tested in that period and undoubtedly many others are tested during summer. Since the wolves travel to every part of the island (figures 46, 47, and 3, showing the foot trails used by wolves in summer), they should detect any weak or inferior moose in a short time. Culling benefits any population, but it probably is especially important to Isle Royale's dense herd. It may even be the reason that such a high population has survived. Inferior animals undoubtedly use food less efficiently and reproduce less effectively, so in a herd crowding its environment, these animals would be least desirable.
Research in several other locations has shown that predation on big game exerts a culling effect. Murie's classic study (1944) of wolves and Dall sheep proved this beyond question in Mount McKinley National Park. Although evidence from other studies is not as conclusive, collectively it strongly supports the hypothesis. Hibben (1937) found that all of the 11 puma-killed deer he examined were either ill-proportioned, diseased, parasitized, or otherwise significantly abnormal compared to 74 hunter-killed deer. Cowan (1956) reported that on Vancouver Island, British Columbia, domestic dogs preyed primarily on malnourished and heavily parasitized deer. In the Canadian Northwest Territories, Banfield (1954) studied the hunting techniques of wolves in caribou country and concluded that weak or inferior caribou would be among those most likely to succumb to the wolves' methods. Other results similar to these (Cowan, 1947; Peterson, 1955; Crisler, 1956, 1958) already have been discussed, as has work by Stenlund (1955) and Burkholder (1959), who found no evidence of a culling effect. However, one should remember that seldom are intact carcasses of wolf-killed animals available for examination, and even if they were, the psychological or behavioral factors that might predispose big game to predation still would go undetected.
A heavily cropped herd composed of healthy animals with sufficient food should reproduce vigorously. Probably one of the most sensitive indicators of a moose population's reproductive abilities is the twinning rate. Pimlott (1959b) summarized results of many studies, including his own, and found wide variation (2 to 28 percent) in rates of twinning; he also discussed the effect of nutrition on reproduction and concluded that "variations in adult fecundity may be caused by a number of nutritional factors that differ from one range to another." In Alberta and British Columbia, Cowan (1950) found that elk on overgrazed range had a twinning rate of less than 1 percent, whereas herds in better nutritive condition had a rate of 25 percent.
At present, Isle Royale moose appear to have one of the highest twinning rates reported. Of 53 cows seen with calves in the summer of 1959, 20 were accompanied by twins, a rate of 38 percent (figure 105). (If only 25 different cows were seen, the 95 percent confidence limits would be 19 percent and 57 percent.) In 1960, which appeared to be a year of unusually low production, the twinning rate was 15 percent, on the basis of 47 observations of cows with calves. (The 95 percent confidence limits would be 1 percent and 29 percent if 25 different cows were observed.) In contrast, in 1929 when wolves were not present and moose overpopulated the island, Murie (1934) observed that only 1 of 45 cows with calves was accompanied by twins.
Figure 105—Cow and twin calves in early September.
Future of the Wolves and Moose
Apparently the Isle Royale wolf population has increased to its maximum (under present conditions), for if it were going to increase further, it would have done so years ago. Numbers may fluctuate every few years, but probably there will be no significant variation. It seems likely that as long as the large pack remains on the island, the smaller groups will not breed. As individuals from these groups die of old age, the large pack may increase by a few members, although old animals from this pack may drop out and form other small groups; this also may stimulate breeding in the large pack. This is purely conjecture, however, for we know very little about the effects of pack interaction on breeding. Of course, emigration or immigration could complicate the whole situation. The most likely cause of variations in size of the wolf population probably would be a significant change in moose numbers.
The moose herd should remain stable for the next several years. Certainly if the wolves were going to deplete the population, they would have done so by now; instead they seem to have kept the herd within its food supply, culled out undesirable individuals, and stimulated reproduction. Indeed, the Isle Royale moose population probably is one of the best "managed" big-game herds in North America.
However, moose are dependent on the vegetation, and they flourish on earlier successional stages. Cowan et al. (1950) reported that, in British Columbia, moose numbers declined as the forest approached climax. These authors found that later successional stages supplied only about a third as much browse as earlier stages, and in regard to quality, they concluded (p. 249) the following:
There is an increase of carotene values and possibly of total mineral content in the vegetation on more advanced forest areas, but . . . in ascorbic acid content, ether extractives, total carbohydrates, and proteins, the vegetation upon the younger forest areas is superior to that on older areas.
One of the primary sources of winter browse on Isle Royale is the 1936 burn (figure 8), but the trees in much of this area are fast growing out of reach of the moose. Since modern fire detection systems make it improbable that many forest fires will escape in the future, it appears that within the next decade the moose population will decrease significantly, with a corresponding decline in wolf numbers. The level that either population will reach is unpredictable, but continued study of both wolf and moose throughout this period should prove highly enlightening.
| <<< Previous | <<< Contents>>> | Next >>> |
fauna/7/sec5.htm
Last Updated: 01-Feb-2016