|
NATIONAL PARK SERVICE
Visual Preferences of Travelers Along the Blue Ridge Parkway |

|
CHAPTER EIGHT:
SIMULATING AND EVALUATING MANAGEMENT PRACTICES
James F. Palmer, Timothy R. Day, Richard C. Smardon, Tad Redway, and Lawrence Reichardt
State University of New York
Syracuse, New York
This chapter reports on two further contributions of the State University of New York (SUNY) College of Environmental Science and Forestry to the Blue Ridge Parkway study. First, National Park Service (NPS) personnel were shown how to prescribe actual vegetation management practices for particular vistas. These management prescriptions were then translated into visual simulations. The visual simulations were incorporated into a questionnaire and distributed to respondents, as detailed in previous chapters and in Appendix B. Second, an independent statistical analysis of the responses to this questionnaire was conducted. These reactions were then interpreted for management purposes. Finally, the results of the historic analysis presented in Chapter 7 and a psychometric analysis of the data are combined into a set of recommendations for vegetative management near scenic vistas along the Blue Ridge Parkway.
Vegetative Management Simulations
Introduction to Simulation Procedures
This section describes the simulation procedures used for a viewer survey in which certain vegetation management techniques used by the National Park Service were simulated for the Blue Ridge Parkway. Many techniques are currently being used to simulate landscape change, ranging from sketches to computer-generated imagery. In this case, we used the technique of photographic montage, wherein photographs are altered by cutting out and pasting in new visual information.
Before any technique is used to demonstrate or predict vegetative modification, several critical questions should be addressed (Sheppard, 1982). How much realism is required? Can the change or proposed idea be sketched? Should the photography be in black and white or color? Is the budget adequate to meet the need?
Several techniques in photomontage are described in the Visual Resource Management (VRM) Manual published by the Bureau of Land Management (USDI, Bureau of Land Management, 1980) and in a paper presented by Stephen Sheppard (1979) at the Bureau of Land Management Computer Graphic Conference. While we found these descriptions helpful in deciding what technique to use, no examples in the literature describe a purely vegetal form of change such as the one encountered in the Blue Ridge Parkway Study. Sheppard's notes cover all of the two-and three-dimensional elements. However, there are no specifics related solely to vegetal materials.
Basically, change to the landscape involves four components: landform, vegetation, water bodies, and structures. Change may involve adding elements, subtracting elements, or both. The problems encountered in this project involved the selective addition and deletion of vegetation in the foreground of highly complex vegetated scenes. Thus, the problems were, perhaps, more difficult than the examples presented in the VRM Manual and will be discussed here in detail.
Simulation Process
Response Format/Visual Display. The first problem we addressed was the final product, because all other decisions depended on it. For this project the final product was determined to be standard 8" x 10" color photographs for ease in handling.
The next step was to determine the images that would be required to produce the final product. Two factors were of prime concern: (1) the visual impact of roadside vegetation on the Blue Ridge Parkway visitor and (2) the impact of management techniques utilized by the Park Service along the parkway.
Data Treatment. The 298 color slides taken along the parkway by University of Tennessee investigators were coded and classified (as previously described in Chapter 7) to determine representative scenes from parkway overlooks. The next step was to apply appropriate management techniques to each scene. To accomplish this task, advice from Park Service managers was sought.
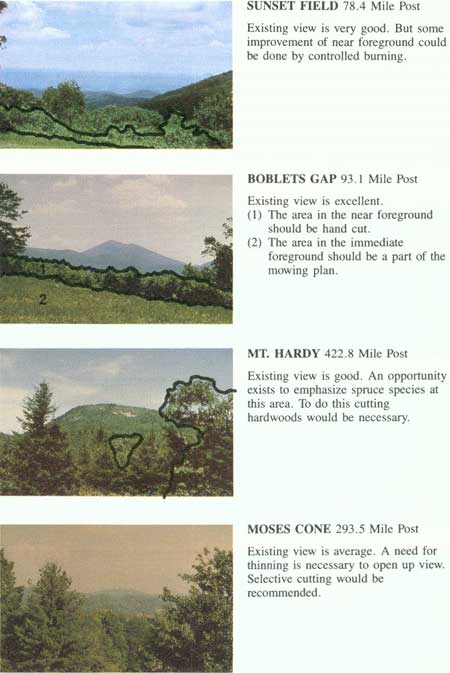
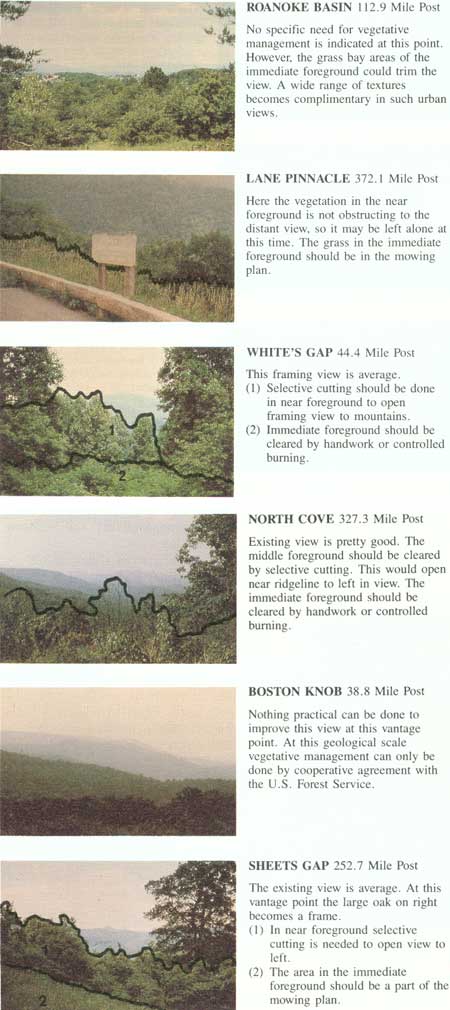
Each of the 10 representative scenes was printed, inserted into an acetate envelope, and sent, together with an acetate marker, to the Blue Ridge Parkway maintenance supervisor in Asheville, North Carolina. Comments and graphic delineations from the Park Service managers were drawn directly on the acetate overlays and returned. The managers identified three major management techniques common to the 10 representative scenes: first, mowing either by bush hog on accessible sites or by hand cutting; second, selective cutting of brush or trees to allow for significant views; and third, controlled burning in places inaccessible to machines (Figure 8.1).
|
| Figure 8.1. Examples of major management techniques represented in vista scenes. |
To conduct the simulation, three pieces of information were obtained:
United States Geological Survey (USGS) quadrangle maps for background topographical data, photographs taken from behind the vegetation to be removed or modified, and photographs snapped in front of the scene for contextual information. Photographs taken from behind vegetation are crucial because the three management techniques supplied by the Park Service involved eliminating vegetation by one means or another, which would reveal new vegetation, topography, or man-made form.
Another concern we addressed was seasonal variation. Some management techniques might have a significant impact on views in summer, but the impact on views in winter might be quite different. Possible procedures might be to consider proposed changes with different seasonal impacts or to choose the season with the highest visitation frequency, such as summer with vegetation in full leaf. In this case the latter procedure was used. It is important that simulations be made for the same season in which subjects will be responding to a photo questionnaire.
Specific Visual Simulation Techniques
Prototypical Scene Development. As stated before, the purpose of the project was to solicit visitor responses to certain NPS vegetation management techniques. After the representative scenes were chosen and comments were received from the National Park Service (summarized in Figure 8.1), each scene was analyzed to determine the appropriate montage technique. This was accomplished by overlaying the original 8" x 10" print with acetate and registering them with the USGS quadrangles to determine hidden topographic features. Ideas were tested using markers, as illustrated in Figure 8.2.
|
| Figure 8.2. Acetate overlays on 8 in. x 10 in. photos were used to determine the appropriate montage technique to be used. |
After the appropriate montage technique was selected and done, the 8" x 10" finished photomontages were photographically reduced to 2" x 3" size for inclusion in the questionnaire (Appendix B). Three pages with six images per page were prepared. Each page contained the before and after images of our scenes, and each photograph had a brief caption and rating scale beneath it. Consequently, the respondents were able to compare the before and after photos of each scene and give us their ratings of the various vegetation management techniques.
The following sections describe the materials and methods we employed during the course of our photographic montage work, the problems we encountered, and the techniques and materials we found most suitable for meeting our purposes. Use of trade names does not imply endorsement of commercial products by either the U.S. Government or the State University of New York.
Products and Processing Attributes and Constraints. The Image Library, furnished by University of Tennessee researchers for this project, consisted of slides, so we used manufactured products that were designed to produce direct prints without reshooting. The three products we used included Ilford's Cibachrome processing (Ilford, 1974; and Ilford, undated) for color prints on glossy paper, which has a synthetic composition backing; Cibachrome in a matte finish with a paper backing; and Kodak's Ekta-Print processing (Eastman Kodak, 1981 and 1982). Time, equipment availability, and familiarity with these products influenced the decision of which product to use. Each product, however, contains different properties relevant to most montaging techniques.
While camera-ready graphics dictate that photographs be glossy to obtain the highest resolution possible, the Cibachrome's glossy synthetic backing presented a problem. To avoid undesirable white edges in a "cut and paste" image application, we found it necessary to strip the backing from the emulsion layers. The Cibachrome glossy is difficult, if not impossible, to strip. Another limitation of the Cibachrome glossy is that fingerprints are difficult to remove after much handling.
The Ekta-Print processing promised to be advantageous in terms of development time, but image quality and exposure latitude proved to be major limiting factors. Thus, because of the limitations of these two products for our purposes, it was decided to use Cibachrome's matte finish material, which provided adequate image quality and exposure latitude and allowed for stripping the backing.
Because we were already set up for printing from slides, the 8" x 10" simulations were rephotographed onto slides and printed at the required 2" x 3" camera-ready size. The slides were printed on Polaroid's 690 print paper using a Vivitar slide copier since this print size was very close to the final product size desired.
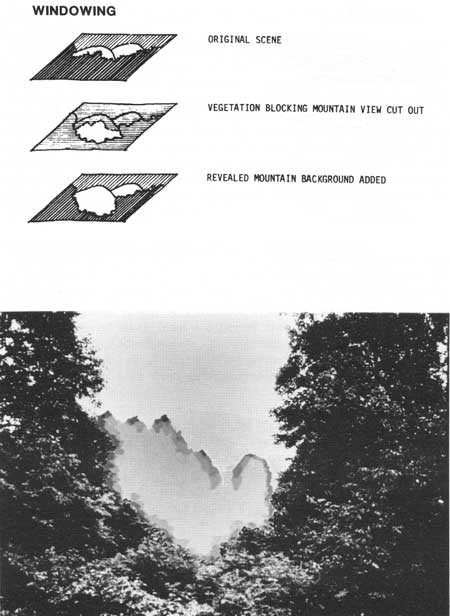
Simulation Development Techniques. Several methods and media were used to develop the simulations. The first and most commonly used technique was "cut and paste." Depending on the amount of change required, two approaches were used. First, in relatively small areas—for example, a bank of large shrubs that needed to be eliminated and replaced with smaller shrubs or grass while providing appropriate background material—a technique called "windowing" was performed (Figure 8.3). This involved cutting out the material to be changed, stripping the backing 1/4 in. or so from the hole, applying cement to edges, and registering and applying the new material to the back.
|
| Figure 8.3. Demonstration of the "windowing" technique to remove small areas of vegetation from a vista scene. |
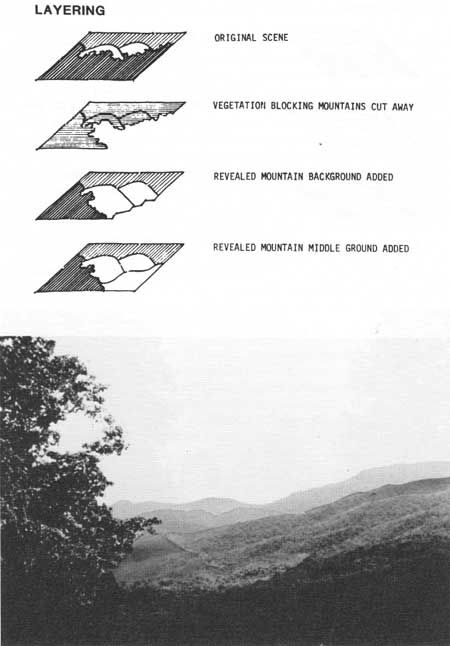
When relatively large areas of the image, such as a tree mass, mountains, or sky, needed to be altered, a technique we called "layering" was used (Figure 8.4). Again, we simply trimmed away the material to be changed, stripped the backing from the edge to be retained, and cemented new material in place.
|
| Figure 8.4. Demonstration of the "layering" technique to remove relatively large areas of vegetation from a vista scene. |
The next most common technique we used was called "coloring." In our project, use of coloring was confined to "touch-up." Surprisingly, the "marker" variety of color application proved quite successful for sky and mountain touch-up, but only in small areas where the usual "blobbing" problem with markers can be discreetly hidden behind black or dark areas. We also tried color pencils to blend existing and new vegetation but without significant results. However, in some instances the pencils worked quite well in adding texture and shadow to background mountains.
Color dyes matched to the Cibachrome print material seemed to work best for touch-up in most instances (Ilford, 1983; and Ilford, undated). The kit, manufactured by Cibachrome, is essentially a water-based activated dye that penetrates the emulsion layers of the print material when applied by brush. The primary advantage of the dyes over the markers is the control over the amount of color placed in contact with the print through the use of a fine-tipped artist's brush. The dyes are particularly well suited for vegetation where textural addition is needed to mask splices, and since dyes are water-soluble, a mistake can be corrected by simply washing off. The dyes seemed to work equally well on the Polaroid and Cibachrome material.
Discussion
Perhaps the most basic problem in our photomontage project was that of obtaining new vegetation material. Whenever possible, we used material from a second print of the scene and rearranged it to suit the goal of the simulation. It was very difficult to exactly match the texture and color of material taken from a different scene.
During field reconnaissance, photographs of vegetation surrounding the view in areas with similar viewing positions and lighting were taken so that materials seen from an appropriate distance were available for matching when needed.
Related to this problem was the issue of perspective. All scenes we dealt with were views taken from ridge tops with slopes falling rapidly away from the viewer position. Whenever material was taken from a different scene, it was crucial to match the topography as closely as possible.
Finally, while many yardsticks can be used to measure the success of any project, one that might be applied here is the ease with which the process might be duplicated. Simulation projects such as this one have traditionally fallen to highly skilled artists, often with very sophisticated technology. The attempt here was to produce high quality simulations using average skills, methods, and technology commonly found in professional offices or schools with access to darkroom facilities.
Visual Preference Evaluations
The ratings of how much the respondents liked the
simulated effects of management alternatives are summarized in Table
8.1. The sites have been grouped according to the general management
practice they represent. The mean values  represent the
difference between the ratings for the less managed or control condition
and the more managed or treatment condition. Therefore, a negative value
represents visual improvement and a value of zero indicates no change in
visual quality. A t-test was used to identify those cases where the mean
change is significantly different from zero. The mean differences and
t-tests are reported for those who received the information leaflet and
those who did not. A paired comparison t-test was used to identify
significant differences between the mean change in ratings for these two
groups.
represent the
difference between the ratings for the less managed or control condition
and the more managed or treatment condition. Therefore, a negative value
represents visual improvement and a value of zero indicates no change in
visual quality. A t-test was used to identify those cases where the mean
change is significantly different from zero. The mean differences and
t-tests are reported for those who received the information leaflet and
those who did not. A paired comparison t-test was used to identify
significant differences between the mean change in ratings for these two
groups.
Table 8.1. Mean change in visual preference ratings for simulated management situations.
| Condition | Site | With Leaflet |
Without Leaflet |
Paired-t | ||
| X1 |
t | X1 |
t | |||
| Mowing width | 1 | 1.57 | 10.4*** | 1.72 | 11.7*** | -.7 n.s. |
| 2 | 1.32 | 9.0*** | .95 | 5.9*** | 1.7 n.s. | |
| 3 | .21 | 1.2 n.s. | -.29 | -1.7 n.s. | 2.1* | |
| 6 | 1.03 | 6.4*** | .47 | 2.7** | 2.4* | |
| 7 | -1.50 | -10.1*** | -1.19 | -7.3*** | -1.4 n.s. | |
| 9 | 1.00 | 5.8*** | .64 | 3.4*** | 1.4 n.s. | |
| Mowing frequency | 8 | .13 | .8 n.s. | -.45 | -3.0*** | 2.6** |
| Sign mowing | 4 | -1.71 | -10.7*** | -2.36 | -18.1*** | 3.1** |
| Major clearing | 10 | -1.89 | -14.5*** | -.2.13 | -17.7*** | 1.4 n.s. |
| 12 | -.30 | -1.8 n.s. | -.16 | -1.0 n.s. | -.6 n.s. | |
| 13 | -.06 | -.4 n.s. | -.23 | -1.3 n.s. | .7 n.s. | |
| 16 | -.2.57 | -23.4** | -2.55 | -24.7*** | -.1 n.s. | |
| Moderate clearing | 11 | -.32 | 2.1* | -.31 | -1.9 n.s. | -.1 n.s. |
| 14 | 1.53 | 11.2*** | 1.36 | 9.8*** | .9 n.s. | |
| 17 | 1.35 | 9.6*** | 1.18 | 7.9*** | .8 n.s. | |
| 18 | .35 | 2.5* | .25 | 1.7 n.s. | .5 n.s. | |
| Controlled burning | 1 | 1.35 | 9.1*** | 1.19 | 7.7*** | .8 n.s. |
| 15 | -.19 | -1.1 n.s. | -.17 | -1.0 n.s. | -.1 n.s. | |
***p<.001 **p<.01 *p<.05 n.s. denotes p≥.05
1The mean difference is a less managed or control condition rating, minus a more managed or treatment condition. Negative values indicate visual improvement. | ||||||
In addition, an analysis of variance model (reported in Table 8.2) was used to investigate the effects of these factors. Among the effects incorporated into these models is "activity," or the significance of the change in rating from the control (photo a) to the treatment (photo b) condition. The "information" effect refers to the difference between those who did and did not receive the interpretive message (see Becker, et al., Chapter 6). In a sense, each of the simulated sites is a repeated measure of a particular management activity. Collectively, they represent the visual variation of using these practices in the landscape. This variation is represented by a "site" effect. For the analysis of vista clearing, a second model grouped the sites into clearing activities of major and moderate intensity. All possible two-way interactions were also included in these models.
Table 8.2. Effects of management activity, information and site ratings of visual preference.1
| Management Action | Effects | df | F-value |
| Mowing width | Activity | 1 | 595.4*** |
| Information | 1 | 6.2* | |
| Site | 5 | 10.1*** | |
| Info + Activity | 1 | 23.5*** | |
| Info + Site | 5 | .4 n.s. | |
| Activity + Site | 5 | 40.5*** | |
| Controlled burning | Activity | 1 | 69.6*** |
| Information | 1 | .2 n.s. | |
| Site | 1 | 2.4 n.s. | |
| Info + Activity | 1 | .5 n.s. | |
| Info + Site | 1 | .1 n.s. | |
| Activity + Site | 1 | 140.8*** | |
| Vista clearing between sites | Activity | 1 | 92.8*** |
| Information | 1 | .1 n.s. | |
| Site | 7 | 13.2** | |
| Info + Activity | 1 | 1.2 n.s. | |
| Info + Site | 7 | .2 n.s. | |
| Activity + Site | 7 | 295.5*** | |
| Vista clearing by major and moderate treatments | Activity | 1 | 81.9*** |
| Information | 1 | .1 n.s. | |
| Intensity | 1 | 46.3*** | |
| Info + Activity | 1 | 1.1 n.s. | |
| Info + Intensity | 1 | .3 n.s. | |
| Activity + Intensity | 1 | 969.7*** | |
***p<.001 **p<.01 *p<05 n.s. denotes p≥.05
1Among the effects incorporated into the analysis of variance models, activity refers to control (photo a) and treatment (photo b) conditions. Information refers to those who did or did not receive the information leaflet. Site refers to those sites simulating the activity; in a sense these are simulation repetitions or repeated measures of the management activity. Intensity regroups the vista clearing sites into major and moderate clearings. The two-way interactions are also indicated. | |||
The pattern of visual preference for mowing alternatives is very similar between the two groups. Overall, respondents preferred the control or less mown condition. The major exception was a preference for mowing vegetation around a low road sign (site 8). The treatment in site 7 also received a very positive rating. However, this may be because the two photographs were of distinctly different sites.
Significant differences were found between the mean change for these two groups at half the sites, which is similar to the influence among the mowing management statements. This result was supported by a significant effect in the analysis of variance model for mowing width, as well as the t-tests for mowing frequency (site 8) and mowing around road signs (site 4). In all these analyses, the interpretive message was associated with preference for reduced mowing activity. This effect was accentuated among those who received the message, accounting for the significant interactive term (Becker, et al. Chapter 6).
The most significant effect in the analysis of variance model for mowing width concerns the change at each site from a more intensive management practice. As has already been described, respondents generally support less intensive mowing. The actual variation among the sites was also highly significant, possibly indicating the relative difference in treatment intensity between photos at a particular site as well as the visual sensitivity of different sites to management practices. The significant interaction between activity and site was attributable to the essential lack of difference between the photographs at site 3.
The overall preference for the visual effects of vista management practices is clearer, though different, than it was for mowing practices. Cutting activity that removes large amounts of woody vegetation from an overgrown vista to establish an open view was preferred. However, the respondents did not appear to support cutting when the vista was only slightly blocked or when a significant area of residual vegetation is left that still blocked the view. This result seems to support responses to the management statements, where cutting was supported every 5 to 7 years (seemingly a long time) over annual clearing or clearing before one-third of the view is blocked. Controlled burning also received poor ratings, particularly in the case where there was little change in the vista's extent. Finally, there were no significant differences between the two groups, indicating that the interpretive message had no effect. This may be because the message focused on mowing, and the effect failed to carry over to tree clearing. Alternately, it may be because respondents already had a clear position on vista management that is based on a cultural reticence to cut down trees but a strong visual preference for vistas.
These findings are supported by the analysis of variance results. The actual change in evaluation from the pre- to post-activity was highly significant. In addition, when they were collapsed into major and moderate intensity groups, the results were again highly significant. We also found a highly significant interaction effect between the activity and site or intensity factors. Essentially, this represents a strong preference for major clearings and a perceived undesirability of only modest clearings. The controlled burning analysis exhibited a similar pattern for activity and the interactive term.
Summary and Management Recommendations
Bio-Physical and Historical Management Recommendations
Any vegetative management technique should be preceded by a thorough analysis of the goals and objectives to be accomplished. Since the primary object of this research involved the human cultural aspect of viewing from the Blue Ridge Parkway, a number of physical parameters should be considered. Basically, viewing from the Blue Ridge Parkway involves two major components: the position of the viewer and the scene to be viewed. Viewer position generally refers to either viewing at a scenic overlook while standing or sitting, or viewing along the road while in a moving car. The speed of the car and the road configuration are also important because an impressive view is more likely to be seen while on a straight road at a low speed than on a curve except by a passenger. The amount of vegetation to be removed should be determined not only by what is viewed but whether the viewer is moving or standing still.
The major management constraint on the scene to be viewed is not only the vegetation, but also the underlying topography. Most of the Blue Ridge Parkway is located along relatively steep slopes or on ridge tops. This means the major long views contain foregrounds that slope away from the viewer. The management techniques utilized—controlled burning and cutting or mowing—are effective especially in preventing severe erosion on steep slopes and in soils that are largely thin, well-drained, and of low fertility. However, because the climate is highly conducive to plant growth, sites of prime viewing require constant care. Basically, any native plant material considered for revegetative purposes should be self-maintaining and physically and microclimatically appropriate to the area and the surrounding vegetal context of the view and the slope on which it is placed.
Environmentally, any plantings of native perennial vegetation should use those species that contain certain characteristics. First, since most soils on steep slopes and ridges are thin and low in nutrients, the plants should be shallow and fibrous-rooted and have the ability to absorb and hold nutrients for extended periods of time. Second, since the climate is humid and temperate and the rainfall is abundant, the plants should be able to withstand the potential erosive effects of heavy snow, and sedimentation.
Physically, any native plants selected for revegetation should be complementary in terms of form, size, and texture to the surrounding site context. Even more importantly, the height of the plants should be self-maintaining and predictable, since placement on a given slope with respect to the viewer position is crucial in maintaining the desired view. Native grasses such as broomsedge could be used in near foreground areas, but if the slope falls away sharply, native shrubs could be used. Again, consideration should be given to the first two basic elements—the viewer position and the scene to be viewed.
Perceptually-based Management Recommendations
Our perceptually-based results support roadside mowing every three or four weeks when the grass becomes about 8 in. tall. Mowing should extend to some natural break close (within a couple mower widths) to the road's edge.
Annual maintenance and maintaining a 66% (or two-thirds) openness of vistas are equally preferred, so it would make sense to wait 5 to 7 years before trimming or cutting shrubs that would block distant views. Cutting that removes large amounts of woody vegetation from an overgrown vista is supported, but it is not supported when the vista is only partially blocked or when significant residual woody material would be left to partially block the view. In other words, we do not support cutting unless there is potential for creating substantial increased visual access or open views. Controlled burning is also not supported unless it shows potential for improvement in vista quality and extent.
Synthesis
The above summarized perceptual results regarding roadside mowing and vista maintenance speak for themselves. In addition, our analysis shows greater support for vista maintenance than for roadside mowing. The major synthesis would be the combination of periodic mowing of roadsides and brush clearing of vistas with introduction of native plant species that either (1) maintain low height and uniform texture or (2) are historically representative of past vegetation management practices at suitable locations. The latter would be especially appropriate near interpretive areas and facilities.
The question of the total mix of vegetative management over the length of the parkway is more difficult. Since our study dealt primarily with static images and simulations, we would propose that questions involving spatial sequences of visual experiences need sequential and dynamic simulation. One possibility for future research would be to simulate moving sequences of vegetative management changes along the Blue Ridge Parkway, utilizing video with different simulation media such as scale models, computer-assisted graphics, or electronic photomontage (computer and video) to illustrate different management alter natives in a "real time" sequence.
REFERENCES
Eastman-Kodak. 1981. Making Color Prints with Kodak Ectaflex PCT Film and Paper. New York: Eastman-Kodak Company.
Eastman-Kodak. 1982. Using Your Kodak Ectaflex Printmaker Model 8. New York: Eastman-Kodak Company.
Ilford, Inc. 1974. Cibachrome Color Print Manual. Ilford, Inc.
Ilford, Inc. 1983. Retouching Cibachrome II Materials. Technical Brochure TB34EN, Ilford, Inc.
Ilford, Inc. Retouching Cibachrome Tips and Hints. Ilford, Inc., undated.
Sheppard, S.R.J. 1979. The computer, the artist and the landscape architect. Presentation notes to the Bureau of Land Management Computer Graphics Workshop. Denver: The Conference.
Sheppard, S.R.J. 1982. Predictive landscape portrayals: a selective research review. Landscape Journal 1: 9-14.
Time-Life, Inc. 1981. Photographer's Handbook Revised Edition. New York Life Library of Photography, Time-Life Books, Inc.
U.S. Department of the Interior. 1980. Bureau of Land Management. Visual Simulation.. Washington U.S. Government Printing Office.
Winer, B.J. 1971. Statistical Principles in Experimental Design. New York: McGraw-Hill Company.
| <<< Previous | <<< Contents >>> | Next >>> |
chap8.htm
Last Updated: 06-Dec-2007