|
NATIONAL PARK SERVICE
The Secret of the Big Trees |

|
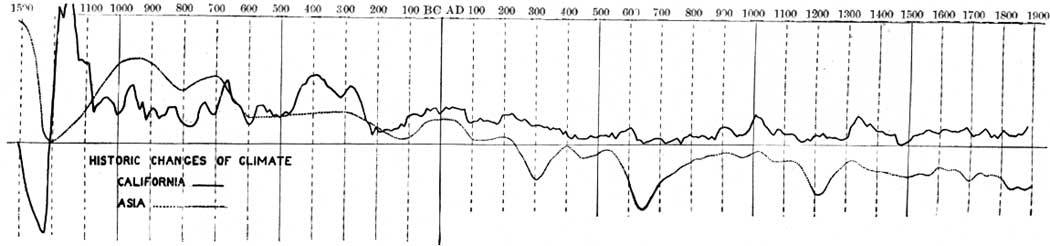
The accompanying diagram sums up the results of our work on the big trees as compared with the results of work of an entirely different kind upon the climatic fluctuations of Asia. Horizontal distance indicates time; the diagram begins at the left-hand end with 1300 B. C.. and ends on the right with 1900 A. D. Vertical distance indicates a greater or less amount of rainfall or more or less favorable conditions of plant growth. The solid line is the curve of the sequoias. During the periods where it is high, abundant moisture stimulated rapid growth; where it is low, periods of aridity lasting often for centuries checked the growth of the trees. The other curve, the dotted line, is reproduced unchanged from the author's volume on "Palestine and its Transformation." It represents the state of our knowledge of the changes of climate of western and central Asia at the time when that volume was written in 1910. The evidence upon which it is based is of very diverse types, and varies greatly in accuracy and abundance at different periods. For example, the low portion of the curve about 1200 B. C. is based on records of ancient famines, and upon the fact that at that time great movements of desert peoples took place in such a way as to suggest that the deserts had become much less habitable than formerly. A few hundred years later the curve is high, because at this time not only did great prosperity prevail in regions which are now poverty stricken for lack of rainfall, but the kings of Assyria and the other countries lying near the Arabian Desert appear to have been able to take their armies in comparative comfort across regions where small caravans can not now pass, and which even the hardy Arab raiders avoid. At a later time, 300 A. D., the curve drops low, because at this period a great number of towns were abandoned in central Asia and in all the drier parts of the Continent; trade routes which had formerly been much frequented were absolutely given up in favor of those where water and forage were more easily obtained; and in countries like Syria stagnation seems to have prevailed, as is indicated by the scarcity of building operations during these years. The curve dips low at this point simply because evidences of aridity began to be conspicuous; but probably it dips too low, for there is as yet no means of obtaining exact data. In the seventh century A. D. evidence of the same kind as in the third causes the curve to drop still lower, but here we have additional proof of aridity in the form of traditions of prolonged famines in Arabia. Moreover, at about this same time the waters of the Caspian Sea and of other lakes without outlets were not replenished by rain, and hence fell to a level so low that buildings were built upon what is now the bottom of the lake. Then, at a later date, about 1000 A. D., the ruins in the desert were partially reoccupied, the old trade routes began to revive, the lakes rose higher than their present level, and prosperity was the rule in many regions which had formerly suffered from aridity. These bits of evidence, gathered here and there, have enabled the curves to be drawn, but accuracy is as yet out of the question. At most the curves are a mere approximation, showing some of the main climatic pulsations, but likely to be greatly modified as further investigation is made. On the whole there are indications that further knowledge of the Asiatic curve will prove that it is much more like the California curve than now appears. Yet in the main the two curves even now show a considerable degree of agreement, and in that agreement lies the strongest evidence that both are correct in principle, although they may be wrong in detail.
|
|
DIAGRAM SHOWING
HISTORIC CHANGES OF CLIMATE IN CALIFORNIA AND ASIA.
(click on image for an enlargement in a new window) |
Let us begin at the left-hand end far back at the time of the Trojan War. There, about 1200 B. C., both curves drop very low, indicating an epoch of sudden and severe desiccation. That particular period, historians tell us, was one of the most chaotic in all history. The warlike progenitors of the Greeks swarmed into the country where they were later to grow great, the Mittani or Hittites came down out of the mountains into northern Mesopotamia, tribes from Arabia and the Libyan Desert swarmed into Egypt and brought civilization down to the lowest possible ebb, famines such as that in the days of Joseph appear in the Egyptian chronicles, the lands surrounding Arabia on the north and northwest were swamped by the great Aramean invasion, and, in general, war, migrations, and disaster prevailed. If America was then inhabited we can scarcely doubt that similar disasters took place there; for, if the trees are to be trusted, vast areas in dry regions such as Mexico and the southwestern part of the United States, the only places where dense agricultural populations could have dwelt, must have fallen off tremendously in productivity.
Some fluctuations of the California curve, such as the upward bend between 1000 and 1100 B. C., are missing in that for Asia not necessarily because they did not exist, but more probably because no facts yet happen to have been lighted upon which furnish evidence of them. The famine in the days of Elijah appears in both curves. Apparently at that time the climate did not become extremely dry, nothing like so bad as it had been a few hundred years earlier during the twelfth century, but there was a rather distinct falling off in the amount of rainfall as compared with the uncommonly good conditions of the preceding century. About seven hundred years before Christ both curves stand high in the day when the Greeks were laying the foundations of their future greatness and the empires of Mesopotamia were at their height. Then comes a pronounced falling off, with a recovery three or four hundred years before Christ, another decline culminating about 200 B. C., and a recovery reaching a high point about 50 B. C. The time of Christ, the great era of universal peace under the sway of Rome, was apparently an epoch of favorable climate, a time of abundant rain and consequent good crops in all the countries around the Mediterranean Sea and eastward in Asia, as well as in California. Next comes a long period of decline culminating six or seven centuries after the time of Christ. The sudden drop of the Asiatic curve about 300 A. D. is probably exaggerated, as are those from 550 to 650 A. D. and in 1200. Nevertheless, there can be little question as to the general agreement of the two curves in showing that an epoch of extraordinary aridity reached its climax in the seventh or eighth century of our era, and that another period of aridity occurred in the thirteenth century. Previous to the seventh century the Roman world had been in the direst straits because of the invasions of barbarians, driven from their homes, it would seem, by increasing aridity and the consequent difficulty of obtaining a living. Then, toward the end of the long period of drought, there occurred the tremendous outpouring of the Arabs, unified by Mohammedanism, as us universally agreed, and also spurred by hunger, as we infer from a study of climate. Thus the Dark Ages reached their climax. No period in all history, save that which centers 1200 B. C., was more chaotic; and that early period also appears to have been a time of greatly diminished rainfall.
|
|
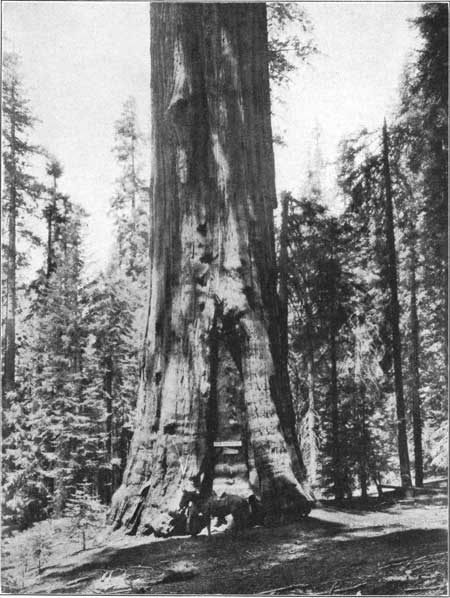
GENERAL SHERMAN,
GIANT FOREST, SEQUOIA NATIONAL PARK.
Height, 286 feet; diameter. 36 feet. |
It is impossible here to trace further the correspondence of the two curves and their relation to history. The essential point is this: By means of a rigid mathematical test we have worked out the climatic changes of California. From ruins, lacustrine strands, traditions, famines, and many other lines of evidence we have worked out the changes in Asia. Thus by methods absolutely dissimilar we have constructed curves showing climatic fluctuations in parts of the world 10,000 miles apart. In essentials the two agree in spite of differences in detail. It therefore seems probable not only that climatic pulsations have taken place on a large scale during historic times, but that on the whole the more important changes have occurred at the same time all around the world, at least in the portion of the north temperate zone lying from 30° to 40° north of the Equator. This, in itself, does not prove that great historic changes have occurred in response to climatic pulsations, but it goes far in that direction. It introduces a new factor into that most profound and far-reaching of the problems of history—the cause of the rise and fall of nations.
| <<< Previous |
huntington/sec6.htm
Last Updated: 12-Feb-2007