|
Kenai Fjords
A Stern and Rock-Bound Coast: Historic Resource Study |

|
Chapter 9:
COMMERCIAL FISH AND SHELLFISH HARVESTING
|
| Map 9-1. Historic Sites-Commercial Fishing. (click on image for an enlargement in a new window) |
The Kenai Fjords coastline is rich with marine life. Many species of fish and shellfish inhabit the area's streams, fjords, and pelagic zones. Relatively few species, however, have been harvested for commercial purposes. Prior to the 1960s, the only species of interest to commercial fishers have been various species of salmon, halibut, cod, and herring. In recent decades, fishers have harvested a variety of new species, including species of crab, shrimp, scallops, and octopus. Halibut and cod, as a rule, have been harvested in the open ocean, 30 to 60 miles south of the park coastline, while the remaining fish and shellfish species have been gathered along or near the coast.
The streams of Kenai Peninsula's southern flank are shorter than those that flow into Cook Inlet. For this and other reasons, salmon (particularly red salmon) and other commercially viable fish and shellfish have never been as plentiful in this area as they have been either in Cook Inlet or Prince William Sound. Inasmuch as commercial fishing along the peninsula's southern coastline did not take place until fishing was a well-established industry in both Cook Inlet and Prince William Sound, the park's fishing history will be told within the context of developments in these adjacent areas.
This chapter will concern itself primarily with the area's commercial fisheries. A history of the park area's twentieth century subsistence fishery is described in Chapter 6, while the sport fishery is covered in Chapter 10.
The Southern Kenai Peninsula Salmon Fishery,
1911-1945
Not long after the United States government purchased Alaska from the Russian government, West Coast commercial fisheries interests began to exploit Alaska's untapped fisheries populations. They had, by this time, been harvesting the salmon populations of Washington territory and the province of British Columbia for some time. Before long, fishing companies began to eye Alaska's seemingly unlimited salmon resource.
Early Cook Inlet Salteries and Canneries
In 1878, Alaska's first two salmon canneries were established. Both were located in southeast: one was near Sitka, the other at Klawock, on Prince of Wales Island. That same year, commercial salmon interests first took advantage of Cook Inlet's rich fisheries resource; the Alaska Commercial Company (ACC), which operated a fur trading station near the mouth of the Kenai River, established a salmon saltery at the site. Captain James Wilson, the station agent, was in charge. A year later, a second salmon saltery was established at the Western Fur and Trading Company's fur trading station at the mouth of the salmon-rich Kasilof River, some 12 miles south of the ACC saltery. Captain H. R. Bowen operated both the trading station and saltery. During the same period, the first saltery was opened on Kodiak Island; it was located on Karluk Spit, along the island's southwestern coast. [1]
Other nearby fisheries developments followed soon afterward. In 1882, the first two salmon canneries in Central Alaska were built; the Alaska Packing Company of San Francisco built a cannery at Kasilof, while Smith and Hirsh built a cannery at Karluk Spit. The following year, the Alaska Commercial Company opened its second Cook Inlet salmon saltery; it was located at English Bay, where the company had operated a fur station since the early 1870s. [2]
Between the late 1880s and the late 1890s, new canneries were built in several areas adjacent to the southern Kenai coast. In 1888, four canneries were built on Kodiak Island and one at Kenai. A year later, the first Prince William Sound canneries were built (four were constructed there that year, all on the sound's eastern shore), and five additional canneries were erected on Kodiak Island. In 1890, a new cannery was constructed at Kasilof, and in 1897 another cannery arose at Kenai. In 1899, the first cannery was constructed on Cook Inlet's western shore; it was located at Tyonek. By 1900, therefore, scattered salmon canneries were located northwest, south, and east of the present park boundaries; all, however, were located more than a hundred miles away. During this period, the sockeye (or red) salmon was the only valuable salmon species; the early canneries, therefore, were located near sockeye-laden streams. Few were interested in the southern Kenai fishery, where pink and chum salmon species predominated. [3]
Few new canneries were constructed during the first decade of the twentieth century. The decade that followed, however, witnessed new growth in the fishing industry, and for the first time, canneries were constructed just a few miles away from the present park boundaries. In 1911, the Seldovia Salmon Company built the first cannery in Lower Cook Inlet; it was located at Seldovia, a town that had been in existence for more than 30 years. In 1912, the Fidalgo Island Packing Company built a cannery at Port Graham, and three years later a cold storage facility (for cod and halibut) was constructed at Portlock. Eight years later, the Arctic Packing Company built a cannery at English Bay. Seldovia and English Bay were long-established area villages; Port Graham and Portlock, however, were unpopulated sites before facilities were erected there. Canneries remained at most of these locations until the 1950s, if not longer. [4]
The Resurrection Bay Fishery
During the same period that witnessed the first canneries in Lower Cook Inlet, commercial salmon processing facilities were pioneered in Resurrection Bay. In 1911, Charles F. Boggs established a salmon saltery in Seward. Boggs, along with partner Alfred Rosness, operated the saltery in 1912 but closed it thereafter. [5] During 1915 and 1916 new salteries popped up on the east side of Resurrection Bay, at Caines Head, and at Sunny Cove on Renard Island; all were small in scale, and none lasted more than a few years. [6]
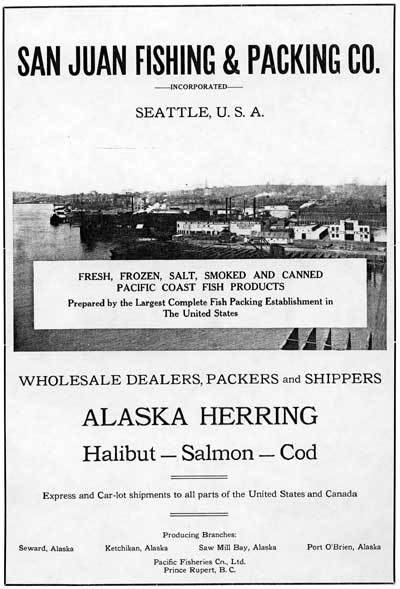
Canneries were also in the works. In 1912, former Seward resident Henry H. Hildreth headed a group that proposed a salmon cannery at Caines Head. The group also planned to construct a saltery at Porcupine Cove, recognizing that nearby Bear Glacier would be an excellent source for ice. But neither facility was built. [7] A more successful proposal was made by the San Juan Fishing and Packing Company. [8] Officials from that company arrived in Seward in November 1916; construction of a cannery and cold storage plant, located at the foot of Jefferson Street, began in January 1917. It was ready by the time salmon season commenced in mid-June. [9] Cannery management stated that in addition to canning salmon, they planned to freeze halibut, salmon, black cod and red snapper.
|
|
| The "San Juan plant" was Seward's largest cannery from 1917 to 1930. Pacific Fisherman Year Book, 1921, 104. |
For most of the next forty years, a salmon cannery operated in Seward. The so-called San Juan plant, using traps [10] as well as company-owned purse seiners, canned salmon only until 1921; for the rest of the decade, salmon was only an incidental part of an operation that was geared toward halibut processing. (Few black cod or red snapper were ever processed there.) Just a year after the San Juan plant de-emphasized its salmon canning operations, the Kodiak Island Fishing and Packing Company established a Seward plant. The cannery, however, operated for only the 1922 and 1923 seasons. [11] Fisheries interests were forced to conclude that the Resurrection Bay salmon supply was (in the words of one government report) "insufficient for the profitable operation of a cannery." In order to augment the salmon harvest, the Territory of Alaska built a hatchery at Grouse Lake (eight miles north of Seward) that opened in late 1924. Red, king, and pink salmon were raised. A fire, however, destroyed the hatchery in March 1927. It was not rebuilt. [12]
In 1929 a new plant, called Seward Fisheries, Inc., appeared on the scene. Owned by Nils Hagen and three associates, it was located just south of town and was described as a "smaller fish-processing plant;" fish were butchered by hand but packed by machine. The facility operated until 1934; it then lay idle for two years until it was reopened as the Hagen and Company plant. The new, improved plant was fully mechanized; government observers, however, noted that the facility was still just "a small one-line cannery." [13] The Hagen and Company plant operated until the end of World War II. [14]
When the San Juan plant opened in 1917, officials had announced that even though the company had three purse seiners, it would process all fish delivered to the plant. Such an invitation, which was tendered by canneries throughout the territory, encouraged the growth of a local, independent fishing industry. Before the San Juan plant opened, Seward-area fishers were probably limited to those who were involved in the early salteries (noted above), plus occasional entrepreneurs who sold their catch directly to local residents. The presence of a cannery, however, attracted a sufficient number of Seward-based fishing vessels that by the late 1920s, the Federal government had agreed to construct a small boat harbor. The Corps of Engineers constructed the harbor during the summer of 1931. [15]
|
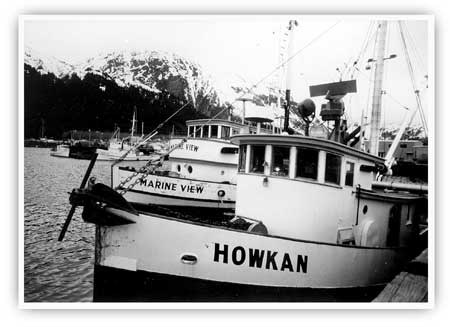
| Boats based at the Seward small boat harbor (such as those moored in this mid-1970s view) have played a major role in the fishing history of the nearby fjords country. M. Woodbridge Williams photo, NPS/Alaska Area Office print file, NARA Anchorage. |
The number of fishing vessels, never large, varied from year to year; in 1933, for instance, the Seward Gateway noted that the local fleet consisted of the M.S. Marian, the M.S. Roy, the M.S. Mayflower, the M.S. Bavaria, and several power dories. (The first four motor ships were independently owned; Seward Fisheries owned the dories.) Henry Munson, a longtime local resident, recalled that during the 1930s "there were about a dozen boats fishing in the bay;" a wartime report concurred with Munson's estimate, noting that "about 12 fishing boats are normally based in the Seward harbor." [16] During the early years of the fishery, the primary techniques used were either beach seines or hand purse seines. By the mid-1920s, however, these methods had been replaced by gill nets; during the 1930s, gill nets and power dories harvested the bay's fish. The summer fishing season typically began in early June and lasted until August 10; the fall season began ten days later and stayed on until September 10. [17]
The Regulatory Environment
Early Alaska salmon processing was carried on in a virtually laissez-faire environment. But by the early 1920s, it had become increasingly clear that commercial interests had overfished and abused many of Alaska's primary salmon fisheries. Governmental authorities, as a result, began to regulate some of the territory's prime salmon fishing areas. The first such action took place in 1922 when three fisheries reservations were established; one of the three, the Southwestern Alaska Fisheries Reservation, included waters just west of the southwestern Kenai Peninsula. The following year, more widespread changes began. The U.S. Bureau of Fisheries subdivided the territory into management districts; the area west of Gore Point was included in the Cook Inlet district, while the area east of Gore Point was included in the Prince William Sound district. [18] The reservations created in 1922 remained in force until June 6, 1924, when Congress passed the so-called White Act. This act established a framework for regulating each of the territory's fisheries; areas undergoing considerable fishing pressure, predictably, were immediately regulated with closures and other management actions, while areas that were seldom fished were given few regulations. [19]
In Cook Inlet, several canneries were in operation each year during the 1920s and 1930s. In response to the high degree of fishing activity, the U.S. Bureau of Fisheries applied increasingly sophisticated management actions. Beginning in 1923, for example, the agency dispatched the patrol boat Teal from its Seattle headquarters to the Cook Inlet fishing grounds; the Teal remained in the inlet all summer, gathering information and enforcing fishing regulations. By the end of the decade, the government was sponsoring an ongoing stream improvement program along selected Cook Inlet waterways. Before long, the agency began to deploy stream guards at key Inlet locations to enforce fishing regulations, and by the late 1930s it had begun chartering aircraft to augment the existing patrol efforts. [20]
|
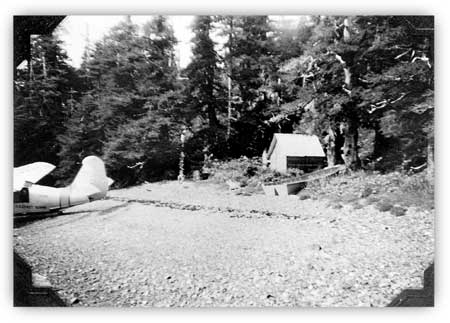
| During the mid-1950s, the Fish and Wildlife Service placed stream guards near several area streams. This 1958 photo shows a typical stream guard shack, skiff, and a Coast Guard floatplane. USF&WS, Cook Inlet Annual Management Report, 1958, 127. |
In Resurrection Bay, where fishing activity was substantially less than in Cook Inlet, the regulatory environment was more relaxed. As noted above, Resurrection Bay was first considered to be part of the Prince William Sound management district. In December 1924, revised White Act regulations redefined Resurrection Bay as being a separate management district with its own set of regulations; the district's fish volume, however, was so small that Central District (Prince William Sound) personnel in Cordova reported on Resurrection Bay fisheries activity. The bay became an administrative part of the Cook Inlet district in early 1951 and has remained there ever since. [21]
Fisheries management in Resurrection Bay was applied with a much lighter touch than in Cook Inlet. Specific regulations, for example, were applied only to bay waters that were north of an imaginary line connecting Cape Resurrection and the west side of Bear Glacier. Active management measures were few. In 1931, the U.S. Bureau of Fisheries dispatched a stream guard to the bay; a year later, the agency maintained a salmon weir near Bear and Grouse lakes. The Teal, however, seldom visited Resurrection Bay; the stream improvement program was virtually nonexistent; and fisheries personnel rarely if ever engaged in aerial patrols. [22]
Fishing Along the Outer Coast
Prior to the end of World War II, the long stretch of coastline between Resurrection Bay and the southwestern tip of Kenai Peninsula was almost entirely ignored by the commercial salmon industry. The primary reason for the lack of interest was that red (sockeye) and king (chinook) salmon were the only varieties sought by the canneries. The southern coastline's annual yield of these species was insignificant during this period; the sockeye runs were much smaller than those of later years, because glaciers and floating glacial ice then covered many areas that are now ice-free. [23] The severe weather, rough seas, remoteness from a fisheries facility, and the comparative fragility of the fishing boats then in use were additional reasons why fishers generally avoided the area.
The outer coast, beginning in 1923, was classified as being part of the Prince William Sound district. Then, in late 1924, the area became part of the new Resurrection Bay district. Fishing pressure along the outer coast, however, was so light that no specific regulations were applied to the area until after World War II. By the 1930s, the coastline had once again come under the nominal purview of the Prince William Sound district fisheries agent. That person, however, had far more pressing management concerns; he generally ignored this stretch of coastline, both in day-to-day activities and in annual reports. By 1943, the stretch of coastline west of Aialik Cape had become an administrative division of Cook Inlet. It has remained there ever since. [24]
Governmental fisheries officials, for the most part, were convinced that this stretch of coastline was essentially bereft of marine resources. One report, based on 1927 data, noted the following about the area:
The fishery districts nearest to [Resurrection Bay] are Prince William Sound on the east and Cook Inlet on the west. In both directions [from Resurrection Bay], especially to the westward, are miles of coastal waters that have no salmon fisheries, so that this bay stands as a district wholly apart from any other.... [25]
Despite that assessment, however, there is widespread evidence that commercial fishers periodically harvested fish from park waters prior to World War II. Evidence is strongest for such activity during the 1930s and early 1940s, although commercial fishing boats may have been active in the area during the 1920s as well.
As noted in Chapter 6, Natives from English Bay and vicinity often traveled along the park coastline as part of their seasonal round during the years prior to World War I. The establishment of canneries at Seldovia, Port Graham, and English Bay during the 1911-1920 period had the practical effect of disrupting the Natives' seasonal cycle; cannery work was available during the months when residents traditionally put up salmon for winter supplies. [26] Prior to World War I, therefore, Natives were the primary (perhaps the only) subsistence fishers along the outer Kenai coast; whites avoided the area (in the words of one longtime resident) because they "didn't want to step on the toes of the Natives." But after the war, there were "lots of white fishermen" and relatively few Natives. Some of those white fishers may have been residents of Halibut Cove or other Lower Cook Inlet communities who traveled the coast on their way to the Prince William Sound fishing grounds; residents of Cordova and vicinity may also have fished the coastline on their way to Cook Inlet. [27]
Specific information about who fished (or just traveled) along the coast has been provided by Josephine Sather, who helped run a fox farm on Nuka Island. Sather, writing in the mid-1940s, spoke kindly of several "old timers who [came] here on their regular seasonal trips." They included John Malutin, Hans Simondsen, and Bert Jacobsen. Malutin, a Seward resident, was captain of the M.S. Marian, which was active from 1927 to 1933, perhaps longer. Little is known about the other two fishermen. In all probability, the Kenai coast was probably visited by quite a number of fishing boats during the 1920s and early 1930s. Because the coast yielded few if any kings or sockeyes, however, commercial fishers did not linger in the area for long. [28]
As noted in Chapter 6, Pete and Josephine Sather were the best-known people to fish the park's waters during this period. They caught pink salmon with seines in many areas of Nuka Bay, and most of the time they were subsistence fishers, feeding what they caught to their foxes. Pete, however, occasionally attempted to sell pink salmon at the canneries, despite their relatively low value. One old-timer recalled that if Sather and other locals "could sell their fish for one-quarter cent each, that gave them flour and sugar for the winter." [29] Sather would typically fill his boat to overflowing; then, because his fishing boat had no refrigeration equipment, he would often head west to the Port Graham-Seldovia area, hoping for a quick sale. If the first cannery he visited wouldn't buy his fish, he would move on to other canneries, making offers at each one. Sather also sold his harvest at the Seward canneries; according to Ralph Hatch, a longtime resident, Sather made a couple of heavily-loaded trips per year to off-load pinks. "By the time he got here," Hatch recalls, "the boat smelled bad but the cannery took them anyway." [30] It should be noted that while much of Sather's subsistence fishing was from Nuka Bay, some–perhaps most–of his commercial fishing harvests were probably from Port Dick and other westward waters. [31]
East of Nuka Bay, the only park waters known to be fished before World War II were located at the southwestern end of Resurrection Bay. In all probability, Seward-area fishers discovered not long after the San Juan plant commenced operations that the Bear Glacier area offered a significant fish run. By the early 1930s, Resurrection Bay had two distinct sockeye runs. The first and larger run took place in the upper bay (north of Caines Head) in early June. By the end of the month, however, the local newspaper announced that "The salmon run in [upper] Resurrection Bay is about over and vessels will have to journey down to Bear Glacier if they expect to make any catches, say local fishermen." [32]
West of Nuka Bay, little or no commercial fishing took place anywhere along the outer coast during the early to mid-1920s. The English Bay, Port Graham, and Seldovia canneries obtained their fish either from nearby fish traps or from fishing boats that stayed fairly close to home. Beginning in 1928, however, a new cannery was built in Portlock, 12 miles southeast of English Bay, and a larger facility was constructed there in 1930. The new Portlock cannery, the availability of more seaworthy fishing vessels, and most of all the rising value of pink salmon all resulted in the exploration of the fishing resources of Windy Bay, Rocky Bay, Port Dick, and other outer coast sites. Fishers soon discovered that these bays were rich in pink and chum salmon, and as the price of these fish rose, these areas became increasingly attractive to the nearby canneries. Roy Cole, the captain of the patrol boat Teal, noted in 1935 that "a few [pinks] show in the lower Inlet from English Bay to Point Gore." By mid-July of that year, commercials fishers were harvesting pinks and chums in Port Dick and selling their harvest to the Adriatic, a tender owned by the Cook Inlet Packing Company plant in Seldovia. [33]
|
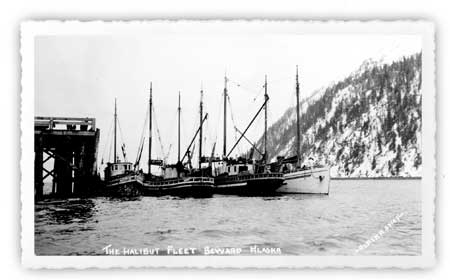
| During the 1920s, Seward was a popular stopover for ships in the halibut fleet that fished out on Portlock Bank and area sites. Neville Public Museum, photo 5670.4. |
Little is known about fishing activity in the western part of the outer coast for the next few years; management reports from the period do not discuss the subject. [34] Nevertheless, pink or chum salmon (perhaps both) probably continued to be harvested, though in small volumes. By 1939, the area was once again receiving Captain Cole's attention; he noted that year that "the run of pinks in the section from Point Gore to Seldovia was scattered" and made a specific description of the Port Dick run. In 1940, he noted that "intensive fishing was in progress" between Seldovia and Port Dick from July 28 to August 10; the following year, Cole noted a "very good" pink run along the coast between Kachemak Bay and Port Dick and "intensive seine fishing" in the Port Dick area in late July and early August. The resource was sufficiently valuable that Cole, and the Teal, personally monitored the Port Dick seine activity during this period. By the early 1940s, therefore, the fishing resources west of Gore Point had been fully explored and were being commercially exploited on a regular basis; Port Dick, specifically, was being described as one of two major pink producing streams in Lower Cook Inlet. [35]
By 1943, commercial fishers had made the first known foray into the Kenai Fjords area. The management report that year noted a new "Seward District" that year east of Port Dick; that district was composed of "Seward Bay" (Resurrection Bay?), from which 7,330 pink salmon were harvested, and "Tunder Bay" (Thunder Bay?), from which 11,970 pinks were harvested. The harvest for both bays was minor; together, they accounted for just 2.1% of the 900,000-plus pink salmon that were caught that year on the east side of Cook Inlet. [36] The "Tunder Bay" harvest did not immediately result in further commercial activity. By 1944, the U.S. Fish and Wildlife Service (the successor to the U.S. Bureau of Fisheries) had instituted a statistical system that recorded the number of fish caught along specific segments of coastline (see Map 9-2). That system failed to record a commercial fish harvest between Gore Point and Aialik Cape either in 1944 or 1945.
|
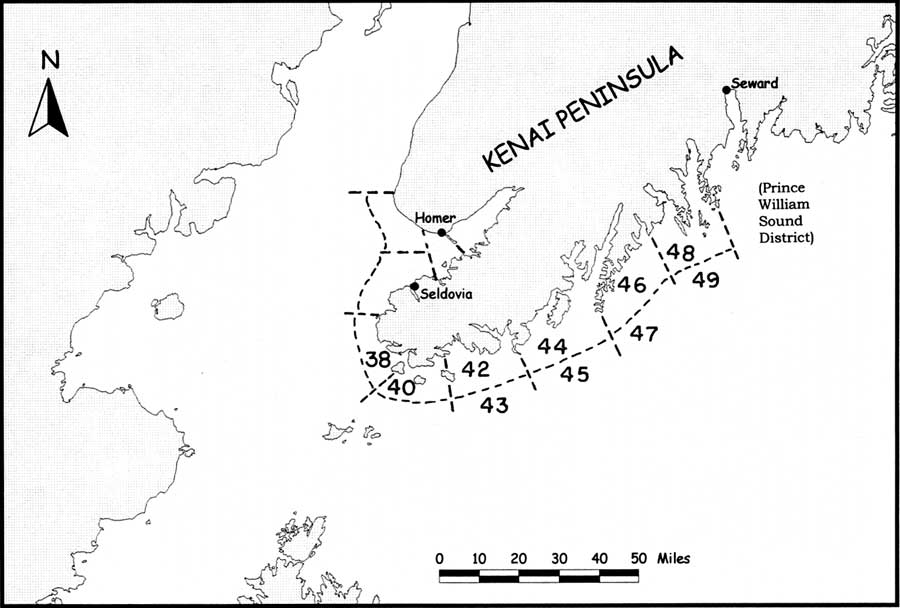
| Map 9-2. Southern Kenai Peninsula Statistical Areas, 1944-1950. (click on image for an enlargement in a new window) |
Although fisheries reports suggest (admittedly, with some lack of certainty) that 1943 was the first year of commercial activity in park waters, several longtime Seward residents recall that local fishers (other than Pete Sather) worked in park waters before 1943. Henry Munson, whose memories of Seward date back to the mid-1930s, recalls that "boats went beyond Resurrection Bay" during that period and that "there were boats in that area before World War II." Seward Shea, another longtime resident, was more specific; he remembers stories of salmon fishing at the south end of "Pete's Island" (Nuka Island) and also near Petrof Point. In Shea' s recollection, the boats in this area came from Seldovia; he admits, however, that never personally saw a Seldovia or Port Graham boat east of Gore Point during this period. [37]
Salmon Fishing Along the Southern Kenai Coast,
1946-1959
General Postwar Trends
During the decade following World War II, the number of canneries in lower Cook Inlet remained stable. As they had for the previous two decades, canneries active west of the park were located at Portlock, Port Graham, and Seldovia. East of the park boundaries, the "small, one-line cannery" in Seward changed its name in 1946 (from Hagen and Company to the Resurrection Bay Company), and it changed its ownership in 1950 (from Nils Hagen to Marvin Viale). The cannery, however, continued to operate much as it had since 1937, when the plant had become fully mechanized.
Major changes took place in the area's salmon industry during the postwar period. One discouraging trend was that fishermen, particularly in Resurrection Bay, were overharvesting reds and other salmon species. (In 1947, a Seward entrepreneur backed away from a fisheries venture because he considered "the runs in Resurrection Bay to be too nearly depleted;" the area fisheries agent that year agreed, declaring that the bay's chum run was "used up." [38]) The Seward cannery, desperate to obtain enough fish to sustain operations, began purchasing Copper River salmon, even though (in the government agent's opinion) "some of these fish were, no doubt, taken illegally in [Prince William] Sound...." This practice was already underway by 1944 and continued for several years thereafter. [39]
A second postwar trend that affected canneries was the statehood movement. Prior to World War II, few Alaskans pushed for statehood. The war, however, brought thousands of new residents, an enhanced defense capability, and less dependence on resource-based industries. The canneries were one of the primary interests fighting statehood, but statehood advocates fought back and cited the widely used fish trap as a primary instrument preventing locally-based resource development. The territorial legislature, and Alaska's delegates to Congress, put increasing pressure on the canneries to eliminate fish traps. The canneries stubbornly hung on; they did not abandon fish traps until 1958, the year Congress passed the statehood bill. The continuing pressure, however, resulted in a reduction in the number of fish traps during the 1940s and early 1950s. This de-emphasis on fish traps took place in Lower Cook Inlet, as elsewhere; in order to keep harvest levels at previous levels, more fishing boats were deployed and boats searched ever farther for salmon stocks.
The overharvesting of the red salmon resource (on a territory-wide basis) and the increasing acceptance of pink salmon as a food fish resulted in higher pink and chum salmon prices. That price structure made Port Dick (which during some years was the Cook Inlet district's most highly-productive pink salmon harvest area) and nearby bays increasingly attractive fishing venues. The new price structure, combined with the increasing scarcity of red salmon, also encouraged independent fishers to seek out previously untapped areas. The windswept, stormy stretch of coastline between Gore Point and Resurrection Bay had, as noted above, been only lightly utilized prior to the mid-1940s. During the next decade, however, an increasing number of fishers explored the area for the first time.
Fishing in Park Waters: The Laissez Faire Period, 1946-1954
The first postwar harvesting of park waters took place in 1946 in Statistical Area 44 (see Table 9-1). This stretch of coastline runs between Gore Point and the Pye Islands; it encompasses both Nuka Bay and Nuka Island. Fish and Wildlife Service records indicate that 2,513 pinks and 75 chums were caught there that year; the number of pinks was some 0.3 percent of the Cook Inlet total, while the chum harvest was less than 0.1 percent of the total number caught in the Cook Inlet district. Records do not indicate specifically who caught these fish. It appears, however, that Pete Sather, who worked that year as an independent purse seiner for the Resurrection Bay Company, harvested a majority of the pink salmon and almost all of the chums in that area. (Sather also worked elsewhere, most probably in the Port Dick-Windy Bay area.) [40]
Table 9-1. Harvest Data for Statistical Area 44, 1944-1950
In 1944, the U.S. Fish and Wildlife Service divided the Cook Inlet Management District into statistical harvest areas. Six statistical areas comprised the waters of present-day Kenai Fjords National Park. Area 44 included the inner waters from Point Gore to the Pye Islands; Area 45 included the outer waters in that area. Area 46 included the inner waters from the Pye Islands to the east side of Two Arm Bay, Area 47 the outer islands. Area 48 included the inner waters from the east side of Two Arm Bay to Aialik Cape, Area 49 the outer waters.
For Area 44, which included the waters surrounding Nuka Island and the waters of Nuka Bay, the harvests in the following table were recorded from 1944 through 1950. For areas 45 through 49, the Fish and Wildlife Service tabulated no harvest during this seven-year period. The agency did not provide data for these areas after 1950.
NOTE: "% of CIH" is the percentage of the total Cook Inlet harvest (for that species) that was caught in Statistical Area 44.
| Pink Salmon | Chum Salmon | Coho Salmon | ||||
| Number | % of CIH | Number | % of CIH | Number | % of CIH | |
| 1944 | 0 | 0.0 | 0 | 0.0 | 0 | 0.0 |
| 1945 | 0 | 0.0 | 0 | 0.0 | 0 | 0.0 |
| 1946 | 2,513 | 0.3 | 75 | 0.0 | 0 | 0.0 |
| 1947 | 0 | 0.0 | 0 | 0.0 | 0 | 0.0 |
| 1948 | 7,918 | 2.1 | 109 | 0.1 | 52 | 16.2 |
| 1949* | 36,761 | 8.5 | 5,200 | 2.2 | 37 | n.a. |
| 1950 | 1,760 | 0.8 | 1,857 | 5.2 | 0 | 0.0 |
* - The 1949 total includes 151 reds. The harvest total includes 6,891 pinks reported in the Cook Inlet report; the remaining harvest, which came from "Nuka Bay," was processed by the Resurrection Bay (Seward) cannery and was reported in the Central District (Prince William Sound) report.
Source: U.S. Fish and Wildlife Service, Cook Inlet Annual Management Report, various issues.
In 1947 no commercial harvests were recorded in park waters, perhaps because even-year runs in adjacent areas had proven to be far stronger than odd-year runs. The following year, however, commercial fishermen returned to Area 44 and harvested 7,918 pinks, 109 chums, and 52 cohos. Although Pete Sather may have harvested a portion of the area's catch, the only known fisher there that year was Alfred A. Anahonak, a 30-year-old "private operator" (that is, an independent fisherman) from Port Graham. Anahonak's possession of a fishing boat represented a new trend among area residents. Subsistence expert Ronald Stanek has noted that before World War II, residents were "limited to set netting, working for the canneries, and utilizing wild resources for subsistence purposes. Since then, Port Graham fishermen have acquired their own drift and seine boats...." [41]
In 1949, fishers again ventured out to Area 44 and gathered far more fish than they had in previous years. Fish and Wildlife Service figures indicate a total harvest of 36,761 pinks, 5,200 chums, 151 reds, and 37 cohos. The Area 44 pink harvest that year was a surprising 8.5 percent of the Cook Inlet total; the chum haul was large too, totaling 2.2 percent of the Cook Inlet catch. The harvest was notable for another reason; it was the first year that a red salmon harvest had been recorded in the area. In 1950, fishers returned to Area 44 and harvested 1,857 chum salmon (5.2% of the Cook Inlet chum catch) along with 1,760 pink salmon. Commercial fishers, it appeared, had "discovered" the park's waters. The only park area in which fishers had shown an interest, however, was Area 44 (west of the Pye Islands), along with the Bear Glacier area. [42] The long stretch of coastline between McArthur Pass and Aialik Cape was still untouched.
During this period, "Herring Pete" Sather (according to admittedly inexact records) spent much of the fishing season working in the Port Dick area or in other areas outside park waters. Others, therefore, fished the Nuka Bay area to an increasing degree. Alfred Anahonak, noted above, was one early harvester. Others may have been a quartet of Seward fishers named Bill Bern, Glen Hammersly, Freddy Blosso, and Charles Peterson. According to Seward Shea, a longtime Seward resident, the four men worked on the purse seiner Marathon. One day, "Herring Pete" told them that the fish were jumping in Nuka Bay. The bay at that time, however, was a hazardous place to reach; McArthur Pass was often impassable because floating ice was dangerous to the wooden boats then in use. Because the McCarty Glacier face was not far north of James Lagoon, additional ice lay in the southern reaches of Nuka Bay. Despite those dangers, the four successfully fished the bay, and their success brought others in their wake. [43]
As noted above, 137 red salmon were harvested in Area 44 in 1949. This harvest, small though it was, was significant inasmuch as these were the first red salmon caught in park waters by commercial fishers. The existence of a red salmon population in the bay indicated that the glaciers had retreated enough to support a biologically active lake-and-river system where reds could spawn and migrate. The McCarty Glacier face, during the early years of the century, had connected James Lagoon on the west with McCarty Lagoon on the east; and to the north, the upland areas on both sides of the glacier were glaciated as well. Between 1920 and 1925, however, the glacier's eastern side had melted to the point that Delight Lake was formed, and between 1935 and 1940 a new water body, Desire Lake, emerged to the north. If it is assumed that the red salmon harvested in 1949 came from the Delight Lake system (the most logical location for them), then the time lapse between the lake's emergence from the ice and its ability to support a red salmon run was less than thirty years. This is a remarkably quick recovery, considering the biological complexities involved. [44]
Another sockeye run that began during this period took place in Aialik Bay. Longtime resident Seward Shea recalls that the run, which spawns in Addison Lake above Pederson Lagoon, was discovered by Seward resident Henry Larson, known locally as "Henry the Bear." In either the late 1940s or early 1950s, Larson entered the bay in search of platinum float. He built a small prospecting shack and used it as a base camp. His prospecting venture failed but he found salmon by the hundreds. Using a gill net, which he stretched between an island (perhaps Slate Island) and the mainland, he harvested $6500 worth of sockeyes. Soon after Larson returned to the dock, news of the find spread to Shea and other Seward fishermen. Many of the other fishers made their own investigation and returned there in later years. Government fisheries agents, however, did not learn about the Aialik red run until the late 1950s. [45]
Pete Sather, a Nuka Island resident since the mid-1920s, not only fished Nuka Bay's salmon, but as an incident during the early 1950s shows, he claimed to have single-handedly started a run of his own. As part of his fox farming operation, he consistently cleaned the pink salmon he harvested in a stream that previously, in Sather's opinion, had had no salmon in it. (This stream was probably adjacent to his cookhouse, which was not far from his residence.) By the early 1950s, the stream supported a significant pink salmon population. Other fishers discovered the run and attempted to harvest the resource. Pete, however, resisted; he reasoned that he had single-handedly created the run and should therefore have proprietary rights over the salmon. He took his case to the courthouse in Anchorage; the court, however, ruled against him. [46]
As noted above, management of park waters during the late 1940s was ostensibly under the purview of the Cook Inlet District. The small harvest level, however, incited no interest from federal fisheries authorities; they may have ignored the area because, to some degree, the park's waters were being fished out of Seward, which was in the Central (Prince William Sound) District, headquartered in Cordova. In early 1951, management of the Resurrection Bay fishery shifted from the Central District to the Cook Inlet District. For the next several years after that boundary change, annual reports continued to overlook fishing activity in park waters. (Jim Branson, who worked as a Fish and Wildlife Service stream guard at Port Dick in 1952, perhaps summed up the agency's attitude toward the area when he mentioned, in a recent interview, that the agency ignored the coast east of Gore Point because there was "not much of a resource out there.") In all probability, a small number of commercial fishermen continued to venture to Nuka Bay, [47] but as one old-timer noted, "population levels [of fish were] hammered there because there was no enforcement." Fisheries managers continued to ignore the area until 1953, when "numerous air and foot surveys were conducted in the lower inlet...." That effort, which included "all important pink and chum streams south of Kachemak Bay," included a cursory survey of Nuka Island streams. Fisheries personnel probably ignored other Nuka Bay sites. [48]
As noted earlier, one of the two major reasons that Nuka Bay and other pink- and chum-producing areas became popular between the late 1940s and the mid-1950s was because of increasing price levels. Before 1940, prices for the two species were so low that they were incidental fish; that is, they were caught by fishers who were searching for other, more highly valued species. By 1942, the price of the two species had risen to 6-1/2-8-1/2 cents apiece; five years later, pinks sold for 11 cents while chums sold for 15-1/2 cents. Based on those prices, Cook Inlet canneries typically processed 40,000 cases of pinks and 30,000 cases of chums each year. But after 1950, prices on both species rose substantially; in 1952, for example, pinks sold for 30 to 40 cents apiece while chums were worth 40 to 50 cents. As a result, fishing boats sought to catch an increasing number of pinks and chums during the 1950s. [49]
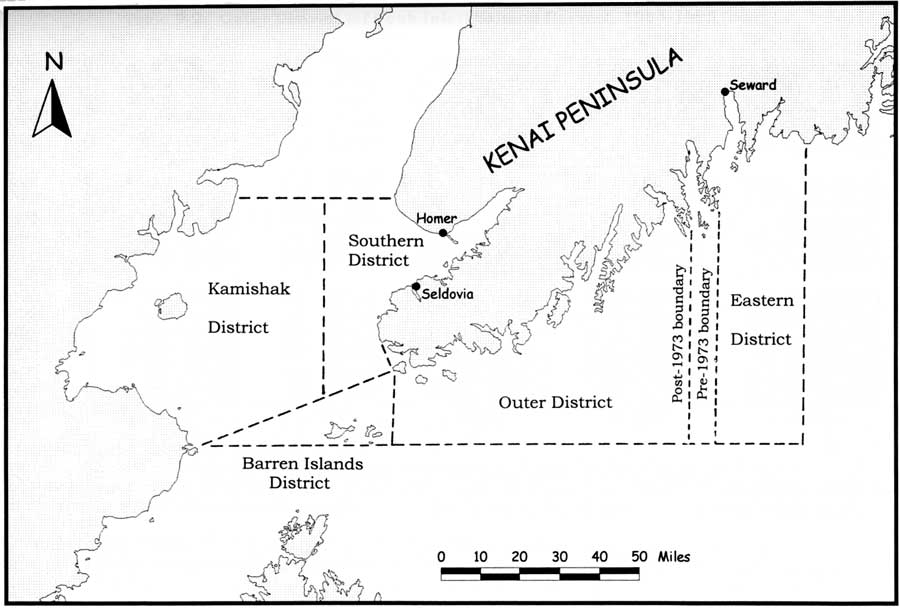
Rising price factors, however, do not fully explain why interest in the Nuka Bay area skyrocketed in the mid-1950s. The other causative factor was availability. Statistics from Cook Inlet show that during the 1946-1951 period, both total catch levels (expressed in number of fish) and fishing effort (expressed in gear-unit days) rose steadily. From 1951 to 1957, however, both of these figures declined. It became increasingly clear that the streams that had traditionally provided large pink salmon returns–the Talachulitna River (a tributary of the Susitna), the Kenai River and other streams flowing into the northern and central portions of Cook Inlet–were being overharvested. As a result, canneries eagerly sought out alternative locations. The Outer District, which stretched from Point Adam (near Portlock) to Aialik Cape (see Map 9-3), contained many productive pink and chum runs; not surprisingly, therefore, the park waters and other Outer District streams became increasingly important during this period (see Tables 9-2 and 9-3). Based on the contributions of Outer District streams and those in other newly-harvested locations, the volume of fish caught in the Cook Inlet administrative district rose again by the late 1950s and continued to rise for years thereafter. [50]
|
| Map 9-3. Lower Cook Inlet Management Districts. (click on image for an enlargement in a new window) |
Table 9-2. Outer District (of Cook Inlet) Salmon Harvest, 1954-1995
Figures given are number of fish, while percentages are those of the entire Lower Cook Inlet catch. The Outer District goes from Point Adam (south of Port Graham, on Kenai Peninsula's southwestern tip) to Bear Glacier (at the southwestern end of Resurrection Bay). Source: ADF&G, Cook Inlet Finfish Report, 1976-1977, Table 16; and ADF&G, Lower Cook Inlet Finfish, Annual Management Report, 1995, Appendix Table 8.
An asterisk (*) signifies a percentage less than 0.1%. In regards to king salmon, a number sign (#) is used because no attempt was made to compute percentages. The number of kings harvested is relatively small; the number harvested in all of Lower Cook Inlet has never exceeded 2,000 per year, and in most years commercial fishers harvested fewer than 500.
| Year | Kings(#) | Reds | Cohos | Pinks | Chums | Total |
| 1954 | 13 | 4,927 (12.4%) | 369 (2.4%) | 82,205 (30.6%) | 112,877 (42.5%) | 200,391 (33.8%) |
| 1955 | 7 | 701 (1.7%) | 277 (2.9%) | 557,997 (47.1%) | 40,887 (59.5%) | 599,869 (46.1%) |
| 1956 | 23 | 2,889 (8.0%) | 190 (2.0%) | 42,368 (20.4%) | 19,248 (21.8%) | 64,718 (18.9%) |
| 1957 | 13 | 2,982 (11.1%) | 110 (6.2%) | 149,197 (52.2%) | 138,171 (66.9%) | 290,473 (55.7%) |
| 1958 | 1 | 1,719 (8.8%) | 83 (4.6%) | 739,768 (77.9%) | 100,386 (80.6%) | 841,957 (76.8%) |
| 1959 | 3 | 10,365 (47.9%) | 109 (1.7%) | 68,875 (55.2%) | 65,675 (59.3%) | 145,027 (55.0%) |
| 1960 | 4 | 1,336 (5.4%) | 533 (19.8%) | 328,501 (53.7%) | 67,187 (57.9%) | 397,561 (52.6%) |
| 1961 | 2 | 12,595 (55.3%) | 444 (27.4%) | 105,447 (34.8%) | 40,204 (72.3%) | 158,692 (41.4%) |
| 1962 | 2 | 8,697 (34.4%) | 1,893 (24.5%) | 1,684,023 (74.9%) | 126,750 (70.7%) | 1,821,365 (74.0%) |
| 1963 | 6 | 1,974 (13.1%) | 369 (5.5%) | 21,462 (10.6%) | 116,923 (84.4%) | 140,734 (38.7%) |
| 1964 | 2 | 1,370 (6.6%) | 431 (4.6%) | 767,396 (72.7%) | 269,512 (83.4%) | 1,038,711 (73.7%) |
| 1965 | 0 | 1,965 (14.0%) | 7 (0.8%) | 21,816 (18.9%) | 22,443 (79.9%) | 46,231 (29.2%) |
| 1966 | 1 | 2,710 (17.7%) | 357 (6.6%) | 398,751 (68.8%) | 87,620 (67.9%) | 489,439 (67.1%) |
| 1967 | 2 | 2,165 (7.5%) | 56 (2.1%) | 259,951 (69.2%) | 37,533 (43.9%) | 299,707 (60.8%) |
| 1968 | 1 | 1,550 (1.6%) | 106 (2.2%) | 191,691 (32.7%) | 20,283 (27.0%) | 213,631 (28.1%) |
| 1969 | 0 | 92 (0.1%) | 11 (1.8%) | 51,533 (25.5%) | 5,400 (8.8%) | 57,036 (14.7%) |
| 1970 | 5 | 4,177 (18.7%) | 243 (5.0%) | 302,879 (52.7%) | 118,746 (52.9%) | 426,050 (51.6%) |
| 1971 | 11 | 1,630 (7.3%) | 174 (3.8%) | 310,710 (79.1%) | 116,995 (78.7%) | 431,520 (75.9%) |
| 1972 | 7 | 26,423 (45.6%) | 17 (0.8%) | 1,005 (3.5%) | 43,490 (57.6%) | 70,942 (43.1%) |
| 1973 | 1 | 5,064 (17.3%) | 30 (1.4%) | 197,259 (64.2%) | 76,341 (66.1%) | 278,695 (61.3%) |
| 1974 | 1 | 399 (1.5%) | 28 (0.4%) | 1,678 (3.3%) | 11,931 (62.1%) | 14,037 (13.5%) |
| 1975 | 0 | 720 (2.6%) | 7 (0.1%) | 160,291 (15.1%) | 11,350 (52.4%) | 172,368 (15.4%) |
| 1976 | 7 | 18,886 (32.5%) | 0 (0%) | 93 (0.1%) | 412 (0.8%) | 19,398 (7.8%) |
| 1977 | 34 | 33,733 (33.7%) | 1,528 (53.2%) | 1,127,800 (87.3%) | 70,167 (48.1%) | 1,233,262 (80.0%) |
| 1978 | 236 | 10,695 (6.8%) | 45 (0.7%) | 70,080 (19.9%) | 19,224 (26.1%) | 100,280 (17.0%) |
| 1979 | 30 | 25,297 (39.3%) | 150 (1.2%) | 1,945,521 (65.0%) | 180,558 (82.6%) | 2,151,556 (65.4%) |
| 1980 | 12 | 22,514 (32.4%) | 16 (0.1%) | 154,041 (17.3%) | 32,246 (43.9%) | 208,827 (20.0%) |
| 1981 | 61 | 18,133 (16.4%) | 485 (4.5%) | 1,714,115 (52.3%) | 238,393 (70.9%) | 1,971,187 (52.7%) |
| 1982 | 129 | 66,781 (50.9%) | 92 (0.2%) | 67,523 (12.2%) | 63,075 (31.8%) | 197,600 (21.3%) |
| 1983 | 14 | 16,835 (9.0%) | 54 (0.5%) | 199,794 (21.5%) | 27,203 (14.1%) | 243,900 (18.5%) |
| 1984 | 3 | 29,276 (10.9%) | 41 (0.3%) | 89,085 (12.7%) | 3,204 (3.5%) | 121,609 (11.3%) |
| 1985 | 19 | 91,957 (33.0%) | 3,210 (31.1%) | 618,222 (50.3%) | 11,844 (38.7%) | 725,252 (46.8%) |
| 1986 | 6 | 48,472 (20.6%) | 5,052 (26.8%) | 401,755 (28.5%) | 11,701 (14.1%) | 466,986 (26.8%) |
| 1987 | 14 | 31,845 (12.8%) | 2,481 (17.3%) | 23,890 (11.9%) | 28,663 (18.3%) | 86,893 (14.0%) |
| 1988 | 5 | 9,501 (3.0%) | 2 (*) | 6,094 (0.7%) | 71,202 (22.1%) | 86,804 (5.5%) |
| 1989 | 1 | 10,286 (6.3%) | 72 (0.6%) | 52,677 (4.1%) | 43 (0.4%) | 63,079 (4.2%) |
| 1990 | 2 | 17,404 (8.5%) | 74 (0.8%) | 191,320 (49.9%) | 614 (8.8%) | 209,414 (34.6%) |
| 1991 | 2 | 6,408 (2.0%) | 12 (0.1%) | 359,664 (43.4%) | 14,337 (59.2%) | 380,423 (31.9%) |
| 1992 | 0 | 572 (0.3%) | 1 (*) | 146 (*) | 181 (0.8%) | 900 (0.1%) |
| 1993 | 2 | 4,613 (2.0%) | 119 (0.9%) | 159,159 (18.4%) | 970 (22.2%) | 164,863 (14.7%) |
| 1994 | 0 | 5,930 (5.1%) | 993 (6.8%) | 13,200 (0.8%) | 32 (0.6%) | 20,155 (1.1%) |
| 1995 | 12 | 17,642 (6.6%) | 1,272 (7.2%) | 192,098 (6.7%) | 474 (3.0%) | 211,498 (6.7%) |
Table 9-3. Eastern District (of Cook Inlet) Salmon Harvest, 1954-1995
Figures given are number of fish, while percentages are those of the entire LOWER Cook Inlet catch. An asterisk (*) signifies a percentage less than 0.1%. The Eastern District extends from Bear Glacier (at the southwestern end of Resurrection Bay) east to Cape Fairfield (between Whidbey and Johnstone bays). Source: ADF&G, Cook Inlet Finfish Report, 1976-1977, Table 18; and ADF&G, Lower Cook Inlet Finfish, Annual Management Report, 1995, Appendix Table 9.
An asterisk (*) signifies a percentage less than 0.1%. In regards to king salmon, no attempt was made to compute percentages. A number sign (#) is used because the number of kings harvested is relatively small: the Lower Cook Inlet harvest has never exceeded 2,000 per year, and in most years is fewer than 500.
| Year | Kings(#) | Reds | Cohos | Pinks | Chums | Total |
| 1954 | 0 | 11,786 (29.7%) | 2,256 (14.9%) | 7,562 (2.8%) | 1,945 (0.7%) | 23,849 (4.0%) |
| 1955 | 4 | 5,049 (13.8%) | 6,160 (63.7%) | 55,994 (4.7%) | 3,147 (4.6%) | 70,354 (5.4%) |
| 1956 | 0 | 296 (0.8%) | 3,761 (40.2%) | 14,873 (7.2%) | 519 (0.6%) | 19,450 (5.7%) |
| 1957 | 120 | 169 (0.6%) | 119 (6.7%) | 0 (0%) | 20 (*) | 428 (0.1%) |
| 1958 | 0 | 0 (0%) | 0 (0%) | 200 (*) | 0 (0%) | 200 (*) |
| 1959 | 58 | 5,477 (25.3%) | 8,954 (95.0%) | 125 (0.1%) | 14,612 (13.2%) | 29,226 (11.1%) |
| 1960 | 0 | 105 (0.4%) | 853 (31.7%) | 8,720 (1.4%) | 467 (0.4%) | 10,415 (1.4%) |
| 1961 | 0 | 0 (0%) | 0 (0%) | 0 (0%) | 0 (0%) | 0 (0%) |
| 1962 | 0 | 0 (0%) | 3,728 (48.2%) | 49 (*) | 10 (*) | 3,787 (0.2%) |
| 1963 | 1 | 1 (*) | 2,250 (33.4%) | 11 (*) | 0 (0%) | 2,263 (0.6%) |
| 1964 | 0 | 22 (0.1%) | 22 (0.2%) | 813 (0.1%) | 12 (*) | 869 (0.1%) |
| 1965 | 0 | 0 (0%) | 0 (0%) | 0 (0%) | 0 (0%) | 0 (0%) |
| 1966 | 0 | 0 (0%) | 0 (0%) | 0 (0%) | 0 (0%) | 0 (0%) |
| 1967 | 0 | 348 (1.2%) | 203 (7.4%) | 3,097 (0.8%) | 275 (0.3%) | 3,923 (0.8%) |
| 1968 | 2 | 74,484 (78.2%) | 5 (0.1%) | 41,464 (7.1%) | 872 (1.2%) | 116,827 (15.4%) |
| 1969 | 3 | 99,403 (80.9%) | 6 (1.0%) | 1 (*) | 10 (*) | 99,423 (25.7%) |
| 1970 | 11 | 1,767 (7.9%) | 692 (14.2%) | 40,226 (7.0%) | 633 (0.3%) | 43,329 (5.2%) |
| 1971 | 21 | 2,198 (9.9%) | 1,115 (24.4%) | 1 (*) | 423 (0.3%) | 3,758 (0.7%) |
| 1972 | 12 | 82 (0.1%) | 903 (40.4%) | 18,190 (63.5%) | 743 (1.0%) | 19,930 (12.1%) |
| 1973 | 5 | 0 (0%) | 801 (38.1%) | 2 (*) | 0 (0%) | 808 (0.2%) |
| 1974 | 0 | 0 (0%) | 517 (7.9%) | 0 (0%) | 0 (0%) | 517 (0.5%) |
| 1975 | 1 | 0 (0%) | 124 (2.0%) | 0 (0%) | 0 (0%) | 125 (*) |
| 1976 | 0 | 5 (*) | 200 (6.2%) | 35,423 (26.0%) | 45 (0.1%) | 35,673 (14.3%) |
| 1977 | 0 | 5,776 (5.8%) | 360 (12.5%) | 1,349 (0.1%) | 3,229 (2.2%) | 10,714 (7.0%) |
| 1978 | 0 | 2 (*) | 582 (8.9%) | 29,738 (8.4%) | 100 (1.4%) | 30,422 (5.1%) |
| 1979 | 0 | 0 (0%) | 296 (2.4%) | 0 (0%) | 0 (0%) | 296 (*) |
| 1980 | 0 | 122 (0.2%) | 426 (2.9%) | 155,779 (17.5%) | 720 (1.0%) | 157,047 (15.0%) |
| 1981 | 0 | 9,270 (8.4%) | 470 (4.4%) | 44,989 (1.4%) | 3,279 (1.0%) | 58,008 (1.6%) |
| 1982 | 0 | 3,092 (2.4%) | 950 (2.0%) | 143,639 (26.0%) | 7,698 (3.9%) | 155,379 (16.7%) |
| 1983 | 0 | 25,932 (13.8%) | 594 (5.3%) | 36,154 (3.9%) | 7,934 (4.1%) | 70,614 (5.4%) |
| 1984 | 47 | 54,420 (20.2%) | 536 (3.2%) | 136,797 (19.5%) | 10,535 (11.4%) | 202,335 (18.7%) |
| 1985 | 11 | 24,338 (8.7%) | 835 (8.1%) | 92,403 (7.5%) | 5,144 (16.8%) | 122,731 (7.9%) |
| 1986 | 0 | 3,055 (1.3%) | 770 (4.1%) | 40,243 (2.9%) | 3,757 (4.5%) | 47,825 (2.7%) |
| 1987 | 0 | 3,687 (1.5%) | 1,631 (11.4%) | 14,333 (7.1%) | 14,913 (9.5%) | 34,564 (5.5%) |
| 1988 | 1 | 20,253 (6.3%) | 486 (6.1%) | 1,740 (0.2%) | 24,668 (7.7%) | 47,148 (3.0%) |
| 1989 | 0 | 8,538 (5.2%) | 5,346 (44.2%) | 92 (*) | 312 (2.8%) | 14,288 (1.0%) |
| 1990 | 0 | 7,682 (3.8%) | 7,645 (82.2%) | 11,815 (3.1%) | 307 (4.4%) | 27,449 (4.5%) |
| 1991 | 1 | 4,703 (1.5%) | 7,283 (38.2%) | 167,250 (20.2%) | 80 (0.3%) | 179,317 (15.1%) |
| 1992 | 0 | 432 (0.2%) | 3,136 (53.1%) | 60,007 (12.5%) | 86 (0.4%) | 63,361 (9.2%) |
| 1993 | 0 | 1,824 (0.8%) | 8,924 (66.2%) | 10,616 (1.2%) | 9 (0.2%) | 21,373 (1.9%) |
| 1994 | 1 | 9,661 (8.3%) | 10,410 (70.9%) | 44,987 (2.7%) | 2,792 (51.1%) | 67,851 (3.8%) |
| 1995 | 0 | 46,556 (17.5%) | 5,192 (29.3%) | 12,000 (0.4%) | 330 (2.1%) | 64,078 (2.0%) |
The Onset of Regulation, 1955-1959
The Fish and Wildlife Service continued to ignore the park coastline through the 1954 season. Most of the fish harvested in the area, as before, were probably pink salmon that were caught near Nuka Island. In 1955, however, the agency instituted active management when it dispatched its first enforcement specialist to Nuka Island. Fishery aid F. Douglas Swanson was assigned to Nuka Bay for six days in mid-August. One of 273 agency enforcement personnel who worked Alaskan streams that summer, Swanson performed the typical duties that his predecessors had been undertaking since the 1920s. Those duties included enforcing closure regulations (particularly around stream mouths) and conducting spawning-ground observations. As part of his work, Swanson was the first governmental representative to learn of the existence of the Delight and Desire Lake sockeye run. John Skerry, the Fish and Wildlife Service's agent for Cook Inlet, concluded that because the run was unregulated, local fishers were therefore abusing the resource. Those fishers, moreover, had no interest in helping government agents. Skerry noted that "there is still a great deal to be learned of the various fish runs in [park waters]. Much of this has to be uncovered by personal observation due to the unco-operative attitude taken by the Seward fishermen." [51]
By 1956, the park coastline was becoming an increasingly popular fishing venue. Nuka Bay was now home to boats owned by Port Graham canneries; the Libby, McNeill and Libby company, which had a cannery on Kodiak Island; and one or more of the Seattle-based processing ships. These fishing boats, in turn, were supported by tenders that waited nearby. Aialik Bay, on the other hand, was fished primarily by Seward-based boats. During this period the Resurrection Bay harvests, which had been anemic since the 1930s, fell to the point that Seward's only cannery closed after the 1955 season. Despite the lack of a nearby cannery, Seward fishers continued to harvest the small if valuable Aialik Bay sockeye run. [52]
As a result of the stepped-up activity, federal fisheries personnel in 1956 increased their presence in park waters and moved to ensure the protection of the sockeye run that had been revealed to them the previous year. William Miller, who had been working as a Fish and Wildlife Service stream guard since 1953, was stationed at the mouth of Delight Creek from mid-June to late July; he then moved to Nuka Island, where he stayed until mid-August. He also served a stint at the head of Beauty Bay in Nuka Bay's West Arm. Another stream guard dispatched to the area that summer was John Frye, who arrived at the mouth of Delight Creek before Miller left. A Fish and Wildlife Service floatplane, which patrolled the Outer District for the first time, augmented Miller and Frye's observations and enforcement capabilities. [53] During the same general period–probably in the mid-1950s, according to one old-time fisherman–the Fish and Wildlife Service stationed a stream guard in a tent at the edge of Pederson Lagoon, in Aialik Bay. Here, as in Nuka Bay, the guard remained until fishermen left the area. [54]
|
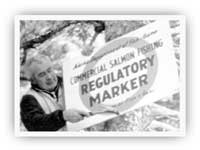
| Markers such as this one were posted near various Kenai Fjords stream mouths beginning in the mid-1950s. Alaska Geographic 10:3 (1983), 9. |
Miller's experiences as a stream guard, like Swanson's, were more or less typical of those who served in that capacity elsewhere in Alaska during territorial days. It was Miller's job to monitor activity surrounding the buoys that had been placed 500 yards from the mouth of salmon streams. Because pink and chum salmon commonly school at stream mouths, regulations prohibited fishing boats from passing beyond the buoys, which were marked with plywood, three-foot-square stream markers. Fishing boats, however, often lurked just beyond the markers, particularly at high tide. In an intricate game of cat-and-mouse, many boats tried–in various, devious ways–to fish inside the buoy perimeter without being detected. Miller, equipped with a small, motorized skiff, was asked to establish a presence and prevent fisheries violations; during his stay on Nuka Island, he was responsible for monitoring the fishing activities at several island streams simultaneously. Miller led a rugged life that summer; on Nuka Island, he stayed in one of Pete Sather's abandoned fox shacks, while at Delight Creek, he camped in a tent. [55]
Miller and the other stream guards recognized that the Nuka Bay pink runs for 1956 were "not as great" as in 1955, even though the even-year pink fishery was traditionally dominant. Worried that the pink population could not be sustained under the current system, fisheries agent John Skerry recommended that the season end on August 18. The suggestion was quickly implemented. The stream guards also made a number of baseline stream surveys. Streams surveyed for the first time included Nuka Island Creek, Home Cove, South Creek, Mike Bay, and Duck Bay–all of which were located on Nuka Island–along with Desire and Delight creeks, which flowed into McCarty Fjord. Stream mouths marked that summer were located at Delight and Desire creeks, Home Cove, the unnamed cove south of Home Cove, and Nuka Bay Creek. [56]
From 1957 to 1959, the park fishery continued to be managed in much the same way as in 1956. At least one fisheries enforcement person was dispatched to Nuka Bay each summer; stream guard work continued to take place at Delight Creek and several Nuka Island locations. [57] On a more occasional basis, personnel tallied escapement levels, surveyed streams, and measured stream temperatures. One summer, the agency patrolled the area with its Grumman Goose; a year later the agency's patrol vessel, the Kittiwake, checked Nuka Bay's closure markers. [58]
Specific changes during this period were few. The various stream guards welcomed one of those changes; in 1957, the shelters at both Nuka Island Creek and Delight Creek were upgraded from tents to an 8' x 10' tent frame, with walls and roof made of corrugated aluminum. A second change involved enforcement methods. The existing system of stream mouth protection was apparently less than effective, so agency managers adopted a stakeout system in which the stream guards hid in the undergrowth and watched for stream robbers. This practice was more cost-effective than the previous system had been and it resulted in more fisheries violations, but local fishers became angrier than ever at federal fishing policies. [59]
Commercial Salmon Fishing Since Statehood
Statehood and Its Ramifications, 1960-1963
The relative continuity of fisheries management along the Kenai Peninsula's outer coast, and fisheries management throughout Alaska, was abruptly changed by statehood. A statehood bill passed Congress in June 1958, but Alaska did not enter the Union until January 1959, and the new state did not assume responsibility for fisheries management until 1960. Therefore, fisheries management for the first year after statehood continued much as it had during territorial days.
When the Alaska Department of Fish and Game assumed control of the new state's fisheries, the health of Alaska's salmon stocks had been declining for years. A major reason for the declining stocks was the strong bond between the canneries and the Fish and Wildlife Service, both being based outside Alaska. Jim Rearden, a longtime Fish and Game biologist, has remarked that "all the agency cared about was the canneries," and the canneries had a near-total influence over territorial fishing regulations. Independent fishermen, and Alaskans in general, strongly resented their own lack of influence over fisheries regulations. One manifestation of that resentment was that some Alaska fishers robbed fish along creeks and at stream mouths. [60] As noted above, many Alaskans equated federal fisheries management with the fish trap. While the number of fish traps slowly declined during the years that preceded statehood, the widely hated traps were not eliminated until Congress passed the statehood bill.
Another reason that Alaska's salmon stocks were in relatively poor shape was because of the nature of fisheries regulation. Jim Rearden has noted that
under Federal control, the regulations were generally adopted six months or more in advance of the fishing season and they were virtually inflexible; any change had to be published in the Federal Register before it became effective. Once a regulation was in place, there was little chance of modifying it, regardless of its effect on fishermen or on the salmon.
The transfer to state management, however, made the adoption of fisheries rules far easier; rule changes, via "emergency orders," could be made by field announcement and implemented within hours. [61] Those regulations, moreover, were generated by an Alaskan, not Federal, bureaucracy. Fisheries policy was set by a statewide board appointed by Alaskans and subject to a public hearing process. Because of the changes in fisheries management that followed statehood, local antagonism against fisheries regulations lessened. The resentment did not, however, evaporate. Some fishers continued to fish out of season, at stream mouths, and in other ways contrary to the newly constituted regulations.
Other changes that followed statehood were easily visible on the fishing grounds. The placing of stream guards continued after statehood, but the unpopular stakeout program was eliminated. The number of Alaska stream guards, moreover, shrank considerably. In park waters, stream guards continued at Home Cove on Nuka Island and in the Delight-Desire Creek area, [62] but apparently no guards were deployed to Aialik Bay after statehood. The guards' survey duties, to an increasing degree, were taken over by a Fish and Game biologist who periodically flew over the area–either from Port Dick to Resurrection Bay, or from the head of Kachemak Bay to Nuka Bay and on to Resurrection Bay–in a Super Cub. (The small, maneuverable Cub had a distinct advantage over the Grumman Goose used by federal fisheries managers. The Cub could fly as slowly as 65 or 70 miles per hour without stalling–slow enough that biologists could count the spawners from the air–while the Goose's stall speed was 140 or 150 miles per hour.) Stream guards returned to the area in the summer of 1961, and perhaps again in 1962; they then left the Outer Coast, never to return. [63]
By the time the State of Alaska began managing the park area fishery, the southern coast's salmon runs had become sufficiently well known–and its harvest statistics had become sufficiently reliable–that its contribution to the overall Cook Inlet regional fishery could be assessed (see Table 9-4). Fish and Game personnel recognized that Nuka Bay (i.e., the stretch of coastline between Gore Point and the Pye Islands) had a fairly strong run of pink, chum and sockeye salmon; the Aialik Bay area had a sizable sockeye run; and Resurrection Bay had distinctive pink, chum, and sockeye runs. For those reasons, historical statistics are provided in the following paragraphs for three of the five salmon species. (Relatively small numbers of coho and king salmon are harvested in park waters, or elsewhere in the Outer District, so no specific statistics are provided for those species.)
Table 9-4. Salmon Harvest, by Number of Fish (in thousands) and Percentage of Total Harvest for Selected Periods, 1954-1994
| Year | chinook salmon (410) (#/pounds) |
sockeye salmon (420) (#/pounds) |
coho salmon (430) (#/pounds) |
pink salmon (440) (#/pounds) |
chum salmon (450) (#/pounds) |
salmon total (#/pounds) |
| Outer District Figures: | ||||||
| 1954-59 | 0 — 0.0% | 23.6 — 1.1% | 1.1 — 0.1% | 1,640.4 — 76.6% | 477.2 — 22.3% | 2,142.4 |
| 1960-65 | 0 — 0.0% | 25.9 — 0.7% | 3.7 — 0.1% | 2,936.8 — 81.1% | 654.7 — 18.1% | 3,621.2 |
Statistical Area 232 Figures: | ||||||
| Year | chinook salmon (410) (#/pounds) |
sockeye salmon (420) (#/pounds) |
coho salmon (430) (#/pounds) |
pink salmon (440) (#/pounds) |
chum salmon (450) (#/pounds) |
salmon total (#/pounds) |
| 1968-69 | 0 — 0.0% | 0.1 — 0.2% | 0 — 0.0% | 64.6 — 91.9% | 5.5 — 7.9% | 70.3 |
| 1970-74 | 0 — 0.0% | 37.6 — 13.3% | 0 — 0.0% | 190.9 — 67.6% | 53.8 — 19.1% | 282.4 |
| 1975-79 | 0.3 — 0.0% | 89.4 — 2.5% | 1.6 — 0.0% | 3,179.2 — 89.7% | 274.0 — 7.7% | 3,544.7 |
| 1980-84 | 0.1 — 0.0% | 153.5 — 5.6% | 0.5 — 0.0% | 2,224.5 — 81.1% | 364.0 — 13.3% | 2,743.1 |
| 1985-89 | 0 — 0.0% | 192.1 — 13.4% | 10.6 — 0.7% | 1,102.7 — 77.2% | 123.4 — 8.6% | 1,429.0 |
| 1990-94 | 0 — 0.0% | 34.3 — 4.4% | 1.0 — 0.1% | 723.5 — 93.3% | 15.9 — 2.1% | 775.1 |
Source: Tables 9-2 and 9-8.
Statistics collected during the 1960-1963 period show that in regard to pink salmon (see Table 9-5), Nuka Bay had fairly strong harvests during even-numbered years. These harvests numbered more than 25,000 fish per year, and comprised between 4% and 6% of the total Lower Cook Inlet harvest. Its odd-year harvests, however, were so small that they comprised less than 1% of the Lower Cook Inlet harvest. During all four of these years, the Resurrection Bay harvest was far less than that in Nuka Bay; in 1961 and 1963, in fact, the harvest was nonexistent. But the Port Dick harvest–just west of Nuka Bay–was far greater than in any park area.
Table 9-5. Commercial Pink Salmon Harvest for Selected Lower Cook Inlet Bays, 1959-1995
Figures given are in numbers of fish (in thousands), while percentages are those of the entire Lower Cook Inlet catch. (Lower Cook Inlet includes all Kenai Peninsula Streams between Anchor Point and Cape Fairfield, plus all west-side waters between Cape Douglas and the Iniskin Peninsula.) Source: ADF&G, 1995 Lower Cook Inlet Annual Finfish Management Report, Appendix Tables 19 and 20. T = trace (i.e., fewer than 50 fish), * = percentage less than 0.1%.
| Year | Port Dick Bay | Nuka Bay | Resurrection Bay | Total, Lower Cook Inlet |
| 1959 | 28.2 (22.6%) | 33.3 (26.7%) | 8.4 (6.7%) | 124.7 |
| 1960 | 257.4 (42.1%) | 26.6 (4.3%) | 5.8 (0.9%) | 611.6 |
| 1961 | 92.9 (30.6%) | 2.0 (0.6%) | 0 (0%) | 303.4 |
| 1962 | 1,118.3 (49.7%) | 129.8 (5.8%) | 0.1 (*) | 2,248.3 |
| 1963 | 19.0 (9.3%) | 0.3 (0.1%) | 0 (0%) | 203.6 |
| 1964 | 526.3 (49.9%) | 23.8 (2.3%) | 0.3 (*) | 1,055.4 |
| 1965 | 15.3 (13.2%) | 0 (0%) | 0 (0%) | 115.6 |
| 1966 | 296.8 (51.2%) | 0 (0%) | 0 (0%) | 579.2 |
| 1967 | 259.9 (69.2%) | 0.1 (*) | 1.2 (0.3%) | 375.5 |
| 1968 | 55.0 (9.4%) | 90.2 (15.4%) | 37.4 (6.4%) | 585.4 |
| 1969 | 51.5 (25.4%) | 0 (*) | 0 (0%) | 202.4 |
| 1970 | 193.8 (33.7%) | 48.4 (8.4%) | 40.2 (7.0%) | 574.3 |
| 1971 | 94.6 (24.1%) | 119.7 (30.5%) | 0 (0%) | 392.9 |
| 1972 | 0 (0%) | 0.3 (1.0%) | 18.2 (63.4%) | 28.7 |
| 1973 | 96.6 (31.4%) | 8.1 (2.6%) | 0 (0%) | 307.4 |
| 1974 | 0.6 (1.2%) | 0.7 (1.4%) | 0 (0%) | 50.6 |
| 1975 | 90.3 (8.5%) | 35.4 (3.3%) | 0 (0%) | 1,063.4 |
| 1976 | 0 (0%) | 0.1 (0.1%) | 35.4 (26.0%) | 136.4 |
| 1977 | 881.7 (68.1%) | 56.3 (4.4%) | 0 (0%) | 1,293.9 |
| 1978 | 63.6 (18.0%) | 6.3 (1.8%) | 29.7 (8.4%) | 352.6 |
| 1979 | 964.8 (32.3%) | 121.7 (4.1%) | 0 (0%) | 2,990.9 |
| 1980 | 133.3 (15.0%) | 12.8 (1.4%) | 155.8 (17.4%) | 889.7 |
| 1981 | 1,140.9 (35.7%) | 395.1 (12.3%) | 32.6 (1.0%) | 3,199.2 |
| 1982 | 44.0 (8.0%) | 8.7 (1.6%) | 137.4 (24.9%) | 551.6 |
| 1983 | 140.0 (15.1%) | 55.0 (5.9%) | 27.1 (2.9%) | 927.6 |
| 1984 | 84.6 (12.1%) | 4.4 (0.6%) | 122.3 (17.5%) | 700.6 |
| 1985 | 455.6 (37.0%) | 150.8 (12.3%) | 74.6 (6.1%) | 1,229.7 |
| 1986 | 304.0 (21.6%) | 97.8 (6.9%) | 36.5 (2.6%) | 1,408.3 |
| 1987 | 3.0 (1.5%) | 20.9 (10.4%) | 11.8 (5.9%) | 201.4 |
| 1988 | 5.9 (0.6%) | 0.2 (*) | 0.5 (0.1%) | 921.3 |
| 1989 | 0 (0%) | 43.0 (3.3%) | 0 (0%) | 1,296.9 |
| 1990 | 169.1 (44.1%) | 0.2 (0.1%) | 0 (0%) | 383.7 |
| 1991 | 289.7 (35.0%) | 10.6 (1.3%) | 0 (0%) | 828.7 |
| 1992 | 0.1 (*) | 0 (0%) | 0 (0%) | 479.8 |
| 1993 | 26.6 (3.1%) | 13.8 (1.6%) | 0.7 (0.1%) | 866.8 |
| 1994 | 1.6 (0.1%) | 11.6 (0.7%) | T (*) | 1,647.9 |
| 1995 | 0 (0%) | 21.4 (0.8%) | 0 (0%) | 2,848.5 |
Regarding chum salmon (see Table 9-6), the Nuka Bay harvest was fairly strong in both 1960 and 1961; the bay yielded more than 3% of the Lower Cook Inlet harvest in both years. During the following two years, however, the chum runs there slid into insignificance. As with pink salmon, the Nuka Bay harvests were consistently greater than in Resurrection Bay, which had almost no harvest activity, while the Port Dick harvest was many times greater than in Nuka Bay.
Table 9-6. Commercial Chum Salmon Harvest for Selected Lower Cook Inlet Bays, 1959-1995
Figures given are in numbers of fish (in thousands), while percentages are those of the entire Lower Cook Inlet catch. (Lower Cook Inlet includes all Kenai Peninsula Streams between Anchor Point and Cape Fairfield, plus all west-side waters between Cape Douglas and the Iniskin Peninsula.) Source: ADF&G, 1995 Lower Cook Inlet Annual Finfish Management Report, Appendix Table 22. T = trace (i.e., fewer than 50 fish), * - less than 0.1%.
| Year | Port Dick Bay | Nuka Bay | Resurrection Bay | Total, Lower Cook Inlet |
| 1959 | 42.4 (38.3%) | 1.7 (1.5%) | 0.1 (0.1%) | 110.8 |
| 1960 | 53.9 (46.4%) | 8.4 (7.2%) | 0.5 (0.4%) | 116.1 |
| 1961 | 36.8 (66.2%) | 1.7 (3.1%) | 0 (0%) | 55.6 |
| 1962 | 112.0 (62.5%) | 0.5 (0.3%) | 0 (0%) | 179.3 |
| 1963 | 110.8 (80.0%) | 1.5 (1.1%) | 0 (0%) | 138.5 |
| 1964 | 227.4 (70.3%) | 0 (0%) | 0 (0%) | 323.3 |
| 1965 | 14.2 (50.5%) | 0 (0%) | 0 (0%) | 28.1 |
| 1966 | 60.9 (47.2%) | 0 (0%) | 0 (0%) | 129.1 |
| 1967 | 36.0 (42.2%) | 1.5 (1.8%) | 0.1 (0.1%) | 85.4 |
| 1968 | 10.9 (14.5%) | 6.9 (9.2%) | 0.7 (0.9%) | 75.1 |
| 1969 | 5.4 (8.8%) | 0 (0%) | 0 (0%) | 61.2 |
| 1970 | 21.8 (9.7%) | 5.9 (2.6%) | 0.4 (0.2%) | 224.2 |
| 1971 | 0.7 (0.5%) | 0.1 (0.1%) | 0.4 (0.3%) | 148.6 |
| 1972 | 0 (0%) | 2.3 (3.0%) | 0.7 (0.9%) | 75.5 |
| 1973 | 33.4 (28.9%) | 40.8 (35.3%) | 0 (0%) | 115.5 |
| 1974 | 8.1 (42.2%) | 3.9 (20.3%) | 0 (0%) | 19.2 |
| 1975 | 6.8 (31.5%) | 3.6 (16.7%) | 0 (0%) | 21.6 |
| 1976 | 0 (0%) | 0.4 (0.8%) | 0 (0%) | 50.8 |
| 1977 | 25.6 (17.6%) | 17.4 (11.9%) | 0 (0%) | 145.8 |
| 1978 | 10.3 (14.0%) | 0.4 (0.6%) | 0.1 (0.1%) | 73.5 |
| 1979 | 79.0 (36.2%) | 14.7 (6.7%) | 0 (0%) | 218.5 |
| 1980 | 19.0 (25.9%) | 7.8 (10.6%) | 0.7 (1.0%) | 73.5 |
| 1981 | 85.8 (25.5%) | 3.8 (1.1%) | 2.4 (0.7%) | 336.1 |
| 1982 | 30.3 (15.3%) | 0.9 (0.4%) | 7.7 (3.9%) | 198.0 |
| 1983 | 18.0 (9.4%) | 0.8 (0.4%) | 6.9 (3.6%) | 192.3 |
| 1984 | 1.9 (2.1%) | 0.2 (0.2%) | 3.0 (3.2%) | 92.5 |
| 1985 | 9.6 (31.4%) | 0.8 (2.6%) | 3.0 (9.8%) | 30.6 |
| 1986 | 10.4 (12.6%) | 1.3 (1.6%) | 3.5 (4.2%) | 82.7 |
| 1987 | 27.1 (17.3%) | 1.6 (1.0%) | 13.9 (8.9%) | 157.0 |
| 1988 | 64.4 (20.0%) | 6.8 (2.1%) | 23.9 (7.4%) | 321.9 |
| 1989 | 0 (0%) | 0 (0%) | 0 (0%) | 11.3 |
| 1990 | 0.5 (7.1%) | T (*) | 0 (0%) | 7.0 |
| 1991 | 13.7 (56.6%) | T (*) | 0 (0%) | 24.2 |
| 1992 | 0.2 (1.0%) | 0 (0%) | 0 (0%) | 22.2 |
| 1993 | 0.7 (15.9%) | T (*) | 0 (0%) | 4.4 |
| 1994 | T (*) | T (*) | 2.5 (45.5%) | 5.5 |
| 1995 | 0 (0%) | 0.1 (0.6%) | 0.3 (1.9%) | 15.6 |
As to the sockeye run (see Table 9-7), the number of fish caught in both Aialik Bay and Nuka Bay was no larger, in general, than either the pink or chum harvest. But because the Lower Cook Inlet is not normally considered a significant sockeye region, these two bays often contributed more than 10% of the region's total harvest. More important, sockeye salmon's relatively high value (more than twice the price, on a per-pound basis, than either pinks or chums) ensured that both fishers and agency officials paid especial attention to the health of those runs. The Nuka Bay and Aialik Bay runs were far greater than were those in adjacent districts along Kenai Peninsula's southern coast.
Table 9-7. Commercial Sockeye Salmon Harvest for Selected Lower Cook Inlet Bays, 1959-1995
Figures given are in numbers of fish (in thousands), while percentages are those of the entire Lower Cook Inlet catch. (Lower Cook Inlet includes all Kenai Peninsula Streams between Anchor Point and Cape Fairfield, plus all west-side waters between Cape Douglas and the Iniskin Peninsula.) Source: ADF&G, 1995 Lower Cook Inlet Annual Finfish Management Report, Appendix Table 14. T = trace (i.e., fewer than 50 fish), * - less than 0.1%.
| Year | Port Dick Bay | Nuka Bay | Resurrection Bay | Total, Lower Cook Inlet |
| 1959 | 1.3 (6.0%) | 8.3 (38.4%) | 0 (0%) | 21.6 |
| 1960 | 0.2 (0.8%) | 6.7 (27.1%) | 0.1 (0.4%) | 24.7 |
| 1961 | 4.3 (18.9%) | 8.2 (36.0%) | 0 (0%) | 22.8 |
| 1962 | 2.6 (10.3%) | 5.1 (20.2%) | 0 (0%) | 25.3 |
| 1963 | 0.5 (3.3%) | 0.5 (3.3%) | 0 (0%) | 15.1 |
| 1964 | 0 (0%) | 0 (0%) | 0 (0%) | 20.7 |
| 1965 | 0 (0%) | 2.0 (14.3%) | 0 (0%) | 14.0 |
| 1966 | 0 (0%) | 0 (0%) | 0 (0%) | 15.3 |
| 1967 | 0 (0%) | 2.2 (7.6%) | 0 (0%) | 29.0 |
| 1968 | 0 (0%) | 1.5 (1.6%) | 74.5 (78.3%) | 95.2 |
| 1969 | 0 (0%) | 0 (0%) | 99.4 (80.9%) | 122.8 |
| 1970 | 3.1 (13.9%) | 1.0 (4.5%) | 1.7 (7.6%) | 22.3 |
| 1971 | 0 (0%) | 1.6 (7.2%) | 2.2 (9.9%) | 22.2 |
| 1972 | 0.3 (0.5%) | 26.1 (45.1%) | 0.1 (0.2%) | 57.9 |
| 1973 | 3.1 (10.6%) | 1.5 (5.1%) | 0 (0%) | 29.2 |
| 1974 | 0.2 (0.7%) | 0.2 (0.7%) | 0 (0%) | 27.4 |
| 1975 | 0.6 (2.1%) | 0 (0%) | 0 (0%) | 28.1 |
| 1976 | 0 (0%) | 18.9 (32.5%) | 0 (0%) | 58.2 |
| 1977 | 5.8 (5.8%) | 32.5 (32.5%) | 0 (0%) | 100.1 |
| 1978 | 0 (0%) | 10.7 (6.8%) | 0 (0%) | 156.4 |
| 1979 | 0 (0%) | 24.4 (37.9%) | 0 (0%) | 64.4 |
| 1980 | 0.1 (0.1%) | 21.5 (31.0%) | 0 (0%) | 69.4 |
| 1981 | 8.7 (7.9%) | 17.2 (15.6%) | 0.6 (0.6%) | 110.3 |
| 1982 | 3.0 (2.2%) | 66.3 (50.5%) | 0 (0%) | 131.3 |
| 1983 | 25.9 (13.8%) | 16.8 (9.0%) | 0 (0%) | 187.6 |
| 1984 | 50.8 (18.9%) | 29.2 (10.9%) | 3.4 (1.3%) | 269.0 |
| 1985 | 24.1 (8.6%) | 91.8 (32.9%) | 0.3 (0.1%) | 278.7 |
| 1986 | 3.0 (1.3%) | 48.4 (20.6%) | 0 (0%) | 234.9 |
| 1987 | 3.5 (1.4%) | 31.8 (12.8%) | 0.2 (0.1%) | 248.8 |
| 1988 | 20.2 (6.3%) | 9.5 (3.0%) | 0 (0%) | 319.0 |
| 1989 | 8.5 (5.2%) | 10.3 (6.3%) | 0 (0%) | 163.3 |
| 1990 | 7.7 (3.8%) | 5.7 (2.8%) | 0 (0%) | 203.9 |
| 1991 | 4.7 (1.5%) | 1.8 (0.6%) | 0 (0%) | 317.9 |
| 1992 | 0.4 (0.2%) | 0 (0%) | 0 (0%) | 176.6 |
| 1993 | 0.2 (0.1%) | 3.5 (1.5%) | 1.7 (0.7%) | 233.8 |
| 1994 | 0.6 (0.5%) | 5.9 (5.1%) | 9.0 (7.8%) | 115.4 |
| 1995 | 2.0 (0.8%) | 17.6 (6.6%) | 44.6 (16.8%) | 265.4 |
The Good Friday Earthquake and Its Aftermath
At 5:36 p.m. on March 27, 1964, a massive earthquake struck southcentral Alaska. The earthquake measured between 8.2 and 8.4 on the Richter scale; its epicenter was near the north end of College Fjord, approximately 50 miles west of Valdez. The earthquake and the resulting aftershocks, tsumanis and submarine landslides killed 115 people and caused an estimated $380 to $500 million in property damage. [64]
The earthquake devastated Seward, where 11 deaths were recorded and property damage totaled more than $14.6 million. The quake hit Seward, and the park coastline, particularly hard because although the epicenter was more than 100 miles to the northeast, the earthquake's main fault line (and thus its "area of epicenter") paralleled the coast and included most of the park. The park was thus subject to many of the quake's most devastating effects. The earthquake in the park lasted from 2-1/2 to 5 minutes. [65]
One of the earthquake's most substantial impacts was its effect on land elevations. Some areas of southcentral Alaska, in effect, rose from the sea; one site on Montague Island (in Prince William Sound) rose 33 feet. The area within the park, however, was in a zone of subsidence. Maps published as a result of post-earthquake scientific studies show that the quake's "axis of maximum subsidence" went right through the park; it was a sinuous line that wound from the western end of Kenai Lake to the eastern edge of Nuka Island. Areas that were relatively distant from that axis subsided only slightly; the southern tip of Aialik Peninsula, for instance, sank only a foot. But Aialik Bay dropped 4.5 feet, both Two Arm Bay and Shelter Cove (the latter in Nuka Bay) subsided 5.4 feet, and both Beauty Bay (in Nuka Bay) and Chance Cove (just east of McArthur Pass) dropped 6.6 feet. Some areas astride the axis fell as much as 7.5 feet. Near the Sather residence, on the western side of Nuka Island, the water rose and covered part of the warehouse; the quake also destroyed the adjacent boat dock. [66]
The other major impact caused by the March 27 earthquake was a series of tsunamis (large waves) that hit the coast within one-half hour of the quake. The quake generated a large tsunami out in the Gulf of Alaska; the tsunami rose in height as it reached the coast due to the funneling effect of the various fjords. In Resurrection Bay, the tsunami was an estimated 30 to 40 feet high as it neared the bay's northern end; a 30-foot wave slammed into Thumb Cove, on the bay's eastern side, and it was at least that high when it reached Seward. Waves entering Aialik Bay were far higher. [67] Gene Rusnak, a USGS employee, observed that a wave between 90 and 100 feet high hit on either side of Aialik Bay's terminus; spruce trees up to 18 inches in diameter were snapped throughout the area where the wave hit. These waves were particularly devastating because the quake generated submarine landslides that exacerbated the tsunami's effects. Huge waves also hit Port Dick; other bays between there and Aialik Bay were also probably affected, but specific details are lacking. [68]
The lowering of the landmass, in combination with the effects of the tsunami, had devastating consequences on the park's fish population. Both factors, particularly the former, inundated the gravel at stream mouths that was key to pink and chum salmon spawning. (The earthquake had varying impacts on sockeye populations, where spawning took place in upstream lakes; the Aialik Bay population was wiped out for years afterward, probably because of the tsunami's effects, while at Delight and Desire creeks, the impacts were significant but not devastating.) [69] The salmon industry was also crippled because facilities were destroyed. The quake wrecked canneries in Seldovia and elsewhere in lower Cook Inlet. In Seward, four seafood processors were destroyed; of those, Halibut Producers' Co-operative was back on line a year later, but Seward Seafoods and the other processors never reopened. Many fishing boats were destroyed in both locations, and the quake resulted in the death of at least one Seward-area fisherman. [70]
Statistics for the remainder of the decade illustrate the extent of the earthquake's destruction. Nuka Bay pink salmon harvests for 1964 were low, although within a normal range; but for the next three years they were almost nonexistent. The only productive year for the remainder of the decade was 1968, when the Nuka Bay fishery constituted more than 15 percent of the total Lower Cook Inlet pink salmon harvest. Similar impacts were recorded in nearby Resurrection Bay. But in Port Dick, to the west, the quake had few if any impacts on the pink harvest.
Chum salmon harvests followed a similar pattern. In both Nuka Bay and Resurrection Bay, no chum harvest was recorded from 1964 through 1966, inclusively. Both bays recorded a fairly healthy harvest in 1968 but none in 1969. The Port Dick area, meanwhile, saw chum harvest tumble from more than 100,000 per year during the 1962-64 period to just 10,000 fish in 1968 and 5,000 in 1969.
In regard to sockeye harvests, Aialik Bay suffered catastrophic devastation in the earthquake; no harvests of the species were recorded between 1964 and 1969, inclusively. Nuka Bay fared better, but only slightly; harvests during those years were recorded only in 1965, 1967, and 1968, and the harvests that were recorded lagged behind those that predated the earthquake. In Resurrection Bay, where sockeyes had been off-limits to fishermen for years, no harvests were recorded until 1968, when a hatchery program brought huge numbers of sockeyes. They remained high for another year, then dropped back to insignificant levels.
Fishing in Park Waters, 1970 to Present
No sooner had salmon populations begun to rebound from the earthquake's devastation than another hazard–cold weather–impacted the park's fishery. The winters of both 1970-71 and 1971-72 were "extremely cold years" in the words of the Lower Cook Inlet fisheries biologist. As a result of the environmental stress caused by those winters, the salmon runs and harvests were hit hard. As late as 1977, the East Arm of Nuka Bay was "kept closed to build up pink and chum stock depleted by the 1964 earthquake and severe winter conditions in the early 1970s." [71]
This report is intended to trace the major historical developments in the park's fishery. It is not the place to chronicle or explain the annual salmon harvests, particularly since the mid-1970s. The report shall, however, cover some of the major new actions that have affected the park's fishery in recent years (see Table 9-8 and Map 9-4).
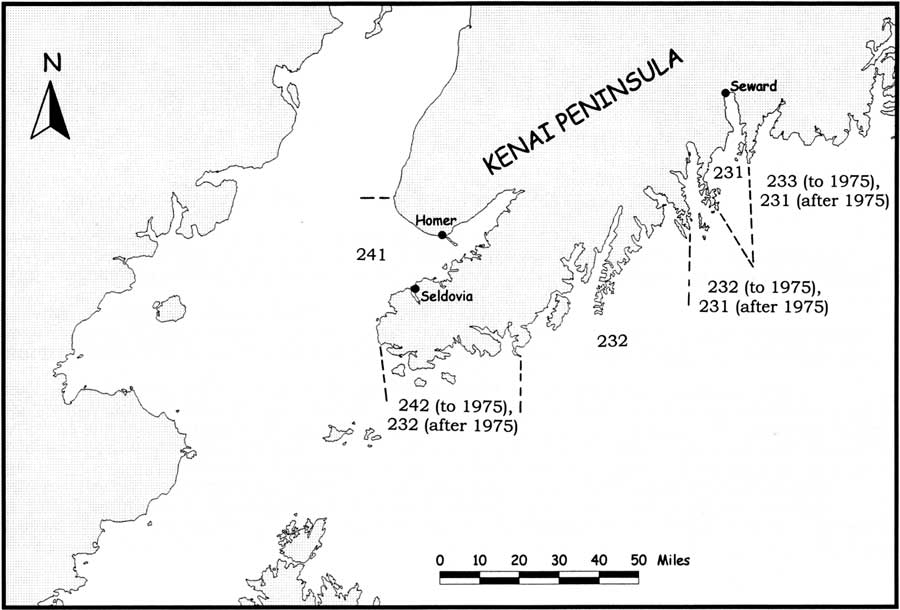
|
| Map 9-4. Lower Cook Inlet Statistical Areas, 1968-1995. (click on image for an enlargement in a new window) |
Table 9-8. Statistics on Park-Area (Statistical Area 232) Salmon Fishing, 1968-1995
| Year | chinook salmon (410) (#/pounds) |
sockeye salmon (420) (#/pounds) |
coho salmon (430) (#/pounds) |
pink salmon (440) (#/pounds) |
chum salmon (450) (#/pounds) |
salmon total (#/pounds) |
| 1968 | -0- | 4/ n.d. | 3/ n.d. | 13,155/ n.d. | 84/ n.d. | 13/246/ n.d. |
| 1969 | -0- | 92/ n.d. | 11/ n.d. | 51,533/ n.d. | 5,400/ n.d. | 57,036/ n.d. |
| 1970 | 2/ 54 | 4,129/ 21,470 | 19/ 116 | 59,518/ 214,261 | 6,602/ 44,234 | 70,270/ 280,135 |
| 1971 | 11/ 47 | 1,626/ 9,749 | 17/ 94 | 119,661/ 420,605 | 56/ 413 | 121,371/ 430,908 |
| 1972 | 7/ 37 | 26,420/154,665 | 3/ 16 | 682/ 2,394 | 2,434/ 18,369 | 29,546/ 175,481 |
| 1973 | 1/ 30 | 5,052/ 31,984 | 4/ 34 | 10,031/ 34,179 | 40,909/ 351,028 | 55,997/ 417,255 |
| 1974 | 1/ 30 | 398/ 1,917 | 27/ 204 | 1,082/ 4,380 | 3,871/ 31,045 | 5,379/ 37,576 |
| 1975 | -0- | 710/ 3,894 | 1/ 8 | 35,886/ 119,402 | 3,648/ 25,778 | 40,245/ 149,082 |
| 1976 | 7/ 42 | 18,886/117,509 | -0- | 93/ 333 | 412/ 3,383 | 19,398/ 121,267 |
| 1977 | 34/ 279 | 33,733/257,372 | 1,528/ 6,014 | 1,127,800/4,236,975 | 70,167/ 631,916 | 1,233,262/5,132,556 |
| 1978 | 236/11,031 | 10,695/ 71,597 | 45/ 365 | 70,080/ 256,708 | 19,224/ 144,071 | 100,280/ 483,772 |
| 1979 | 30/ 346 | 25,297/167,662 | 142/ 1,068 | 1,945,529/6,713,115 | 180,558/1,526,669 | 2,151,556/8,408,860 |
| 1980 | 10/ 77 | 22,514/121,500 | 16/ 133 | 154,041/ 506,266 | 32,246/ 248,250 | 208,827/ 876,226 |
| 1981 | 61/ 833 | 18,133/109,835 | 485/ 2,174 | 1,714,115/6,687,327 | 238,393/1,912,968 | 1,971,187/8,713,137 |
| 1982 | 129/ 1,629 | 66,781/431,669 | 92/ 949 | 67,523/ 224,550 | 63,075/571,414 | 197,600/1,230,211 |
| 1983 | 14/ (CD) | 16,835/ 95,547 | 54/ 479 | 199,794/ 666,357 | 27,203/ 241,565 | 243,900/1,003,948 |
| 1984 | 3/ (CD) | 29,276/144,046 | 41/ 412 | 89,085/ 319,979 | 3,204/ 26,900 | 121,609/ 491,337 |
| 1985 | 19/ 121 | 91,957/499,664 | 3,210/39,571 | 618,222/2,322,644 | 11,844/ 100,425 | 725,252/2,962,425 |
| 1986 | 6/ 64 | 48,472/278,627 | 5,052/53,003 | 401,755/1,399,956 | 11,701/ 93,571 | 466,986/1,825,221 |
| 1987 | 14/ 118 | 31,845/210,437 | 2,481/22,283 | 23,890/ 88,922 | 28,663/221,052 | 86,893/ 542,812 |
| 1988 | 5/ 88 | 9,501/ 58,788 | 2/ (CD) | 6,094/ 21,109 | 71,202/ 640,101 | 86,804/ 720,086 |
| 1989 | 1/ (CD) | 10,286/ 60,244 | 72/ (CD) | 52,677/ 181,767 | 43/ 276 | 63,073/ 242,287 |
| 1990 | 2/ (CD) | 17,404/ 76,966 | 74/ 483 | 191,320/ 585,250 | 614/ 4,121 | 209,412/ 666,820 |
| 1991 | 2/ (CD) | 6,408/ 30,207 | 12/ 70 | 359,664/ 992,328 | 14,337/ 95,915 | 380,423/1,118,520 |
| 1992 | -0- | 572/ (CD) | 1/ (CD) | 146/ 490 | 181/ 1,633 | 900/ 2,123 |
| 1993 | 2/ (CD) | 4,613/ 27,012 | 119/ 937 | 159,159/ 461,911 | 970/ 6,607 | 164,863/ 496,467 |
| 1994 | -0- | 5,930/ 31,620 | 993/10,342 | 13,200/ 41,574 | 32/ (CD) | 20,155/ 83,536 |
| 1995 | 12/ 141 | 17,642/ 96,224 | 1,272/ 8,868 | 192,098/ 601,532 | 474/ 3,344 | 211,498/ 710,109 |
Explanatory Notes to Table 9-8:
Species Identification: Salmon statistics, over the years, have been tabulated for Area 232; the specific stretch of coastline defined within this statistical area is defined in "Area Identification," below. The three-digit numbers following each species name have been assigned by the ADF&G to identify the various species.
Area Identification: There is a line between the 1973 and 1974 figures, and also between the 1975 and 1976 figures, because of changes in the geographical area in Statistical Area 232. From 1968 through 1973, Area 232 included the stretch of coastline between Gore Point and Aialik Cape. After the 1973 season, the statistical area’s eastern boundary was moved west from Aialik Cape to Aligo Point; that action moved Statistical Area 231 (which included Resurrection Bay) west to include Aialik Bay. After 1975, the western boundary of Statistical Area 232 was moved west from Gore Point to Point Adam; after that action, Statistical Area 232 included all of former Statistical Area 242). As a result of this action, post-1975 figures for Area 232 are identical with those for the Outer District. In addition, post-1975 figures (and, to a lesser extent, 1974 and 1975 figures) are not as accurate a guide to park fishing activity as are the 1968-1973 figures.
BOLD numbers indicate the most prevalent species for a given year. Numbers in ITALICS, provided in the "total/pounds" column, are less than the total for all salmon species because one or more columns have no data due to confidentiality restrictions.
(CD) — confidential data. When fewer than four permittees fished for a given species in a given year, ADF&G censors harvest data in order to protect the privacy of an individual permittee’s harvest. The term "CD", therefore, shows that there were 1, 2, or 3 active permittees.
Source: Herman Savikko (ADF&G, Juneau) letter, June 12 and July 11, 1997.
A major management change, inaugurated in 1975, altered the system by which Alaska's salmon have been harvested. The Alaska Commercial Fisheries Entry Commission, for the first time, began issuing limited entry permits to potential fishers. That system limited the number of fishers active in any given fishery and thus exerted greater management control. The average annual harvest volume, both on a per-boat and total yield basis, rose after the new system was implemented; increases were seen both in park waters and elsewhere in Lower Cook Inlet. Total harvest volumes in park waters remained relatively high for more than a decade after the limited entry system was implemented. There is no evidence that harvest volumes increased due to the new system; instead, salmon productivity probably rose due to improved stream and harvest management techniques. [72]
Another significant change in the park fishery took place in 1987. Prior to that year, the only approved salmon harvesting methods along the outer coast were by hand purse seines (or "pocket seines") and beach seines; these seines could only be used near the coastline or in shallow waters. In 1987, however, a group of seiners prevailed on the Board of Fisheries to modify the regulations in order to allow the use of power purse seines. These seines were attached to larger boats; they allowed fishers to harvest the resource more efficiently and gave fishers from other areas (where power purse seines had been legalized years before) the flexibility to fish the outer coast's waters. [73]
Changes were also taking place in the Delight and Desire lakes area of Nuka Bay. In 1972, fishers harvested the creek system's first major sockeye run; it totaled 26,100 fish, which was more than three times any previous harvest. After a lull, harvest levels shot up again in 1976. To gain more data about the area's salmon resource, Fish and Game personnel spent the following two summers maintaining a counting weir in the area. [74]
Meanwhile, a new salmon-bearing stream was emerging from the retreating ice of McCarty Fjord. North of Desire Lake, a new lake began to be seen which, as late as 1974, had been covered by a glacier. The lake, variously called Delectable, Delusion, or Ecstacy Lake, first appeared in 1985 or 1986; it has been contributing to Nuka Bay's salmon harvest since the late 1980s, if not before.
In 1985, the Delight-Desire area supported a substantial coho (silver) salmon harvest for the first time. Coho salmon, historically, had never been numerous along the Kenai's southern coast; since 1954, harvest levels had never exceeded 2,000 and had exceeded 500 only three times. But in each of the three years from 1985 through 1987, more than 2,000 salmon were harvested in the Outer District, many of them from the Delight-Desire lake system. [75]
As a final note pertaining to the park's salmon fishery, the creation of a limited entry permit system under the Commercial Fisheries Entry Commission (and the statistical data bases that were a by-product of that commission) allowed park managers to accurately recognize, for the first time, the residence of park fishers. As noted above, anecdotal evidence has suggested that the first commercial salmon fishers in the fjords hailed from Seward. Cook Inlet fishers did not sail east of Gore Point; as one longtime Homer fisherman phrased it, there was "kind of a gentlemen's agreement in the early days not to invade each other's territory." [76] As early as the late 1940s, however, Fish and Wildlife Service records were noting that a Port Graham fisherman was active in Nuka Bay. Fisheries personnel stationed in park waters during the mid-1950s suggested that most Nuka Bay salmon fishers were either from Lower Cook Inlet or from locations away from the Kenai Peninsula, while most Aialik Bay fishermen were based in Seward. Biologists were also quick to note that many salmon fishers passed through the area and had valid permits to fish in park waters; some of those people, however, did not fish there. [77] No statistical evidence to prove or disprove these generalities was available until 1975 (see Table 9-9).
Table 9-9. Residence of Commercial Salmon Fishers Active in Kenai Fjords National Park, 1975-1995
The following chart shows the residence of permit holders who actively fished all species of salmon, for commercial purposes only, in the waters of Kenai Fjords National Park (Statistical Area 232) from 1975 to 1995. Note: In 1975 and 1976, Statistical Area 232 extended east to Aialik Cape (and thus included Aialik Bay), but from 1977 through 1995, the coast east of Aligo Point (including Aialik Bay) was in another statistical area.
The areas of residence are defined as follows:
| Homer Area = Homer, Anchor Point, Halibut Cove | Seward = Seward (only) |
| Seldovia Area = Seldovia, Port Graham, Nanwalek (English Bay) | Other = all other locations |
| Homer Area | Seldovia Area | Seward | Other | Total | |||||
|---|---|---|---|---|---|---|---|---|---|
| Year | number | % of total | number | % of total | number | % of total | number | % of total | number |
| 1975/fishers | 0 | 0.0% | 2 | 25.0% | 2 | 25.0% | 4 | 50.0% | 8 |
| fish | 0 | 0.0% | n.d. | n.d. | n.d. | n.d. | 10,357 | 25.7% | 40,245 |
| 1976/fishers | 3 | 20.0% | 7 | 46.7% | 4 | 26.7% | 1 | 6.7% | 15 |
| fish | n.d. | n.d. | 12,815 | 66.1% | 1,975 | 10.2% | n.d. | n.d. | 19,398 |
| 1977/fishers | 22 | 40.0% | 20 | 36.4% | 9 | 16.4% | 4 | 7.3% | 55 |
| fish | 609,128 | 49.4% | 455,764 | 37.0% | 145,543 | 11.8% | 22,827 | 1.9% | 1,233,262 |
| 1978/fishers | 10 | 25.6% | 16 | 41.0% | 8 | 20.5% | 5 | 12.8% | 39 |
| fish | 12,090 | 12.1% | 38,058 | 38.0% | 46,407 | 46.3% | 3,725 | 3.7% | 100,280 |
| 1979/fishers | 22 | 34.9% | 23 | 36.5% | 10 | 15.9% | 8 | 12.7% | 63 |
| fish | 878,866 | 40.8% | 676,727 | 31.5% | 348,875 | 16.2% | 247,088 | 11.5% | 2,151,556 |
| 1980/fishers | 20 | 37.0% | 20 | 37.0% | 6 | 11.1% | 8 | 14.8% | 54 |
| fish | 87,926 | 42.1% | 68,648 | 32.9% | 24,924 | 11.9% | 26,756 | 12.8% | 208,827 |
| 1981/fishers | 25 | 37.3% | 19 | 28.4% | 10 | 14.9% | 13 | 19.4% | 67 |
| fish | 880,137 | 44.7% | 460,062 | 23.3% | 304,516 | 15.4% | 326,472 | 16.6% | 1,971,187 |
| 1982/fishers | 15 | 36.6% | 16 | 39.0% | 6 | 14.6% | 4 | 9.8% | 41 |
| fish | 69,068 | 35.0% | 71,861 | 36.4% | 37,435 | 18.9% | 19,236 | 9.7% | 197,600 |
| 1983/fishers | 11 | 25.0% | 17 | 38.6% | 9 | 20.5% | 7 | 15.9% | 44 |
| fish | 72,552 | 29.7% | 77,292 | 31.7% | 71,509 | 29.3% | 21,806 | 8.9% | 243,886 |
| 1984/fishers | 8 | 25.0% | 14 | 43.8% | 5 | 15.6% | 5 | 15.6% | 32 |
| fish | 20,336 | 16.7% | 67,495 | 55.5% | 5,116 | 4.2% | 30,849 | 25.4% | 121,606 |
| 1985/fishers | 10 | 28.6% | 10 | 28.6% | 10 | 28.6% | 5 | 14.3% | 35 |
| fish | 196,418 | 27.1% | 207,355 | 28.6% | 242,621 | 33.5% | 78,858 | 10.9% | 725,252 |
| 1986/fishers | 13 | 32.5% | 10 | 25.0% | 9 | 22.5% | 8 | 20.0% | 40 |
| fish | 162,407 | 34.8% | 119,472 | 25.6% | 118,564 | 25.4% | 66,543 | 14.2% | 466,986 |
| 1987/fishers | 9 | 28.1% | 8 | 25.0% | 9 | 28.1% | 6 | 18.8% | 32 |
| fish | 13,083 | 15.1% | 18,893 | 21.7% | 45,882 | 52.8% | 9,035 | 10.4% | 86,893 |
| 1988/fishers | 13 | 41.9% | 7 | 22.6% | 9 | 29.0% | 2 | 6.5% | 31 |
| fish | 53,311 | 61.4% | 15,785 | 18.2% | 17,204 | 19.8% | 502 | 0.6% | 86,802 |
| 1989/fishers | 2 | 20.0% | 3 | 30.0% | 3 | 30.0% | 2 | 20.0% | 10 |
| fish | n.d. | n.d. | n.d. | n.d. | n.d. | n.d. | n.d. | n.d. | 63,006 |
| 1990/fishers | 22 | 46.8% | 8 | 17.0% | 6 | 12.8% | 11 | 23.4% | 47 |
| fish | 71,150 | 34.0% | 39,923 | 19.1% | 18,124 | 8.7% | 80,217 | 38.3% | 209,412 |
| 1991/fishers | 18 | 51.4% | 6 | 17.1% | 5 | 14.3% | 6 | 17.1% | 35 |
| fish | 210,197 | 55.3% | 76,524 | 20.1% | 9,301 | 2.4% | 84,401 | 22.2% | 380,421 |
| 1992/fishers | 2 | 40.0% | 1 | 20.0% | 1 | 20.0% | 1 | 20.0% | 5 |
| fish | n.d. | n.d. | n.d. | n.d. | n.d. | n.d. | n.d. | n.d. | 327 |
| 1993/fishers | 10 | 47.6% | 5 | 23.8% | 3 | 14.3% | 3 | 14.3% | 21 |
| fish | 79,373 | 48.1% | 7,732 | 4.7% | n.d. | n.d. | n.d. | n.d. | 164,861 |
| 1994/fishers | 1 | 16.6% | 2 | 33.3% | 3 | 50.0% | 0 | 0.0% | 6 |
| fish | n.d. | n.d. | n.d. | n.d. | n.d. | n.d. | n.d. | n.d. | 20,123 |
| 1995/fishers | 5 | 38.5% | 3 | 23.1% | 4 | 30.8% | 1 | 7.7% | 13 |
| fish | 127,984 | 60.5% | n.d. | n.d. | 38,495 | 18.2% | n.d. | n.d. | 211,498 |
Source: State of Alaska, Commercial Fisheries Entry Commission, "Salmon Seine Statistics by Residence City Areas, 1975-1995" (Project Number 97146), September 8, 1997. n.d.=no data.
Commercial Fisheries Entry Commission statistics suggest, fairly conclusively, that a majority of the salmon fishers active in Statistical Unit 232 (which includes most of the park's waters) during the 1975-1995 period have been Lower Cook Inlet residents. Not surprisingly, those fishers have been responsible for a majority of the salmon harvested. In 1977, for example, 76.4% of the fishers harvested in Statistical Area 232 hailed from Lower Cook Inlet communities; these fishers were responsible for 86.4% of the fish harvest. In 1980, Lower Cook Inlet fishers comprised 74% of all park fishers and brought in 75.0% of the area's salmon harvest; and in 1983, Lower Cook Inlet residents accounted for 63.6% of all park fishers and 61.4% of the salmon harvest. The only years in which Lower Cook Inlet fishers did not account for a majority of park-area fishers and a majority of the salmon harvested in the park was in 1975 (when few statistics were available) and in 1987. Seward-area fishers have generally accounted for between 10 and 35 percent of all park-area fishers, and 10 to 35 percent of the total salmon harvest. Fishers residing away from the Kenai Peninsula have usually accounted for 5 to 25 percent of all park fishers, and 5 to 25 percent of the total salmon harvest.
The Halibut and Cod Fisheries
The waters off the Alaska coast have been attracting commercial cod and halibut fishers for more than a century. In 1884, not long after the first salmon cannery commenced operations, San Francisco-based schooners began to exploit Alaska's cod banks. Two areas were visited: the southeastern Bering Sea and "the southern shore of Alaska" (probably the Gulf of Alaska). In the years that followed, cod boats returned to these areas to an increasing degree. The cod harvest continued to increase until about 1915. [78] The cod banks, however, were miles offshore. The schooners, in most cases, had little or no contact with Alaskans and made few if any port calls.
Another bottomfish, the Pacific halibut, was first harvested in 1888 off the Washington coast. At first, vessels remained close to Puget Sound. Industry development, moreover, proceeded slowly; as late as 1900, the total West Coast harvest was less than 10 million pounds. (From 1930 to 1970, by contrast, the west coast harvest varied from 44 million to 75 million pounds.) Then, in the late 1890s, some of the Seattle-based vessels began fishing the waters of Southeastern Alaska each fall. At first, growth was slow because of the difficulties in getting ice, the relatively high transportation costs, and the long distance to the large volume markets in the East. Soon after the turn of the century, however, Seattle began to assume significance as a halibut center, largely based on the increasing supply of Alaska halibut. [79]
During the new century's first decade, the heightened demand for fresh fish caused the Pacific halibut fleet to move northward in search of new fishing grounds. Fisheries interests recognized that halibut and cod thrived on many of the same banks. A chart issued in 1905 of the North Pacific fishing banks noted that the principal halibut and cod banks were in Alaska waters. The three largest banks, where "codfish and small halibut are numerous and red rock fish fairly abundant," were of particular note. Those three, in rank order, were Baird Bank, in Bristol Bay (9,200 square miles); Portlock Bank, northeast of Kodiak Island (6,800 square miles); and Slime Bank, in the Bering Sea (1,445 square miles). [80] In all probability, little commercial bottomfish harvesting took place in Central or Western Alaska during this period; in the Seward area, the only known commercial activity was an occasional boatload of halibut that was sold directly to local residents. [81]
By 1910, the southeastern Alaska halibut and cod fisheries were in sufficient difficulty that Governor Walter E. Clark conducted a fact-finding mission on the subject. He then wrote to Charles Nagel, the U.S. Secretary of Commerce and Labor. In that letter, he noted that "In the last few years the halibut and cod industries have experienced a large growth, and the fresh fish industry ... has become highly important to the people of Alaska and of the states." He was alarmed, however, "that some of the halibut fishing banks [i.e., those in southeastern Alaska] are seemingly becoming depleted." He therefore urged that the steamer Albatross be ordered to Alaska waters that year to study the problem. In response, the U.S. Fish Commission agreed to send a boat that would "prospect for cod and halibut banks in the waters adjacent to Kodiak Island during the season." [82]
Commercial halibut harvesting in the Gulf of Alaska may have begun as early as 1911, primarily as a result of overfishing in southeastern Alaska waters. [83] By November 1913, further development was in the offing. A news article stated that "A fleet of halibut fishing schooners are outfitting [in Seattle], preparatory to sailing for Alaska to test reported halibut banks off the entrance to Resurrection Bay and Prince William Sound. Should the halibut grounds prove satisfactory, the fleet will continue operations there." [84]
Bottomfish harvesting in the Gulf of Alaska continued, probably in small but increasing volumes, for the next several years. In June 1916, a fishing boat from the new Kenai Fishing and Trading Company saltery on Renard Island (near Seward) "located five banks of cod on its first trip out, and returned to Seward with 500 cod fish for salting." [85]
That fall, industry prospects brightened when the San Juan Fishing and Packing Company agreed to build a cannery in Seward. Plant managers were primarily interested in canning salmon, but they also announced that they would freeze halibut and black cod, along with other species. The new plant was a boon to the local halibut industry; two halibut boats were part of the company-owned fleet, and the company also agreed to buy halibut (and other species) from independent fishers. By March 1917, even before the plant had been completed, the San Juan was already hard at work; the boat caught 176,000 pounds of halibut within 50 miles of Seward and headed south to the company's Seattle plant to process the catch. [86] These halibut, in all probability, were caught either on the Portlock Bank or in Seward Gully, both of which are directly south of the present-day park.
The San Juan's cold storage facility was completed during the summer of 1917. Largely as a result, Seward became an important halibut port. As F. Heward Bell has noted, it was a convenient port to dispose of "broken trips," those catches too small or with fish to old to be run east to the distant railhead ports. Seward also gained prominence as a reoutfitting center–that is, a place for repairs, spare parts, and provisions. The Portlock Bank and other areas in the Gulf of Alaska, by this time, were becoming major bottomfish harvest areas, and Seward was a welcome nearby port for the Seattle-based fleet. The annual number of halibut processed in Seward during this period remained small. [87]
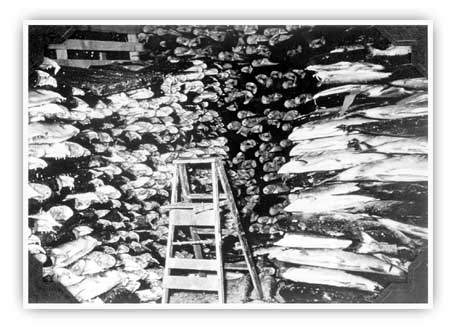
|
| Seward has offered cold storage facilities for the area's fishing fleet for more than fifty years. John Skerry photo, from USF&WS, Cook Inlet Annual Management Report, 1958, 42. |
Seward commercial interests, always hungry for a new economic base, publicized the new industry and tried to lure fish-laden boats–and fisheries capitalists–to the port. Seward, at the time, was booming because it was the terminus of the government railroad, then under construction, and residents hoped that the town's growth potential would lead to additional fisheries facilities. The problem, from Seward's point of view, was that there was little market for Pacific bottomfish on the West Coast. Many halibut boats, therefore, headed straight from the fishing banks to Prince Rupert, B.C., from which Canadian National trains sped shipments to eastern markets. Others, aiming for the frozen-fish market, were willing to drop off their fish at an Alaska port; citing a lack of cold storage capacity, however, they usually took their catches to Juneau, Ketchikan, and elsewhere. [88]
Seward commercial interests waged a campaign that stressed the port's unique location and growth potential. The Pathfinder, a Pioneers of Alaska publication, hyperbolically proclaimed that
Seward is the nearest port to the most extensive halibut banks in the world.... The halibut is found on many banks, and is especially plentiful on the famous banks forty miles out from Resurrection Bay.... This great industry is in its infancy, but will be developed to the full in due time, with the result that Seward is destined to be within the next few years the fishing center of Alaska.... Our halibut have already found the Eastern market by the hundreds of thousands of tons. A marked increase each year is shipped East.... To illustrate the extent and richness of the "Halibut Pay Streak," ... boats have repeatedly brought into Seward catches ranging from 100,000 to 125,000 pounds of halibut each, within a period of from six to nine days. This illustration is not an exception. It is the average. It is usual for boats of from 15 to 20 tons to catch their capacity in one day after arriving at the banks. [89]
Advocates also tried to convince fisheries capitalists to invest in new cold storage and transportation facilities. A 1922 Seward Gateway article intoned that the lack of additional storage space prevented Seward from profiting from the increasing harvest. If one or more plants could be built, it stated,
this town will become the biggest fishing center on the Pacific Coast.... There would be fish for at least ten big cold storage plants on this bay. This means that a couple of hundred fishing boats with crews ranging from three to twenty men would be stationed here.... [But] cold storage plants here must be first assured of transportation [to the] coast cities of the States.... There is no use lying down on the job because some efforts have failed in the past. Keep trying and we are bound to succeed. [90]
Still others claimed that all Seward needed to become a major halibut port was corrective legislation. A 1922 editorial recognized why the industry had been slow to develop and posed a question that called for a legislative response:
It seems strange to the layman that fishing boats will fish on these banks at the very entrance to Resurrection Bay and take their catches [elsewhere]. On first thought it appears that the reason for this is that there is no market here for the fish. True, there is one cold storage plant and it cannot handle but a very small part of the catch.... Why are there not more cold storage plants on Resurrection Bay? [Because] cold storage fish ... cannot compete with fresh fish. There is one thing that will make the cold storage business profitable ... and that is a closed season on halibut fishing.... The cold storage fish will have a market when fresh fish can no longer be had.... When this becomes the case it is safe to say then Seward will become one of the principal fishing centers on the Alaskan coast. [91]
The editorial writer's wish, in fact, soon became reality. Because the abundance of halibut had been declining for years, in both the U.S. and Canada, industry representatives requested international control of the fishery. The two countries drafted a convention in 1922, and on March 2, 1923, representatives from both countries signed the Convention for the Preservation of the Halibut Fishery of the North Pacific Ocean. The convention created the International Fisheries Commission, the forerunner of today's International Pacific Halibut Commission. One of the convention's main provisions was for a three-month closed season; the first closure began on November 15, 1924. [92]
The international treaty, and the three-month closure, did not result in the construction of new cold storage plants in Seward. This period, to be sure, witnessed dramatically increased utilization of existing facilities; this increase, however, was largely coincidental to the imposition of the seasonal closure. Instead, three other factors are cited in attracting increasing halibut volumes to Seward. The first event, in 1922 or 1923, was an increase in capacity in the San Juan plant's cold storage facilities. (As noted above, the plant was primarily a salmon cannery when it opened in 1917. After the 1921 season, however, canning ceased, and the canning floor was probably converted to a halibut cold storage area soon afterward.) In 1923, the plant instituted two other attractions to lure nearby halibut boats; it installed fueling facilities and raised the prices it paid for halibut. The plant made no secret of its intention to "get boats to offload here that normally go to Sitka and Ketchikan." The newspaper crowed that "there is no reason why Seward should not become the center of the halibut fishing industry, as the banks are right against the mouth of the harbor and extend westward for a hundred miles." [93]
The plan worked. In 1923, the San Juan plant announced that it was shipping between 1.5 million and 1.75 million pounds of frozen halibut per annum; a year later, the plant received some 2.5 million pounds of halibut. Halibut volume remained high for the next several years; in 1927, the plant again received 2.5 million pounds. [94] These higher volumes, to a large part, were in part due to San Juan's heightened customer-service orientation; a far more important variable, however, was the sharply increasing level of halibut harvesting. (John P. Babcock, of the International Fisheries Commission, stated in July 1927 that "the amount taken from the banks near Kodiak has tripled in the last three years.") In addition, Seward had the nearest cold-storage plant to the rapidly increasing halibut fishery off the Alaska Peninsula. In 1924, relatively few halibut were being caught in the Gulf of Alaska; the Central Alaska harvest was just one-seventh of that in Southeastern Alaska. But by 1925, halibut fishing was being carried on "as far west as Unimak Island," and in 1927, "fish came into Seward from as far away as 800 miles to the westward"–that is, from the seas surrounding Unalaska Island. Although many of the halibut from this newly-exploited fishery found their way to the San Juan plant, local sources continued to state, conclusively, that the Gulf of Alaska halibut fleet landed the lion's share of its catch in Prince Rupert. [95]
During this period, most of those that fished for halibut in the local waters were Americans; Canadians fished there as well, though on a smaller scale. (Fishermen of other nationalities were not prohibited from harvesting in the area, but did not do so.) [96] Prior to 1929, no comprehensive statistics are available on the specific nature of area fishing (see Table 9-10). The Seward newspaper, however, routinely jotted down details about the local halibut fleet when they emptied their holds at the San Juan dock. To judge by news accounts, few if any boats off-loaded halibut in 1921, but during the spring and summer of 1922 scores of notices appeared. (Typical entries noted that "the halibut boat Constitution arrived in port Sunday with a load of halibut, the cargo of 12,000 pounds being taken by the San Juan Company," and "the halibut boat Gladstone, Capt. Pete Peterson, arrived in port with 28,000 lbs. of halibut, sold to San Juan." [97]
Table 9-10. Annual Halibut Harvest in Statistical Area 25, 1923-1995
Figures provided in the "volume" and "landings" columns are in thousands of pounds of net weight. * - volume has been rounded off to the nearest 10,000 pounds of net weight. m - millions of pounds of net weight.
| Volume of Catch, Area 25 | Total for West Coast |
% of Take |
Area Rank |
Landings @ Seward |
% of West Coast Total | |||
| Canada | U.S. | Total | ||||||
| 1923a | 1.5-1.75 m | |||||||
| 1924b | 2.5 m | |||||||
| 1927b | 2.5 m | |||||||
| 1928c | 1.0 m | |||||||
| 1929 | 103 | 3,204 | 3,307 | 56,928 | 5.8 | 4/45 | 1,400 | 2.4 |
| 1930 | 163 | 2,479 | 2,642 | 49,492 | 5.3 | 5/49 | 1,645 | 3.3 |
| 1931 | 171 | 1,948 | 2,119 | 44,220 | 4.8 | 6/47 | 1,012 | 2.3 |
| 1932 | 92 | 2,935 | 3,027 | 44,454 | 6.8 | 2/44 | 52 | 0.1 |
| 1933 | 89 | 3,695 | 3,784 | 46,795 | 8.1 | 1/45 | 24 | 0.1 |
| 1934 | 126 | 3,340 | 3,466 | 47,546 | 7.3 | 1/41 | 52 | 0.1 |
| 1935 | 0 | 3,465 | 3,465 | 47,343 | 7.3 | 1/41 | 17 | * |
| 1936 | 53 | 3,059 | 3,112 | 48,923 | 6.4 | 3/41 | 25 | 0.1 |
| 1937 | 50 | 3,892 | 3,942 | 49,539 | 8.0 | 1/41 | 6 | * |
| 1938 | 130 | 3,614 | 3,744 | 49,553 | 7.6 | 2/41 | 1 | * |
| 1939 | 62 | 4,393 | 4,455 | 50,903 | 8.8 | 2/40 | 0 | 0 |
| 1940 | 22 | 4,354 | 4,376 | 53,381 | 8.2 | 2/40 | 1 | * |
| 1941 | 99 | 3,650 | 3,749 | 52,231 | 7.2 | 3/40 | 0 | 0 |
| 1942 | 35 | 4,501 | 4,536 | 50,388 | 9.0 | 1/41 | 0 | 0 |
| 1943 | 168 | 2,814 | 2,982 | 53,699 | 5.6 | 5/40 | 0 | 0 |
| 1944 | 218 | 2,935 | 3,153 | 53,435 | 5.9 | 4/41 | 0 | 0 |
| 1945 | 601 | 3,920 | 4,521 | 53,395 | 8.5 | 2/43 | 0 | 0 |
| 1946 | 661 | 3,129 | 3,790 | 60,266 | 6.3 | 3/44 | 0 | 0 |
| 1947 | 708 | 1,167 | 1,875 | 55,700 | 3.4 | 11/43 | 0 | 0 |
| 1948 | 453 | 3,596 | 4,049 | 55,564 | 7.3 | 4/44 | 69 | 0.1 |
| 1949 | 592 | 2,197 | 2,789 | 55,025 | 5.1 | 7/44 | 483 | 0.9 |
| 1950 | 700 | 3,677 | 4,377 | 57,234 | 7.6 | 3/44 | 182 | 0.3 |
| 1951 | 871 | 4,334 | 5,205 | 56,045 | 9.3 | 2/43 | 506 | 0.9 |
| 1952 | 1,064 | 4,051 | 5,115 | 62,262 | 8.2 | 2/47 | 49 | 0.1 |
| 1953 | 1,770 | 3,252 | 5,022 | 59,837 | 8.4 | 2/47 | 8 | * |
| 1954 | 1,665 | 3,752 | 5,417 | 70,583 | 7.7 | 4/46 | 0 | 0 |
| 1955 | 1,357 | 3,836 | 5,193 | 57,521 | 9.0 | 2/44 | 9 | * |
| 1956 | 1,200 | 3,142 | 4,342 | 66,588 | 6.5 | 4/43 | 0 | 0 |
| 1957 | 2,140 | 3,719 | 5,859 | 60,854 | 9.6 | 1/44 | 16 | * |
| 1958 | 1,961 | 3,663 | 5,624 | 64,508 | 8.7 | 2/45 | 51 | 0.1 |
| 1959 | 2,486 | 3,951 | 6,437 | 71,204 | 9.0 | 1/49 | 124 | 0.2 |
| 1960 | 2,344 | 2,879 | 5,223 | 71,605 | 7.3 | 2/51 | 162 | 0.2 |
| 1961 | 2,590 | 3,441 | 6,031 | 69,274 | 8.7 | 1/49 | 87 | 0.1 |
| 1962 | 2,006 | 3,562 | 5,568 | 74,862 | 7.4 | 2/52 | 619 | 0.8 |
| 1963 | 2,274 | 3,555 | 5,829 | 71,237 | 8.2 | 2/53 | 1,005 | 1.4 |
| 1964 | 2,474 | 2,471 | 4,945 | 59,784 | 8.3 | 2/53 | 0 | 0 |
| 1965 | 2,647 | 3,145 | 5,792 | 63,176 | 9.2 | 1/53 | 666 | 1.1 |
| 1966 | 3,191 | 3,403 | 6,594 | 62,016 | 10.6 | 1/53 | 1,167 | 1.9 |
| 1967 | 1,172 | 4,130 | 5,302 | 55,222 | 9.6 | 1/52 | 1,238 | 2.2 |
| 1968 | 1,175 | 2,431 | 3,606 | 48,594 | 7.4 | 4/53 | 381 | 0.8 |
| 1969 | 1,089 | 3,524 | 4,613 | 58,275 | 7.9 | 1/54 | 294 | 0.5 |
| 1970 | 1,169 | 3,845 | 5,014 | 54,938 | 9.1 | 1/54 | 4,046 | 7.4 |
| 1971 | 1,331 | 3,139 | 4,470 | 46,654 | 9.6 | 1/53 | 3,611 | 7.7 |
| 1972 | 1,367 | 3,267 | 4,634 | 42,884 | 10.8 | 1/56 | 5,056 | 11.8 |
| 1973 | 708 | 2,435 | 3,143 | 31,740 | 9.9 | 1/51 | 3,972 | 12.5 |
| 1974 | 84 | 1,594 | 1,678 | 21,306 | 7.9 | 1/52 | 1,930 | 9.1 |
| 1975 | 416 | 1,773 | 2,189 | 27,616 | 7.9 | 1/52 | 3,936 | 14.3 |
| 1976 | 393 | 1,344 | 1,737 | 27,535 | 6.3 | 3/51 | 3,418 | 12.4 |
| 1977 | 231 | 1,287 | 1,518 | 21,880* | 6.9 | 2/54 | 3,149 | 14.4 |
| 1978 | 282 | 1,518 | 1,800 | 22,000* | 8.2 | 2/53 | 3,396 | 15.4 |
| 1979 | 174 | 1,947 | 2,121 | 22,540* | 9.4 | 1/53 | 2,638 | 11.7 |
| 1980 | 380 | 1,796 | 2,176 | 21,870* | 9.9 | 1/50 | 1,443 | 6.6 |
| 1981 | 0 | 3,155 | 3,155 | 25,720* | 12.9 | 1/50 | 2,334 | 9.1 |
| 1982 | 0 | 3,308 | 3,308 | 29,010* | 11.4 | 1/51 | 3,234 | 11.1 |
| 1983 | 0 | 2,339 | 2,339 | 38,380* | 6.1 | 2/55 | 3,987 | 10.4 |
| 1984 | 0 | 3,601 | 3,601 | 44,960* | 8.0 | 3/53 | 2,914 | 6.5 |
| 1985 | 0 | 4,496 | 4,496 | 56,110* | 8.0 | 2/54 | 4,081 | 7.3 |
| 1986 | 0 | 7,572 | 7,572 | 69,620* | 10.9 | 1/53 | 5,899 | 8.5 |
| 1987 | 0 | 5,058 | 5,058 | 69,480* | 7.3 | 4/51 | 4,201 | 6.0 |
| 1988 | 0 | 3,994 | 3,994 | 74,350* | 5.4 | 4/50 | 4,530 | 6.1 |
| 1989 | 0 | 3,705 | 3,705 | 66,930* | 5.5 | 4/52 | 4,454 | 6.7 |
| 1990 | 0 | 4,869 | 4,869 | 61,590* | 7.9 | 2/52 | 5,183 | 8.4 |
| 1991 | 0 | 3,315 | 3,315 | 57,000* | 5.8 | 5/52 | 3,283 | 5.7 |
| 1992 | 0 | 3,754 | 3,754 | 59,900* | 6.3 | 5/52 | 3,997 | 6.7 |
| 1993 | 0 | 3,097 | 3,097 | 59,280* | 5.2 | 5/52 | 2,936 | 5.0 |
| 1994 | 0 | 3,884 | 3,884 | 54,750* | 7.1 | 3/52 | 3,896 | 7.1 |
| 1995 | 0 | 2,147 | 2,147 | 43,890* | 4.9 | 6/52 | 2,770 | 6.3 |
Source: Richard J. Myhre, et. al., The Pacific Halibut Fishery: Catch, Effort and CPUE, 1929-1975 (Seattle, International Pacific Halibut Commission), 1977, except as noted. Sources for pre-1929 data for Seward landings: a — Barry, Seward History/II, 88, b - Barry, Seward: A History/III, 33, c — Seward Gateway, August 10, 1928, 4.
As has been noted in Chapter 6, one of the most prominent early halibut fishermen was "Herring Pete" Sather. The Seward Gateway was reporting on his fishing activities by June of 1922. In late July, this entry appeared:
The halibut boat Rolfe [sic] arrived in port Sunday with 15,000 pounds of fish which were sold to the San Juan Co. The Rolfe is one of the luckiest boats in the business, bringing in a full load each trip. The boat is registered at 6 tons, but Capt. Pete generally piles on a ton or two more for good measure. [98]
Notices about Seward halibut processing were published throughout the 1920s. [99] Pete Sather's interest in the halibut fishery, however, appears to have tapered off after his marriage, in May 1924, to Josephine Tuerck. After that date, his primary responsibilities centered on the couple's Nuka Island fox farm. He probably never abandoned halibut fishing, however; in 1946, Josephine noted that he "is forever ... fishing halibut for market." [100]
Sather and the other halibut-boat captains sold their product for 10 to 11 cents per pound during the early to mid-1920s. The evidence gathered during this period provides few details about where the halibut were harvested. Most were probably caught out on Portlock Bank. But most of the smaller boats–including Sather's–fished in waters close to the Kenai Peninsula shoreline. [101]
As noted above, the halibut industry, both in the Gulf of Alaska and Seward, grew dramatically during the mid-1920s. In 1927, however, the fishery–and Seward's role in it–took a turn for the worse. That summer, the spectre of overfishing began to rise; the editor of the Seward Gateway interviewed the captains of several halibut boats and concluded that the halibut harvests were headed for a crash. The editor stated that "With few exceptions, [the captains] advocate the closing of certain banks, such as ... the Portlock bank.... The fish taken there are all immature and the bulk too small for the market." [102] The number of fish caught in waters off the park coast (in Statistical Area 25, which includes the waters east of Nuka Island and west of Cape Fairfield; see Map 9-5) dropped from 3.3 million in 1929 to 2.1 million in 1931. In addition, a new cold storage plant was built at Portlock, which was more than 100 miles closer to the Alaska Peninsula halibut harvesting areas than Seward. A third factor working against Seward's role was that the Seattle-based halibut fleet, during this period, was converting from sail power to gasoline power; the new technology shortened the time needed between Seattle and the fishing grounds. [103]
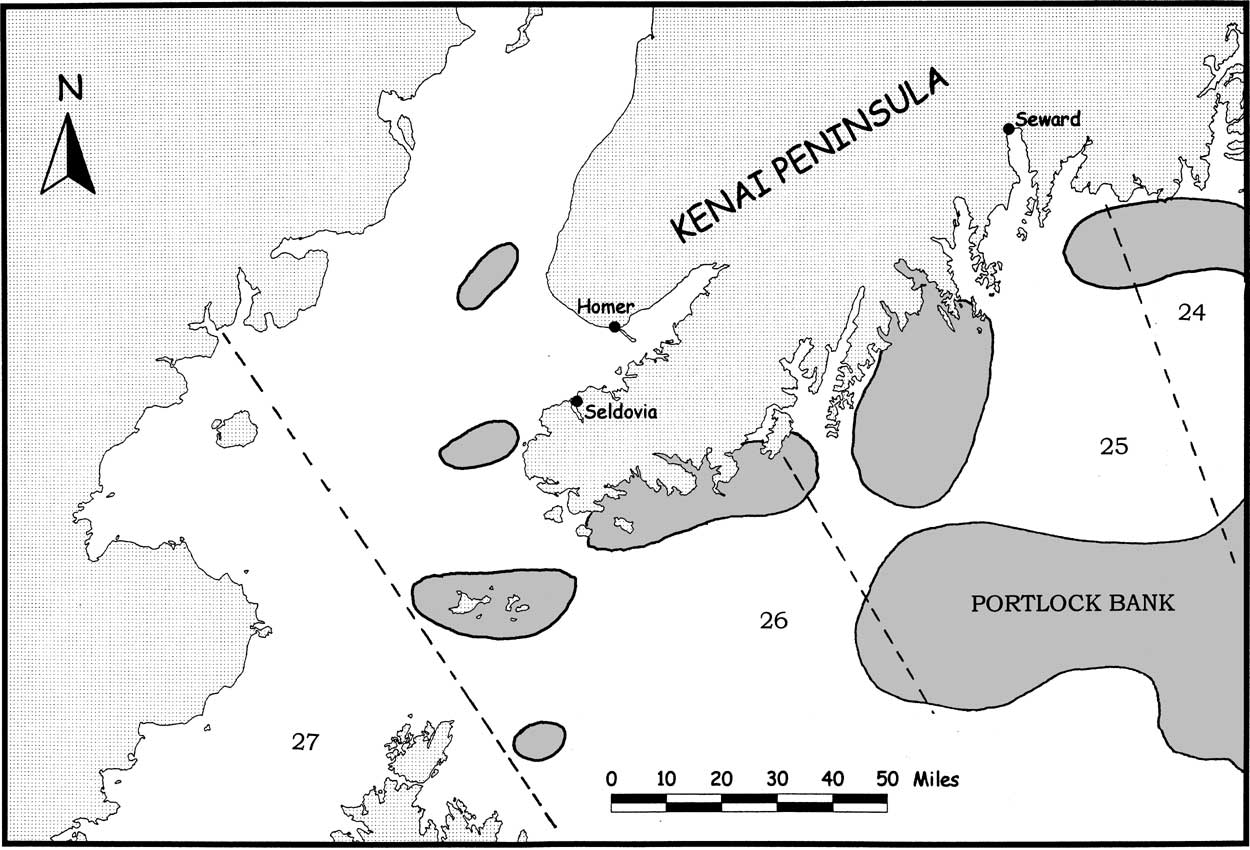
|
| Map 9-5. Pacific Halibut Statistical Areas. (click on image for an enlargement in a new window) |
For all of these reasons, the number of halibut processed at the San Juan plant dropped from 2.5 million in 1927 to 1.0 million a year later. The annual total rebounded to 1.4 million in 1929 and 1.6 million in 1930, but in 1931 it sank back to 1.0 million. In order to profitably operate, the plant had to process at least a million halibut per year. The deepening depression, however, promised further cutbacks in the halibut harvest, so the plant closed after the 1931 season. For the next 18 years, Seward fish plants played an insignificant role in halibut processing and shipping; for at least part of that period, Seattle was the home port for most of the U.S. halibut fleet that fished in the waters of Central and Western Alaska. [104]
The late 1920s and early 1930s were also declining years for the Central Alaska cod industry. The Alaska cod industry, as noted above, reached its peak about 1915. After that point, however, the lack of a West Coast market began to hamper industry growth. A more sinister factor working against the industry was the persistent claim of Atlantic cod dealers that the Pacific species was "an inferior fish that will not keep." Perhaps because of that claim, the industry appears to have declined during the 1920s; more important to the Alaska economy, the territory never gained a strong foothold as a processing venue. The San Juan cold storage plant in Seward, as noted above, stated its intention to process cod when it opened in 1917, and the Portlock facility, which opened in 1927, was built with the express purpose of processing cod from the Aleutian Islands. At both locations, however, cod appears to have been a minor player. In May 1927, the Seward Gateway reported a proposal for a new cold storage plant that would process "cod and halibut for the North Dakota market." That plant, however, was never built, and cod processing appears to have largely disappeared from the scene after that date. [105] By 1933, the Alaska cod industry was operating at a "low level." Annual fisheries reports published in later years indicate that cod, over the years, supported a small, intermittently industry. Harvesting areas included southeastern Alaska, the Bering Sea, the Unalaska area and the Shumagin Islands. These areas were all quite distant from Seward and had no economic impact on local fisheries operations. [106]
Although Seward, during the 1930s and 1940s, did not play a significant role as a halibut-processing site, the waters south of Seward witnessed a boom in halibut harvesting. As noted in Table 9-10, the harvest in Statistical Area 25 (that is, the waters just south of the present-day park) rebounded from 2.1 million in 1931 to 3.7 million in 1933. In 1933 the waters south of the park, for the first time, recorded the highest harvest of any West Coast statistical area; an astonishing 8.1 percent of all West Coast halibut were caught there. [107] The halibut harvest, contrary to the dire predictions of the later 1920s, did not crash. Instead, it remained high for years afterward. From 1933 to 1950, for example, more than three million pounds of halibut were annually harvested from Area 25, with just three exceptions. Area 25 continued to be one of the five highest-ranked West Coast harvest areas in all but two years during that 18-year period, and in five of those years–1933, 1934, 1935, 1937, and 1942–the area was the highest-ranked West Coast harvest area. During this period, between 5 and 9 percent of all West Coast halibut were typically caught in Area 25.
During the 1950s and 1960s, halibut fishing in Statistical Area 25 continued at a high, sustained level. Harvests during that 20-year period ranged from 3.6 million pounds, in 1968, up to 6.6 million pounds, in 1966. Area 25's halibut resource led the West Coast industry; the area was ranked among the top five statistical areas every year between 1950 and 1970, and it was responsible for between 6.5 and 10.6 percent of the entire West Coast harvest during that period.
During the 1970s, harvest levels in Area 25 dramatically fell–most harvests during the 1974-78 level were below two million pounds per year–but they then rebounded. From 1981 to 1994, harvests consistently exceeded three million pounds per year, and in 1986, longliners harvested a record 7.5 million pounds of halibut. Throughout this period, Area 25 continued to rank among the top five statistical areas. The area, each year, was responsible for at least five percent of the West Coast halibut harvest, and in 1981, this area alone accounted for a remarkable 12.9 percent of the entire coast's halibut harvest. Figures from the International Pacific Halibut Commission are unequivocal in their conclusion that Area 25, over the past 67 years (the period for which records have been kept) has been by far the most productive West Coast halibut harvesting area.
Since the 1940s, the Seward halibut processing industry has undergone dramatic change. As noted above, an insignificant number of halibut were processed in Seward from 1932 to 1947. (During the 1932-1936 period, most of the Alaska halibut fleet processed its catch in Seattle; in later years, Prince Rupert and southeastern Alaska ports processed an increasing number of fish due to their ability to command higher prices and their closeness to the fishing grounds. [108]) The opening, in 1948, of William Pege's Seward Fish and Cold Storage Company brought a brief revival of halibut processing. The company processed 69,000 pounds of locally caught halibut that year. It then shipped out frozen halibut steaks on the Alaska Railroad to Anchorage; the halibut was then air freighted to U.S. destinations [109]. The following year, the cold storage plant took in almost 500,000 pounds of halibut; shipping arrangements changed, and for the first time since 1930, ocean-going vessels tied up in Seward to load fish. The volume of halibut processed remained high in 1950 and 1951, but in 1952 the volume fell to just 49,000 pounds of halibut, and during the 1953-1957 period an insignificant number of halibut were processed in Seward. [110] It should be noted that even in 1949 and 1951, during the height of this short-lived boom, the Seward plant processed less than one percent of all West Coast halibut, even though Area 25 in those years yielded between 5 and 10 percent of the West Coast halibut harvest.
In 1958, Seward Fish and Cold Storage leased its plant to the Seattle-based Halibut Producers Co-operative (HPC), and for the next five years it processed a modest volume of halibut. (Most halibut boats bypassed Seward because, as noted in a 1962 letter from the Bureau of Commercial Fisheries, "new modern fishing boats now transfer their catches to larger cities in the south." [111]) The volume in 1963 shot up to more than a million pounds; this was highest total that Seward had witnessed since 1931. The HPC facility, along with other Seward fish plants, was wiped out in the 1964 earthquake. In 1965, however, the plant was rebuilt, and the following year the volume exceeded the 1963 total. [112]
In 1969, HPC sold out to a Petersburg-based consortium that renamed the plant Seward Fisheries, Inc. In the year that followed, the plant processed more than four million pounds of halibut–by far the largest annual volume for a Seward plant. Ever since that time, Seward Fisheries has been a major West Coast halibut processor. It has processed more than two million pounds of halibut in every year except one, and in both 1972 and 1973 it was the top halibut plant on the West Coast. [113] Since 1970, furthermore, the plant has consistently processed between five and fifteen percent of the West Coast halibut harvest. Of those that brought their catch into the Seward plant, Canadian vessels accounted for more than 30 percent of the volume during the 1970-1972 period. That proportion dropped soon afterward, however, and by the 1976-1978 period, Canadian vessels were contributing less than 20 percent of the Seward plant's fishing volume. Due to international treaty provisions, Canadian vessels no longer fished Central Alaskan waters after the 1980 season; Canadian ship captains, therefore, stopped off-loading halibut in Seward.
State fisheries experts have given varying opinions regarding the amount of commercial halibut fishing that has taken place near the Kenai Fjords National Park shoreline. Ted McHenry, an ADF&G sport fishing specialist who lived in Seward from 1969 to 1988, noted that the commercial halibut people "stayed way out there ... the only time they were forced close to the beach was in storms." But Tom Schroeder, an ADF&G commercial fisheries biologist based in Homer from 1974 to 1989, stated that smaller halibut boats fished in several places along the park shoreline. Specifically, he stated that halibut boats fished near the south end of Nuka Bay, near Pederson Lagoon (in Aialik Bay) and James Lagoon (on the east arm of Nuka Bay). He agreed with McHenry, however, that the vast majority of the halibut boats fished outside (i.e., on the Portlock Bank), "especially in more recent years." Sportsmen, Schroeder added, are now responsible for most of the halibut harvest from waters near the park shoreline. [114]
Other Commercial Fisheries
Herring
During the late nineteenth and early twentieth centuries, both Natives and non-Natives harvested Cook Inlet herring on a small-scale, subsistence basis. Then, in 1914, the commercial herring fishery began at Halibut Cove in Kachemak Bay. [115] The industry grew slowly until 1917, when the U.S. government successfully introduced a new method of processing herring, called scotch curing. Largely because of the new curing method, the industry boomed in 1918; there were 36 Alaska herring plants, 25 of which were located in Central Alaska (either in Cook Inlet, Prince William Sound, or Kodiak-Afognak islands). Fifteen of the 36 plants were in Kachemak Bay (see Table 9-11a). [116] The industry retrenched the following year. The number of plants fell sharply, although the value of the herring harvest fell only modestly.
Table 9-11a. Herring Harvesting in Lower Cook Inlet, 1918-1930
| Number of Plants | Harvest Yield (millions of dollars) | |||
| C AK | AK (all) | SC/AK | AK | |
| 1918 | 25 | 36 | $0.748 | $1.819 |
| 1919 | 6 | 11 | 0.451 | 1.676 |
| 1920 | 7 | 14 | 0.490 | 1.303 |
| 1921 | 8 | 13 | 0.838 | 0.934 |
| Number of Plants | Harvest Yield (millions of dollars) | |||||
| LCI | C AK | AK (all) | SC/C AK | C AK | AK (all) | |
| 1922 | n.a. | 15 | 22 | $1.650 | $1.741 | $2.329 |
| 1923 | n.a. | 12 | 19 | 0.800 | 0.936 | 1.602 |
| 1924 | 15* | 22 | 32 | 1.342 | 1.496 | 2.458 |
| 1925 | 19* | 40 | 54 | 1.960 | 2.174 | 3.852 |
| 1926 | 32* | 45 | 61 | 1.421 | 1.512 | 3.554 |
| 1927 | 29* | 48 | 68 | 1.149 | 1.213 | 2.850 |
| 1928 | 28* | 37 | 65 | 0.396 | 0.558 | 3.098 |
| 1929 | 1* | 7 | 30 | 0.013 | 0.154 | 2.794 |
| 1930 | 0 | 6 | 39 | 0.166 | 0.415 | 2.133 |
Guide to Abbreviations:
* - The location of plants in Lower Cook Inlet is shown in the table below.
AK - Alaska (entire territory)
C AK - Central Alaska (Cook Inlet, Prince William Sound, and Kodiak-Afognak)
LCI - Lower Cook Inlet (Kachemak Bay and vicinity)
SC — scotch cure (method of curing herring, introduced to Alaska in 1917)
Source: U.S. Bureau of Fisheries, Alaska Fishery and Fur-Seal Industries, annual issues.
From 1919 to 1926, herring was an Alaska growth industry. The number of plants rose from 11 to 61, and in Lower Cook Inlet, the number of plants rose from a mere handful to 32. Revenues rose accordingly; on a territory-wide basis, the herring harvest rose from $1.6 million to more than $3.5 million. Plants during this period were scattered all over the lower Inlet; as noted in Table 9-11b, most plants were located in Halibut Cove, but they were also sited in Portlock, Port Graham, Seldovia, and elsewhere.
Table 9-11b. Location of Lower Cook Inlet Herring Plants, 1924-1930
| Halibut Cove |
Homer Spit | Port Graham |
Portlock City | Seldovia | Tutka Bay | Floating | Total | |
| 1924 | 10 | 1 | 3 | 1 | 15 | |||
| 1925 | 6 | 1 | 1 | 1 | 6 | 1 | 3 | 19 |
| 1926 | 17 | 1 | 1 | 1 | 4 | 1 | 7 | 32 |
| 1927 | 12 | 1 | 6 | 1 | 9 | 29 | ||
| 1928 | 19 | 1 | 2 | 6 | 28 | |||
| 1929 | 1 | 1 | ||||||
| 1930 | 0 | |||||||
Source: U.S. Bureau of Fisheries, Alaska Fishery and Fur-Seal Industries, annual issues.
After 1926, the herring industry crashed even more quickly than it had grown. Overfishing was the cause. By 1929, the number of plants in Alaska was half of what it had been three years earlier, and revenues were slashed by one-third. In Lower Cook Inlet, fishers responded to the depleted stocks by heading west, and by 1928, Inlet-based fishers were harvesting Aleutian stocks. That however, was merely a temporary expedient, and it merely delayed the inevitable crash. That crash, as it turned out, was nothing less than catastrophic; of 32 herring plants that operated in 1926, only one remained in 1929. That last plant was gone by 1930. The herring fishery in Lower Cook Inlet never recovered. For years afterward, locals reminisced about the "good old herring days at Seldovia." [117] Beginning in the late 1930s, occasional harvests were made in the Seldovia area and in Kachemak Bay, chiefly for local use and for halibut bait. It remained a minor industry until the late 1960s. [118]
In Resurrection Bay, interest in the herring fishery appears to have begun in 1914. A newspaper item that November stated that "two tons of the delicious little fish known as herring sardines were caught Saturday.... The extraordinary run of the fish proves fully that there would be big money in the fishing business here." [119] Little more was heard of the herring resource until 1920. Perhaps caught up in the flurry of activity taking place in Lower Cook Inlet, Seward interests publicized the local resource. That January, the Gateway editorialized that:
The herring industry ... bids fair to almost outrival that of salmon in the near future. The waters of and contiguous to Resurrection Bay, close to the thriving town of Seward, are pronounced by experts and those who have closely investigated that field to offer unequalled inducements to those who may contemplate engaging in herring fishing. The fact remains that fish are Alaska's greatest and most valuable asset.
The Pathfinder, an arm of the Pioneers of Alaska, weighed in with similar hyperbole. It noted that "the Gulf of Alaska is literally alive with herring, a fish that bids fair to bring fame to this coast and much added prosperity to the port of Seward." [120] Despite that boosterism, Seward had no herring plants, and Resurrection Bay had little or no herring harvesting, for the remainder of the decade.
Events in Prince William Sound brought renewed attention to Resurrection Bay's herring resource. The Sound was a major herring harvest area during the 1930s; in the peak year of 1936, the herring reduction facility at Port Ashton (near Latouche) processed over 56,000 tons of herring. [121] Harvesting continued in the Sound for the remainder of the decade. Herring, during this period, was valuable, but not as a food fish. Instead, the harvested product underwent a reduction process from which oil and meal were made.
During the 1940s, attention in the herring fishery shifted over to Resurrection Bay, largely because fishery interests had fully explored Prince William Sound and sought new sites. The northern part of the bay–in the immediate Seward area–recorded a commercial harvest in 1941. Activity then ceased until 1944, when harvests were recorded both in the Seward area and at the bay's southern end. The area at the extreme southwestern end of the bay–between Aialik Cape and Bulldog Cove–was harvested in 1945. Herring harvesting in that area did not take place again for years afterward. But other parts of southern Resurrection Bay (i.e., areas south of Caines Head) were harvested off and on until 1959; in 1955, moreover, the present-day park coastline between Aialik Cape and Gore Point recorded a small (128,000-pound) harvest. The amount harvested in and around Resurrection Bay, to be sure, was not as large as that recorded in Prince William Sound; the bay's yield in the most productive years (1946 and 1955) did not exceed 7,500 tons, and the harvest total for the entire 16-year period was less than 25,000 tons. [122] The harvests, however, reaffirmed that commercial quantities of herring were available in waters both in and adjacent to the future Kenai Fjords National Park. [123]
Herring harvesting activity at the southern end of Kenai Peninsula remained at a standstill from 1960 until 1969, when the fishery was reopened due to increased Japanese demands for herring and herring roe. Harvests for the first year or two took place primarily in Halibut Cove and the Seward Boat Harbor. By 1972, however, the search for herring resulted in expeditions to Nuka Passage and to Aialik, Two Arm, Thunder, Black, Nuka, Yalik, and other bays in the present-day park. [124] Almost 700,000 pounds (350 tons) of herring was harvested in park waters that year (see Table 9-12); the following year, the herring harvest totaled more than 770,000 pounds (385 tons). Much of this harvest was processed at the Seward Fisheries plant. In 1974, most of the area's herring fishing took place on the west side of Cook Inlet; the results were disappointing, and the Cook Inlet fishery–which, as in previous decades, provided consistently smaller returns than the Prince William Sound fishery–was closed because the resource had been exhausted. [125]
Table 9-12. Statistics on Park-Area Fishing, 1970-1995 (Non-Salmon Species)
| Year | Herring (230, 234) Area 232 (pounds) |
Octopus (870) Area 23 (#/pounds) |
Dungeness Crab (910) Area 23 (#/pounds) |
King Crab (920) Area 23 (#/pounds) |
Tanner Crab (930) Area 23 (#/pounds) |
GeneralShrimp (960) Area 23 (#/pounds) |
Other Species/ Area 23 (pounds) |
| 1970 | 430/ 4,429 | 500/ 1,742 | 2,365 | ||||
| 1971 | 1,625/17,534 | 448/ 1,258 | 13,024 | ||||
| 1972 | 134/ 1,605 | 65,486/ 205,659 | 79,506 | ||||
| 1973 | 697,988(HB) | 260/954 | 370/ 3,623 | 333,891/ 852,322 | 138,999 | ||
| 1974 | 773,379(HB) | 240/ 1,875 | 680,935/1,623,306 | 265,286 | |||
| 1975 | 106,614/ 247,919 | 1,293 | |||||
| 1976 | 1,191/10,269 | 49,200/ 129,178 | 595 | ||||
| 1977 | (CD) | 776/ 7,465 | 67,776/ 162,669 | 26,437 | |||
| 1978 | (CD) | 84,249/ 197,411 | 10,154 | ||||
| 1979 | (CD) | (CD) | (CD) | ||||
| 1980 | (CD) | (CD) | 81,321/ 186,305* | (CD) | |||
| 1981 | (CD) | 67,047/ 159,451 | (CD) | ||||
| 1982 | (CD) | 335/685 | 2,005/14,967 | 127,333/ 300,843* | (CD) | ||
| 1983 | 19/ 641 | (CD) | (CD) | 99,195/ 220,211* | 36,927* | ||
| 1984 | (CD) | 48,087/ 104,046* | 552,136 | ||||
| 1985 | (CD/SR) | (CD) | (CD) | (CD) | |||
| 1986 | (CD/SR) | (CD) | (CD) | ||||
| 1987 | 403,110(SR) | (CD) | 48,863/ 108,864* | 7,292* | Weathervane scallops(850)/1,128 | ||
| 1988 | (CD/SR) | n.d./1,115 | 19,227/ 42,080* | (CD) | |||
| 1989 | 17,482* | ||||||
| 1990 | (CD) | ||||||
| 1991 | (CD) | (CD) | |||||
| 1992 | (CD) | 7,124/ 15,244* | (CD) | [Waste fish/trawl shrimp(101)/(CD) | |||
| 1993 | (CD) | ||||||
| 1994 | (CD) | Sea Cucumber (895)/(CD) | |||||
| 1995 | n.d. | ||||||
Explanatory Notes for Table 9-12:
Area and Species Identification: crab, shrimp, octopus, and miscellaneous-species statistics are maintained for Area 23 (which includes the coastline all the way from Gore Point east to Cape Fairfield during the 1970-75 period and from Point Adam to Cape Fairfield in the 1976-1995 period). Herring statistics, however, are maintained for Area 232 (that is, the coastline between Gore Point and Aialik Cape during the 1968-1973, between Gore Point and Aligo Point during the 1974-75 period, and between Aligo Point and Point Adam during the 1976-1995 period). The three-digit numbers following each species name have been assigned by the ADF&G to identify the various species.
* - numbers and weights are actually for a particular subspecies within the general classification. Most tanner crabs in this category are for biardi tanner crabs (931), and most shrimp in this category are for spot shrimp (965).
(CD) — confidential data. When fewer than four permittees fished for a given species in a given year, ADF&G censors harvest data in order to protect the privacy of an individual permittee’s harvest. The term "CD", therefore, shows that there were 1, 2, or 3 active permittees.
(HB) — herring by-products
(SR) — sac roe
n.d. — no data.
Source: Herman Savikko (ADF&G, Juneau) letter, June 12 and July 11, 1997.
For more than a decade, no commercial herring fishing took place in or near park waters. Then, in 1985, commercial harvesting began again, although on a smaller, more restrictive scale than before. Again, much of the herring harvest was processed in Seward. Commercial production continued each year until 1988. Since then, the park's herring fishery has been inactive. Seward fish plants, however, have benefited in recent years by processing harvests from neighboring districts. [126]
Shrimp
Kenai Peninsula's shrimp fishing industry has been active for more than fifty years. Back in 1935, the Seward newspaper noted that Resurrection Bay shrimp prospecting had been "carried on some years ago, and a small quantity of commercial size was found, but not in sufficient number to justify engaging in the business." Commercial operations stayed away from Resurrection Bay until the late 1950s. [127] West of the park, the first commercial shrimp harvest in Cook Inlet took place in Kachemak Bay in 1939. Thereafter, the industry remained small. From 1949 through 1952, for instance, the only Central Alaska shrimp operator harvested the waters of Kachemak Bay; and in 1955, the Fish and Wildlife Service noted that the Cook Inlet shrimp industry was limited to "a very few fishermen in Kachemak Bay." [128]
A major expansion in the Peninsula's shrimp industry took place in 1958. The Fish and Wildlife Service boat John N. Cobb, hoping to assist potential fishermen and processors, dragged selected waters of the southern Kenai that summer; waters in or near the present-day park included Nuka Bay, Nuka Passage, and the area surrounding Rugged Island. The agency noted that neither Nuka Bay nor Nuka Passage was on a par with Kachemak Bay. Both, however, were important shrimping areas; Nuka Passage contained pink, sidestripe and coonstripe shrimp, while Nuka Bay yielded pinks and sidestripes. [129] Fishermen that summer brought in 16,300 pounds of shrimp, which were processed at the Seward Fish and Cold Storage (SF&CS) plant. [130]
In response to the new activity, the Halibut Producers Co-op bought a shrimp-peeling machine (to take the shell off) and installed it at the SF&CS plant. Rapid industrial development followed, and by the end of 1959 four additional shrimp peelers had been installed at SF&CS, four at Seward Seafoods, and one at Seldovia. Shrimp that year was taken principally from a small area of Nuka Bay, from the Bear Glacier area of Resurrection Bay, the Kodiak area and Prince William Sound. [131]
For the next several years, the shrimp industry thrived. A December 1961 report on Seward's economic development prospects noted that shrimp was a much needed growth industry in a town where the salmon, halibut and herring industries were all undergoing a serious decline. "In the last 2-3 years," the report stated, "the processing of sea-caught shrimp has come into prominence. There have been 3 shrimp canneries started in the area at this time." One of the canneries was still operating full time, a second operated seasonally, and the third had shut down. [132] In order to sustain operations, the shrimp harvesters had to seek out locations that were increasingly distant from Kachemak and Resurrection bays. It is likely that the park's waters were harvested off and on during the early 1960s. Kodiak Island and other Cook Inlet waters (perhaps Kamishak Bay) were also relied on to an increasing extent during this period. The plants in both Seward and Seldovia remained active through the 1963 season. The March 1964 earthquake, however, destroyed all of the shrimp-processing facilities and killed the industry. [133]
The Cook Inlet shrimp industry did not reawaken until 1968. A total of 26,660 pounds of shrimp was harvested that year; a mere 418 pounds of that came from the waters of the Outer District (i.e., between Point Adam and Aialik Cape). The industry remained small for the next three years (see Table 9-12). From 1972 through 1974, however, the waters between Gore Point and Cape Fairfield yielded more than 75,000 pounds of shrimp each year. (The most productive harvest was in 1974, when shrimp fishers caught more than 265,000 pounds of shrimp.) Yields of this volume apparently injured the resource to such an extent that few shrimp were caught in park waters for the remainder of the decade. During this period, the only Cook Inlet shrimp boats belonged to a Homer-based seafood company. No Seward fishermen participated. The Seward Fisheries plant, however, apparently benefited from the short-lived boom because many of the shrimp were harvested in peelers that had been installed in the facility in 1971. [134]
Since 1980, the shrimp industry has continued its boom-and-bust cycle. Although confidentiality concerns prevent the drawing of an accurate industry description, it appears that the shrimp industry, both in park waters and adjacent areas, boomed between 1982 and 1986, inclusively (see Table 9-13). More than 200,000 pounds of shrimp–primarily pink shrimp–were harvested annually during this period in the Outer and Eastern districts (i.e., between Point Adam and Cape Fairfield). The peak year was in 1984, when the Outer and Eastern districts yielded more than 1.9 million pounds and the area between Gore Point and Cape Fairfield yielded more than 550,000 pounds. Since 1988, the Outer and Eastern districts have yielded fewer than 25,000 pounds of shrimp each year. Most of what has been caught in recent years has been sidestripe shrimp. [135]
Table 9-13. Shrimp Harvests in
Cook Inlet
(Outer and Eastern Districts), 1977-1995
Outer Cook Inlet, or Area "G," is comprised of the Outer and Eastern Districts. Harvests are in pounds. Pot shrimp figures are harvests for the given calendar year, while trawl shrimp harvests are for the season beginning in the given calendar year.
The letters "(CD)" indicate that data cannot be supplied because of confidentiality concerns.
| Year | Pot Shrimp | Trawl Shrimp |
| 1977 | 1,776 | 26,556 |
| 1978 | 10,157 | 1,245 |
| 1979 | 4,211 | 0 |
| 1980 | 2,911 | 4,000 |
| 1981 | 2,031 | 19,454 |
| 1982 | 2,805 | 239,584 |
| 1983 | 18,679 | 760,430 |
| 1984 | 5,504 | 1,957,959 |
| 1985 | 3,305 | 421,063 |
| 1986 | 2,967 | 297,762 |
| 1987 | 12,458 | 22,231 |
| 1988 | 13,445 | 4,878 |
| 1989 | 20,500 | 0 |
| 1990 | 8,853 | 0 |
| 1991 | 7,315 | (CD) |
| 1992 | 2,804 | (CD) |
| 1993 | 8,356 | (CD) |
| 1994 | (CD) | 32,591 |
| 1995 | 0 | (CD) |
Source: ADF&G, Division of Commercial Fisheries, Cook Inlet Area, Annual Shellfish Management Report, issues of 1992-93 (November 1993, appendices H and J) and 1995-96 (August 1996, pp. 61 and 63).
Statistics issued by state regulatory authorities provide few clues on shrimp fishing in park waters. Local residents, however, suggest that most activity–for shrimp caught in both trawls and pots–took place in Aialik Bay, with additional activity in Northwestern Fjord and McCarty Fjord. Tom Schroeder, the Homer-based ADF&G biologist, recalled that shrimp trawlers were active in Aialik Bay during the late 1970s and early 1980s. Longtime Seward fisherman Seward Shea recalled that there were "lots of shrimp pots out there." "A few made a living at it," he stated, "but they had to work at it." An NPS report confirms the presence of shrimp pots in Aialik Bay in 1980; a former park employee recalls that recreational fishermen were the primary shrimp pot users, although commercial shrimpers may have been active there as well. [136]
Crab
The first Cook Inlet crab harvest–and one of the earliest Alaska crab harvests–took place in 1920, when the Arctic Packing Company in English Bay put up 75 cases of so-called "spider crabs." That pack was an isolated event; a similar spike in interest took place in 1937, when a Halibut Cove cannery processed king crab. In the late 1940s, Resurrection Bay was the site of occasional dungeness harvests. During the same period, king crab was finally becoming a recognized market commodity, and beginning in 1953 Pacific Coast harvest levels for the species began a long-term growth curve. That growth, however, was not immediately reflected in activities along the Kenai Peninsula. Both Resurrection Bay and Kachemak Bay, though not the coast between them, may have been harvested from time to time; harvest volume, however, remained small. King crab accounted for most if not all crab production during the 1940s and 1950s. [137]
In 1960, the king crab industry jumped into prominence when 60 boats signaled their interest in the species. During the 1960-1961 season, some four million pounds of crab–far more than ever before–were harvested from the Cook Inlet management district. During that season, Cook Inlet boats made several exploratory fishing trips into Outer District waters, mainly to Port Dick and Nuka Bay. Those trips resulted in an Outer District harvest of 118,067 pounds, about 3.1 percent of the Cook Inlet total (see Table 9-14). [138]
Table 9-14. Outer District and Eastern District Crab Harvest, 1960-1995
Figures given are in pounds, while percentages are those of the entire Cook Inlet catch. An asterisk (*) signifies a percentage less than 0.1%. Source: ADF&G, Annual Management Report on Shellfish, 1981-1982, Appendix, Tables 8 and 15; ADF&G, Cook Inlet Area, Annual Shellfish Management Report, 1995-96, 54, 57.
| Season | King Crab Harvest, Outer District |
Tanner Crab Harvest, Outer and Eastern Districts |
| 1960-61 | 118,067 (3.1%) | |
| 1961-62 | 368,909 (6.6%) | |
| 1962-63 | 343,505 (4.0%) | |
| 1963-64 | 59,352 (0.9%) | |
| 1964-65 | 963 (*) | |
| 1965-66 | 14,491 (0.4%) | |
| 1966-67 | 89,510 (3.2%) | |
| 1967-68 | 239,518 (7.4%) | |
| 1968-69 | 87,302 (3.4%) | 816 (0.1%) |
| 1969-70 | 73,644 (2.2%) | 104,191 (7.9%) |
| 1970-71 | 9,468 (0.3%) | 3,000 (0.2%) |
| 1971-72 | 12,657 (0.2%) | 804,765 (19.0%) |
| 1972-73 | 1,966 (*) | 1,266,937 (16.8%) |
| 1973-74 | 5,613 (0.1%) | 1,891,021 (24.6%) |
| 1974-75 | 2,035 (*) | 656,660 (13.8%) |
| 1975-76 | 45,293 (1.2%) | 850,964 (15.6%) |
| 1976-77 | 16,384 (0.4%) | 824,520 (17.9%) |
| 1977-78 | 1,350 (0.1%) | 502,049 (9.3%) |
| 1978-79 | 1,753 (0.2%) | 694,728 ( 12.1%) |
| 1979-80 | 4,871 (0.4%) | 595,645 (11.8%) |
| 1980-81 | 8,022 (0.4%) | 463,201 (14.2%) |
| 1981-82 | 4,143 (0.3%) | 524,897 (22.2%) |
| 1982-83 | 15,280 (1.9%) | 682,919 (23.1%) |
| 1983-84 | 4,504 | 443,384 (15.8%) |
| 1984-85 | No Cook Inlet Harvest | 259,083 (8.6%) |
| 1985-86 | " | 177,041 (6.7%) |
| 1987 | " | 251,174 (10.3%) |
| 1988 | " | 168,969 (11.0%) |
| 1989 | " | No Cook Inlet Harvest |
| 1990 | " | Closed (0%) |
| 1991 | " | Closed (0%) |
| 1992 | " | 53,049 (13.0%) |
| 1993 and 1994 | " | Closed (0%) |
| 1995 | " | No Cook Inlet Harvest |
For the next several years, the fortunes of the crab fishery largely paralleled those of the shrimp industry; both remained healthy, although both required increasing effort, as the years wore on, to maintain harvest levels. Outer District king crab harvest levels during both the 1961-62 and 1962-63 seasons exceeded 300,000 pounds; those totals, though record-setting, continued to comprise a small proportion (four to seven percent) of the Cook Inlet harvest total. Crabbers during this period probably exploited the crab population along much of the park coastline. Some of the harvesters lived in Seward: Seward Shea once harvested Dungeness crab in James Lagoon, and Ben Suddath kept crab pots out in Aialik Bay, James Lagoon, and Nuka Bay. [139]
The March 1964 earthquake brought the Kenai Peninsula's crab-harvesting industry to a temporary standstill. Because most of the Kodiak crab fleet had been destroyed, Cook Inlet crabbers headed south and harvested the Kodiak Island resource. [140] Less than a thousand pounds of Outer District king crab, therefore, were harvested during the 1964-65 season. Before long, however, the Kodiak fleet was rebuilt and the Kenai crab industry roared back into prominence. More than 80,000 pounds of king crab were harvested each year during the 1966-67 through 1968-69 seasons, and during the 1967-68 season the harvest exceeded 230,000 pounds–7.4 percent of the Cook Inlet total. Outer District king crab harvests continued at a respectable level until the 1969-1970 season; after that date, however, harvest volumes dropped dramatically. Since 1970, Outer District king crab harvests have exceeded 20,000 pounds only once (during the 1975-76 season); during the same period, the Outer District's contribution to the Cook Inlet harvest, moreover, has never exceeded two percent. Since 1984, the Cook Inlet management district has been off-limits to king crab harvesting.
In 1968, Cook Inlet fishers began to harvest a new crab species: the tanner or snow crab. Commercial interests had ignored the species previously, but as a contemporary management report noted, "due to the shortened king crab season, a tanner crab fishery developed to keep the fishermen and canneries in operation." At first, tanners were an incidental part of the king crab harvest, and tanner harvesters generally avoided the Outer and Eastern districts. [141] Beginning in 1971, however, tanner crabs were no longer considered an incidental species; as a result, harvest levels erupted to new heights. From the 1971-72 season to the 1973-74 season, inclusively, Outer and Eastern district tanner crab harvests exceeded 800,000 pounds annually; the 1972-73 season was particularly productive, with a harvest level that neared 1.9 million pounds. Thereafter, harvest levels dropped, but not dramatically. During the ten-year period between the 1974-75 season and the 1983-84 season, annual harvest levels consistently exceeded 400,000 pounds and occasionally exceeded 800,000 pounds. The industry sputtered along, at a much-reduced level, for a few additional years. Beginning in 1989, however, regulatory authorities closed the Outer and Eastern districts. With a single exception, the tanner crab fishery has remained closed ever since.
Statistical data on the volume of tanner crab harvest levels during the 1972-1988 period (Table 9-15) show that the park's waters have contributed a widely varying amount of the total catch along the southern Kenai Peninsula coast. In 1975, for example, the park was responsible for more than half (56.8%) of the south coast harvest; five years later, however, the park yielded just 5.3% of the south coast harvest. Within the park, the statistics suggest that the eastern part of the park–between the Pye Islands and Aligo Point–is the district that has yielded a majority of the tanner crab harvest during more than half of the years between 1972 and 1988. Areas west of Nuka Island, and the southern portion of Nuka Bay, have been less important tanner crab harvesting areas. Virtually all of the park's waters have yielded tanner crab on at least an occasional basis.
Table 9-15. Statistics of the Kenai Fjords Tanner Crab Fishery, 1972-1988
Figures are number of tanner crab harvested. Percentages (in parentheses) in the various subareas are of the Statisti-cal Area 232 total, while the percentage in the "Totals for Statistical Area 232" column is of the Statistical Area 23 total.
NOTE: The area enclosed within Statistical Areas 232 and 23 has changed over time. In 1972 and 1973, Statistical Area 232 stretched from Gore Point to Aialik Cape, and Statistical Area 23 stretched from Gore Point to Cape Fairfield. In 1974 and 1975, Statistical Area 232 stretched from Gore Point to Aligo Point, while Statistical Area 23 continued to be the area from Gore Point to Cape Fairfield. After 1975, Statistical Area 232 stretched from Point Adam to Aligo Point, while Statistical Area 23 stretched from Point Adam to Cape Fairfield.
Subareas Within Statistical Area 232
| Year | -10 (W and SW of Nuka Island) | -15 (W Shoreline of Nuka Island) | -21 (Nuka Bay S of Harrington Point) | -23 (East Arm of Nuka Bay) | -30 (between Pye Ids. and Aligo Point) | TOTALS for Statistical Area 232 |
| 1972 | 0 (0.0%) | 0 (0.0%) | 1,660 (29.1%) | 0 (0.0%) | 4,040 (70.9%) | 5,700 (8.7%) |
| 1973 | 0 (0.0%) | 0 (0.0%) | 650 (2.5%) | 0 (0.0%) | 25,228 (97.5%) | 25,878 (7.8%) |
| 1974 | 9,440 (3.5%) | 0 (0.0%) | 31,034 (11.5%) | 0 (0.0%) | 230,268 (85.1%) | 270,742 (39.8%) |
| 1975 | 0 (0.0%) | 0 (0.0%) | 16,536 (27.3%) | 0 (0.0%) | 44,001 (72.7%) | 60,537 (56.8%) |
| 1976 | NO HARVEST IN STATISTICAL AREA 232 | |||||
| 1977 | 0 (0.0%) | 0 (0.0%) | 4,131 (7.8%) | 2,705 (5.1%) | 46,220 (87.1%) | 53,056 (32.6%) |
| 1978 | 0 (0.0%) | 0 (0.0%) | 3,560 (7.0%) | 0 (0.0%) | 47,105 (93.0%) | 50,665 (25.7%) |
| 1979 | NO HARVEST IN STATISTICAL AREA 232 | |||||
| 1980 | 8,386 (84.9%) | 0 (0.0%) | 0 (0.0%) | 0 (0.0%) | 1,495 (15.1%) | 9,881 (5.3%) |
| 1981 | 13,082 (62.7%) | 0 (0.0%) | 160 (0.8%) | 0 (0.0%) | 7,619 (36.5%) | 20,861 (13.1%) |
| 1982 | 6,943 (11.1%) | 1,075 (1.7%) | 9,068 (14.5%) | 3,539 (5.7%) | 42,012 (67.1%) | 62,637 (49.2%) |
| 1983 | 7,220 (15.3%) | 3,671 (7.8%) | 15,981 (33.8%) | 0 (0.0%) | 20,422 (43.2%) | 47,294 (47.7%) |
| 1984 | 803 (4.3%) | 0 (0.0%) | 508 (2.7%) | 0 (0.0%) | 17,176 (92.9%) | 18,487 (38.4%) |
| 1985 | 0 (0.0%) | 7,846 (23.3%) | 17,537 (52.0%) | 0 (0.0%) | 8,338 (24.7%) | 33,721 (n. a.) |
| 1986 | 2,720 (19.2%) | 0 (0.0%) | 0 (0.0%) | 0 (0.0%) | 11,446 (80.8%) | 14,166 (n. a.) |
| 1987 | 9,299 (20.9%) | 13,184 (29.6%) | 2,762 (6.2%) | 328 (0.7%) | 18,583 (41.8%) | *44,484 (40.9%) |
| 1988 | 3,661 (38.5%) | 0 (0.0%) | 2,170 (22.8%) | 0 (0.0%) | 3,683 (38.7%) | 9,514 (22.6%) |
* 1987 total also includes 328 crabs harvested in Subarea 232-22, which includes the North Arm and West Arm of Nuka Bay. Source: Charles Trowbridge, Shellfish Specialist, ADF&G, Homer.
Dungeness crab has also been harvested in park waters, although to a smaller degree than either tanner or king crab. As noted above, the species may have been taken in Resurrection Bay during the late 1940s, nd early harvests were also recorded in Kachemak Bay. The first known harvests in the park took place in James Lagoon during the early 1960s. In the late 1960s, crabbers increased their interest in the species due to the success of the fishery in California, Oregon, and Washington. As a result, harvests over the next few years continued in Kachemak Bay, while newly harvested areas included Homer Spit, Seldovia, and Port Graham. By 1975, Bluff Point (between Anchor Point and Homer) had become the largest Cook Inlet harvest area. Harvests in and around the park, however, have been sporadic. In both 1968 and 1969, a small Outer District harvest was recorded. Since then, commercial dungeness harvests along the stretch of coastline between Gore Point and Cape Fairfield have been recorded only five times. Each of those harvests took place between 1973 and 1983, inclusive; so far as is known, all of the harvests were minor, none exceeding one thousand pounds per year. [142]
Miscellaneous Species
Several fish and shellfish species have been harvested for only short-term periods in and around the present park. Scallops, for example, came under scrutiny in the late 1960s, when scallop beds were discovered in the Gulf of Alaska. In 1968, the Alaska Department of Fish and Game brought in a New England scallop vessel. The vessel collected some 50,000 pounds of scallops and brought them to the Halibut Producers Co-op plant in Seward. The success of the venture brought several New Bedford, Massachusetts fishing companies to the area. They were so successful that the Seward plant, by November 1968, had processed more than a million pounds of scallop meat. Further increases took place in 1969, and the Seward Fisheries plant also began processing scallops. The industry, however, lasted only until the mid-1970s before exhausting the resource. Beginning in 1983, a revival in Cook Inlet scallop harvesting took place. Most of that activity, however, was limited to the area surrounding Augustine Island, on the west side of Cook Inlet; the Outer District witnessed scallop harvesting only in 1987, and then to only a minor degree (see Table 9-12). [143]
Clams and octopus have also been harvested in the vicinity of the park. In 1925, a clam fishery was located in Resurrection Bay. Before long, the federal government had established regulations on its use, and a Stanford University professor named F. W. Weymouth had investigated the beds' economic possibilities. So far as is known, however, the clam resource was not commercially developed. No significant clam resources are known to exist within the present park boundaries. [144]
Of more recent vintage, octopus has been harvested in Area 23 (i.e., the stretch of coastline between Gore Point and Cape Fairfield), as well as elsewhere in Cook Inlet. Since relatively few people have harvested this resource, few statistics are available. Statistics show, however, that harvests were recorded during eight of the eleven years between 1982 and 1992. Octopus has not been fished for its own sake; instead, those seeking groundfish, tanner crab, and other species have caught the species incidentally. [145]
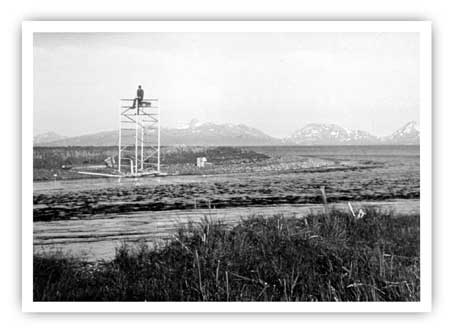
|
| During the early 1960s, and again in the 1970s, the ADF&G had a fish counting tower near the mouth of Delight Creek. Alaska Geographic 10:3 (1983), 9. |
kefj/hrs/chap9.htm
Last Updated: 26-Oct-2002