|
Managing Multiple Uses on National Forests, 1905-1995 A 90-year Learning Experience and It Isn't Finished Yet |
|
Chapter 6
National Forest Management for Multiple Uses: 1980 to 1995
The General Setting
The new approach to national forest planning, the economic and policy highlights of the 1980 to 1995 period, the expanding role of public participation, and growing public confrontation are briefly described in this introductory section to provide an overview of the challenging environment for national forest planning and management during the 1980's and early 1990's. These topics are then developed in more detail in subsequent sections.
A New Approach to Forest Planning
NFMA's final implementing regulations, issued in 1979, initiated a new emphasis on integrated land and resource planning for multiple uses on national forests. The implementation of NFMA was as much a new learning experience as a new planning experience on each national forest, and during the 1980's it continually evolved and improved on each forest.
This new approach was linked with nationally determined long-term RPA goals and called for the integrated planning for all resource uses — recreation, fish and wildlife, water, timber, range, and wilderness — on a forest-wide basis for the next 50 years. This approach superseded and integrated the previous unit planning system, which had required 1,200 "unit" land use plans on 123 national forests, and the functional planning for individual resources that involved the periodic updating of 48 separate major resource plans on each forest. NFMA planning replaced these plans with regional planning guidelines for each of the nine national forest regions and forest-wide integrated land use and resource plans for each of the 123 national forests.
NFMA did not require regional guidelines, but they were considered a useful step for linking the national RPA program with individual forest plans. Regional guides allocated the long-term RPA goals among the forests and were intended and designed to ensure comprehensive and consistent national and regional management direction for all national forest resource uses (USDA Forest Service 1982a).
The goal of NFMA planning was to reinforce a more holistic approach to national forest resource planning, use, and management on a forest-by-forest basis. It was intended that all multiple uses receive equal consideration as long-term planning allocated them to national forest lands for future implementation and that multiple-use planning reflect both the needs and demands of the American people and the capability of national forest lands and resources to serve them. Guidelines for managing the multiple uses would be adequate to sustain the uses and maintain the productivity of the land and the soil. National forest planning under NFMA called for a more evenhanded balancing of resource uses with each other and with national forest land and resource capabilities — forcing greater attention to the interdependent and interactive relationships among the uses and the resources on a forest-wide scale (Cawley 1990). NFMA planning in this way was another step toward an ecosystem approach to planning and managing multiple uses on national forests.
The Forest Service formally considered a fully holistic or ecosystem approach to NFMA planning as it evolved strategies for implementing NFMA planning, but did not adopt the approach for several reasons. Federal policy attention within the Administration and in Congress throughout the 1970's had been strongly focused on increasing timber supplies to achieve housing goals and dampening timber product prices and general inflation. The Forest Service and key Federal policy officials were optimistic that national forest timber supplies could be further increased through greater investments in timber and other resources and appropriate management measures to avoid or mitigate any adverse environmental impacts. Some managers felt that they could adapt their watershed planning and range and wildlife management models to a holistic ecosystem approach for managing multiple uses. But these models and their databases were geared to answer timber suitability questions rather than questions about ecosystem management.
The data supporting timber planning were by far the best developed, with watershed next. The available data for other resources was piecemeal and generally insufficient. Such databases did not generally lend themselves to, and were not readily adaptable for, an ecosystem approach to planning. The models available for ecosystem planning, on the other hand, would have fragmented the timber database and reduced its effectiveness for timber resource planning and for resolving pressing timber supply questions. This was not acceptable. Addressing the timber supply issue was a high priority and required a traditional timber-oriented planning model — one that could readily evaluate the economic efficiency of timber management alternatives. This choice reflected the Forest Service's strong belief that once the timber supply issue was resolved, provisions for other resource uses would fall in line with NFMA resource and environmental standards and guidelines.
The Forest Service was anxious to respond promptly to the NFMA and NEPA planning guidelines. In 1979, for example, final forest plans and EIS's for all but two of the 123 national forests were tentatively scheduled for completion by the end of FY 1983 (USDA Forest Service 1980b). There was a lack of passion and readiness to try to transform the planning process on 123 national forests to a fully holistic ecosystem approach — although the concept did have appeal and was considered at the time. As it turned out, even with NFMA's limited shift toward an ecosystem approach, most of the plans were not finalized until after 1983, and a few not until the 1990's.
In 1982, USDA policy officials under the Reagan Administration undertook the revision of the 1979 NFMA regulations to better balance economic efficiency with environmental protection. They strengthened the role of economic criteria for NFMA planning and decisionmaking and rewrote proposed environmental guidelines to reflect the broader and more general direction of the NFMA legislation itself. Although the action was viewed in some circles as an effort "intended by the Reagan Administration to weaken NFMA as a statement of environmental policy," the final NFMA regulations of 1982 added language that "substantially strengthened" environmental protection for some resources (Caldwell et al. 1994). The most significant case in point was the new language added to elaborate the 1979 NFMA regulatory guideline "to maintain viable populations of all existing native vertebrate species in the planning area." The new language provided that:
A viable population shall be regarded as one which has the estimated numbers and distribution of reproductive individuals to insure its continued existence is well distributed ... to insure that viable populations will be maintained, habitat must be provided to support, at least, a minimum number of reproductive individuals and that habitat must be well distributed so that those individuals can interact with others.
This strengthened language was to play a major role in the resolution of the spotted owl controversy that was emerging in the 1980's on national forest lands in the Pacific Northwest and California (Caldwell et al. 1994).
Economic and Policy Highlights
Double-digit inflation and interest rates emerged in 1979 and 1980 and were accompanied by high rates of unemployment. In response to these conditions, the housing market in the early 1980's dropped sharply over the decade to about 1.7 million units per year, and then to an even lower level in the early 1990's. However, average annual softwood lumber and plywood use during the 1980's and early 1990's rose by more than 10 percent above the peak average annual use of the 1970's, due largely to increased remodeling and repair of existing housing.
Administration and congressional priorities for increasing timber supplies from national forests remained strong throughout the 1980's. In the early 1990's, however, this policy pressure abated as housing construction fell to an average of 1.4 million units and court suits were instrumental in reducing national forest timber harvests in the Pacific Northwest. Despite strong softwood lumber and plywood demands between 1980 and 1995, their relative prices remained substantially below the record price levels of the 1970's. This was largely due to an increase in timber supply — a 60-percent increase in softwood lumber imports from Canada and a 40-percent expansion in softwood lumber and plywood production from the southern pine forests (Ulrich 1990; U.S. Bureau of the Census 1993a, 1993b; Warren 1995; Council of Economic Advisors 1994).
The high inflation and high interest rates in 1979 and 1980 also brought severe pressures to reduce Federal spending and budgets. In 1982, under the Reagan Administration, general inflation and interest rates were controlled and reduced, but Federal budget deficits expanded dramatically during the balance of the 1980's and early 1990's — continuing the pressure to control and reduce Federal spending. In this financial climate, national forest budgets were reduced by 24 percent, from $2.8 billion in 1980 to $2.1 billion (constant 1994 dollars) in 1986, and remained at reduced levels, an average of $2.4 billion, through 1994. National forest staffing was similarly reduced, by 26 percent, from 41,700 FTE's in 1980 to 30,900 in 1988. Staffing recovered somewhat in 1989 and reached an average of 34,500 FTE's between 1992 and 1994 (USDA Forest Service 1994f).
Despite funding and staffing reductions, national forests continued to balance staffing among the resource disciplines and improve their capabilities for managing multiple uses on the land in a more integrated manner. For example, staffing for timber programs, including timber sales, silvicultural examinations, resource planning, and all reforestation, timber stand improvement, and brush disposal activities, declined by 18 percent, from about 12,900 FTE's in 1980 to 10,500 in 1994. Much of this reduction reflected the sharp drop in timber sales during the early 1990's. On the other hand, staffing for soil and water programs increased by 40 percent, from 1,170 FTE's in 1980 to 1,640 FTE's in 1994. Wildlife and fish FTE's increased by 114 percent, from 1,040 to 2,230. Recreation program staffing rose by 49 percent, from 3,420 FTE's to 5,100 FTE's. Road and facility engineering staffing, as with staffing for timber programs, also declined, by 64 percent, from 5,220 FTE's to 1,860. Staffing for minerals management, however, increased from 230 to 400 FTE's, or by 66 percent. Range management staffing declined from 1,090 FTE's to 920, or by 16 percent (USDA Forest Service 1994f).
The rapid growth of national forest use abated between 1980 and 1995. Timber sale offerings and volumes sold during the 1980's averaged 11.5 and 10.7 bbf, respectively, about the same as the 1970's decade, then both dropped sharply during the early 1990's to less than 4.0 bbf by 1994. The decline was concentrated in the Pacific Southwest and Pacific Northwest Regions, but all regions except the Eastern Region experienced a decline in timber sale levels. In the early 1990's, timber sales in the Eastern Region, a predominantly hardwood region, averaged 710 million board feet — 17 percent above the 1980 level. Permitted grazing capacity remained more or less stable at 9.8 million AUM's per year, but actual range use declined from 8.7 million AUM's in 1992 to 8.1 million AUM's in 1994
Recreation visitor day (RVD) use, including wildlife, fishery, and wilderness use, actually experienced a 4 percent decline by 1987, and then began to increase again at 3.4 percent per year to 1994 — substantially faster than the 1 percent population growth rate. The overall average rate of increase for the 15-year period from 1979 to 1994 was 2.2 percent.
NEPA and NFMA regulations and court injunctions increased the need for more intensive oversight of mining plans and operations. Mineral management activities responded with more thorough environmental assessments and protection standards. The number of producing gas, oil, coal, and geothermal leases increased during this period, while the acreage under lease for exploration and production decreased.
This general respite from the dramatic increases in national forest use of the previous three decades, however, did not bring any slackening of the public controversy associated with national forest land and resource planning and management or the public's interest in participating in that planning and management (USDA Forest Service 1981b, 1994e, 1994f).
The Role of Public Participation and Growing Confrontation
The passage of NEPA, RPA, and NFMA legislation during the 1970's greatly broadened the opportunities for a wide range of people and organizations with highly diverse expectations and sharply differing values, preferences, and viewpoints to become involved in national forest planning, decision making, and project implementation. These opportunities rose to new heights between 1980 and 1995 as NFMA planning, framed by NEPA's requirements for environmental impact analysis, got under way. Public participation in national forest planning activities literally exploded. NFMA planning for the 123 national forests, as reported in 25 draft and 97 final forest planning environmental documents, involved more than 72,000 public input events (table 4) (Russell et al. 1990).
Table 4. Number of public input events by type of event
| Type of Event | Number |
| Meetings Held | 1,216 |
| Brochures and Newsletters Produced | 650 |
| Contacts and Consultations Made | 6,651 |
| Letters of Response Received | 63,607 |
| Total | 72,124 |
Source: Russell et al. 1990. | |
Many more thousands of citizens participated in meetings, in preparing brochures and newsletters, in direct contacts and consultations with national forest managers, and in review and comment on draft EIS documents. About 90,000 copies of NFMA plans and supporting EIS documents were distributed to public policy officials, public agencies, private organizations, and individuals for review and comment.
NEPA, RPA, and NFMA intended that the public's views and ideas on national forest planning and decisions be solicited and taken into account during the development of both draft and final plans and decisions. Legislators and the Forest Service hoped that a wide range of the public would be interested in forest planning and that such interest would lead to fewer appeals and court suits on final national forest plans, EIS's, and decisions. But the public's expectations were very diverse and strongly held. Environmental groups believed NFMA mandated national forest management reform — reform that would involve a change from what such groups viewed as a dominant commodity production focus to a focus on increased protection and enhancement of noncommodity uses, especially the expansion of wilderness areas. Timber industry groups looked for forest plans to achieve the high RPA-set timber production targets more effectively to meet the national demand for wood products. Other groups identified success in terms of their own particular expectations (Larsen et al. 1990).
Growing Public Confrontation
As NFMA plans and resource management projects were developed, completed, and implemented during the 1980's, public participation grew, and debates about the appropriate use and management of the national forests increased and intensified. Growth in public participation led to an increasing number of challenges as individuals and groups turned to the press, demonstrations, the Forest Service administrative appeals process, court suits, and legislative actions to pursue their goals. By the end of the 1980's, the number of new appeals, for example, had risen to more than 1,000 per year. Such challenges focused primarily on timber harvest and management, but every resource area was affected by them.
Plan and project appeals were directed to the deciding officials and, therefore, were predominantly local — 56 percent went to regional foresters and 33 percent to forest supervisors. Only 11 percent were directed to the Chief of the Forest Service or the Secretary of Agriculture.
Environmental interest groups increasingly turned toward appeals, national public opinion, and interventions by judges and sympathetic congressional authorizing committees to achieve their national forest management goals. Between 1980 and 1995, these groups became increasingly sophisticated and successful in pursuing their goals through court suits, political campaigns, and legislative action — a success that was epitomized by the resolution of the northern spotted owl issue in the Pacific Northwest (Hoberg 1993). A 1993 court injunction and the Northwest Forest Plan adopted in 1994 for the management of the northern spotted owl habitat led to a reduction of several billion board feet in old-growth timber harvests on Pacific Northwest national forests in favor of maintaining a more extensive old-growth environment to protect the viability of the threatened northern spotted owl populations and other old growth-dependent species.
Thus, while public participation brought significant increases in public input to national forest planning between 1980 and 1995, it also increased and intensified issues and debates between national forest managers and the public about the appropriate use and management of national forests. Chief Robertson, addressing the Lands Committee of the Rocky Mountain Oil and Gas Association in 1988, characterized the environmental community as "extremely vigilant" and "watching every step we make on national forests and standing ready to challenge any decision that has a weak spot" (Robertson 1988).
The National Forest Planning Process and Its Performance
Initially, many national forest managers were hopeful that the NFMA planning process would be largely scientific and produce scientific solutions that would avoid political entanglements — an assumption that tended to shape the public participation process. Lofty expectations accompanied this approach. Its goal was to inform and involve the public — to give the public information and to receive public input — as opposed to problem resolution through two-way communication, negotiation, and shared decision making. The new forest plans were expected to be more balanced in terms of resource coordination and integrated management for the multiple uses and better understood by the public, thereby earning more public support and producing fewer appeals and litigation. National forest managers hoped, as expressed by Senator Hubert Humphrey, that "forest managers could practice forestry in the forest and not in the courts." The public had similar high hopes. Neither the public nor national forest managers anticipated the influence that the changing values emerging among public interest groups and the maturing of the environmental movement would have on the process. NFMA planning quickly became much more confrontational and political than ever expected. As a result, the planning process became increasingly complex and demanded and consumed more time (Larsen et al. 1990a).
The Public Issue and Management Concern
The NFMA planning process was designed to respond to the 1980 RPA national program goals at the local forest level. RPA projected modest increases in all national forest resource uses by 1995 and major increases in outdoor recreation uses, including wildlife, fisheries, and wilderness; timber harvests; and mineral and energy operating plans, by the year 2030. These projections largely reflected past national forest resource use and demand trends, including a strong response to the newly established demand for substantial expansion of national forest wilderness. This raised both public interest and public concerns.
The planning process provided a forum for addressing and resolving national forest resource use issues and management concerns that emerged from the public's very diverse and conflicting interests. In practical terms, the purpose of the forest plans was to provide answers to three questions: What is a forest good for (its ecological potential)? What do people want from the forest? and How do we meet today's needs, while preserving future options? (Shands et al. 1990).
One of the initial steps in the planning process established each forest's baseline or potential for each of the major resource uses. These capacity limits defined the outer boundaries of the forest planning process. The second step was the identification of issues and opportunities by the public and planning and management concerns by national forest managers. Public issues basically defined the alternatives to be considered. Also, they often reflected and defined longstanding conflicts among competing national forest uses and user interests. In a way, they represented highly politicized public policy questions. Forest planning, however, tended to respond to these issues as management problems and addressed them through the largely scientific and technical planning process (Shands et al. 1990). The commitment of the forest planning process to the 1980 RPA's long-term output goals and objectives tended to orient the planning process toward traditional multiple-use planning and management. Such a technical planning approach did not respond well to the social and political content of the public issues and did not provide an arena for public interest groups to confront each other and work with policy officials toward mutually acceptable solutions. As a consequence, external pressure on national forest planning mounted. The 1980's were marked by an increased number of appeals and litigation that focused heavily on limiting or reducing the commercial uses of national forests, particularly timber harvesting.
The Role of Planning Alternatives and Management Direction
The public issue process revealed the public's wide scope of expectations for national forest use and management. Thus, there was a corresponding variety of alternative ways national forests could be managed. Taken collectively, these reflected the full diversity of the public's expectations, RPA program goals, and existing management plans and goals. The preferred management alternative was determined and selected by comparing the net public benefits (the discounted market value of all future uses less management costs) of the alternatives and how they responded to the various public issues.
National forest planning alternatives typically included the existing forest plan or plans as the NEPA-required "no action" alternative, and a specific alternative that responded to the RPA goals. Other alternatives could include high, moderate, and low commodity-output options and a similar set of amenity alternatives. Still others might focus on wilderness, wildlife and fisheries, or recreation, or address a particular public issue. A few forests included an alternative that was defined collectively by conservation interests or other interest groups.
Because of their long-term nature, forest plans were goal-oriented and did not specify actual year-by-year on-the-ground implementation. In other words, forest plans were not project- or site-specific. This became quite a problem for many interest groups who expected forest plans to make site-specific decisions. Their expectations led to many forest plan and project appeals. Each year, national forests made decisions on about 40,000 resource management projects — an average of 325 per national forest per year. Over the 10- to 15-year expected life of a forest plan, the inclusion of such projects in the forest planning process would have entailed advance planning and decisions for 3,250 to 4,875 site-specific projects per forest (Gippert and White 1990).
Management Direction for Implementing Alternatives
The management direction for each alternative was determined by its long-term goals for resource use. It also reflected the direction given in the laws and regulations and the influence of scientific knowledge, technology, and experience, but did not assign any specific forest management activities. Such management direction likewise provided for the protection of soil productivity and environmental quality. In addition, there were environmental guidelines and standards, referred to as "management constraints" (management requirements) to ensure viable wildlife and fish populations, meet State water quality standards, and protect endangered species. Each alternative mapped national forest lands into management areas (land use "zones" ) reflecting different resource conditions and potentials for use — each area uniform enough to have its own management direction for expected uses, environmental protection, and mitigation. Most forests had about 20 management areas. The planned resource goals and uses among these management areas varied with each alternative, and the management direction likewise varied accordingly.
Many forests were able to design management direction in ways that mitigated or resolved certain public issues. The most successful forests were able to distill their public issues into problem statements. The management direction for each management area then served to resolve such issues. This approach appeared to help the public visualize what would take place on the forest in better detail and tended to increase the public's acceptance of planning decisions (Bosworth et al. 1990).
|
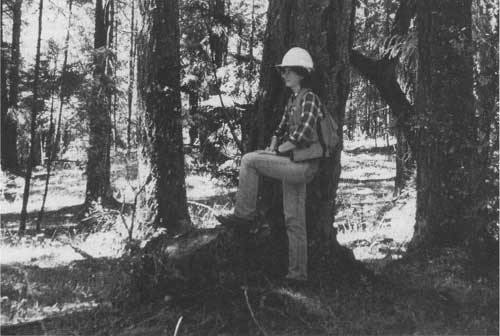
| Forester examining silvicultural practices on Douglas-fir, Siskiyou National Forest, Oregon. (USDA Forest Service Photo. Taken by Melissa Carlson.) |
Principal Guidelines for Planning Multiple Uses
NFMA affirmed the management of national forests for multiple uses. It defined many constraints that explicitly provided for the protection of soil, water, and especially wildlife and fisheries. It also provided strong guidelines for implementing the interdisciplinary approach.
NFMA guidelines and regulations also focused strongly on the timber resource. Timber harvesting would be limited to forested lands where the soil, slope, and other watershed conditions would not be irreversibly damaged and where there was an assurance that the land could be successfully restocked with trees within 5 years following timber harvest. Streams, lakes, shorelines, and other wetlands would be protected from detrimental changes associated with timber harvesting. Clearcutting would be limited to conditions where it was determined to be the best-suited or optimum method to meet land management objectives and not necessarily the one that produced the greatest dollar return or timber volume. Clearcut size would be restricted.
NFMA guidelines and regulations also permitted increased harvest levels based on intensified management, but only if such management was consistent with the MUSY Act of 1960 and successfully implemented. Timber harvesting, except for salvage sales or sales needed to protect other multiple-use values, was precluded on lands classed as not suited for timber production.
Each forest's harvestable volume was limited to the amount that could be removed annually, in perpetuity, on a long-term sustained-yield basis. A forest plan could depart from such a nondeclining flow level, but only where the increased volume provided by the departure helped to achieve one or more other multiple-use management objectives, determined with public participation, in the forest plan.
NFMA also provided for maintaining the diversity of plant and animal communities on each national forest. Its regulations required that fish and wildlife habitats be managed to maintain viable populations of existing native and desired nonnative vertebrate species in the planning area to ensure that such species did not become threatened or endangered. Forest plans were also to protect and restore habitats of any endangered species that existed in the planning area to sustain their populations. This direction responded to ESA's policy objectives and direction.
NFMA called for integrating economic analysis with biological considerations. This was achieved by defining alternative forest resource management practices that would satisfy NFMA's and NEPA's biological and environmental constraints and by selecting the practices that would achieve the resource output goals most efficiently based on their expected rate of return on investment costs. This procedure was most useful in planning the management direction and timberland area needed to achieve the timber management goal.
The plan's EIS was to discuss the environmental impacts for each forest plan alternative. It was also to address social, economic, and community impacts as well as the biological and physical resource effects. Although NFMA itself was vague about the need to assess community impacts, national forest managers needed to be responsive to community concerns and the impacts that plan alternatives had on a community's stability and viability. Generally, this meant planning national forest management in a way that would avoid radical or abrupt changes in a community's economic and social structure.
The Interdisciplinary Process
NFMA required that each national forest use an interdisciplinary team to develop its forest plan. The role of the interdisciplinary team was to ensure that forest planning would fully consider the physical, biological, economic, social, and other sciences in the long-term planning and management direction for multiple uses — a requirement that was intended to replace the strong role of the traditional multidisciplinary "planning by individual resource function" approach to national forest management. The interdisciplinary team requirement broadened the professional skills available on each forest. The hiring of new and more "ologists" over time contributed to a more evenhanded interdisciplinary approach in developing forest use plans and management direction for each of the multiple uses in each management area (Office of Technology Assessment 1992).
In 1990, a Forest Service retrospective evaluation of the interdisciplinary process, based on comments and responses from 178 key local people in all national forest regions, found that the public had very favorable views about the process. They generally believed that the interdisciplinary process allowed all resources to be appropriately considered and, in this way, helped to achieve more sound management decisions. The interdisciplinary approach also enabled more environmental issues and impacts to be assessed than previous planning approaches. Both the responding public and national forest professional staff believed that the interdisciplinary process produced far better multiple-use coordination than earlier multidisciplinary planning methods had (O'Neal et al. 1990).
The Plan Decision Process: Plan Approval, Appeals, and Litigation
The draft EIS displayed the environmental analysis process and its results and provided initial information for evaluating plan alternatives and identifying a preferred alternative. All alternatives were designed to meet environmental protection objectives and resource management constraints. Alternatives were compared by estimating the net public benefits of each alternative, various indicators of each alternative's response to public issues, and the RPA goals for individual resources.
The Preferred Alternative
The selection of a final alternative was based on the public's review of and response to the forest plan's draft EIS and its preferred alternative. Frequently, the public feedback led to adjustments and modifications in the preferred alternative or the selection of another alternative. The regional forester for each region selected the final alternative, issued a final EIS, and documented the decision in a record of decision. Such a decision could be appealed to the Chief of the Forest Service.
Once plans were approved, they became the legal guide for developing annual program and budget proposals. Management direction provided the starting point for implementing the management of multiple uses and their planned annual outputs on the ground. The actual implementation of forest plans, however, was controlled by congressional budget allocations to national forests, which influenced the scheduling and timing of resource outputs and management practices to be used and also the general resource management emphasis (Bosworth et al. 1990).
Forest Plan Appeals
The number of forest plans completed each year is displayed in table 5, together with information on the number of new appeals, resolved appeals, pending appeals, and forest plans free of appeals (USDA Forest Service 1981-1995, 1995e).
Table 5. Appeals of completed forest plans by number, status, and year
| Years | Forest Plans with EIS filed with EPA |
New Appeals |
Appeals Resolved |
Appeals Outstanding |
Forests Free of Appeals |
| 1983 | 4 | — | — | — | |
| 1984 | 5 | 24 | 22 | 2 | — |
| 1985 | 14 | 31 | 23 | 10 | 5 |
| 1986 | 42 | 230 | 41 | 199 | 12 |
| 1987 | 17 | 151 | 117 | 233 | 24 |
| 1988 | 8 | 317 | 184 | 366 | 39 |
| 1989 | 7 | 84 | 155 | 295 | 49 |
| 1990 | 17 | 182 | 128 | 349 | 62 |
| 1991 | 123 | 117 | 355 | NA | |
| 1992 | 4 | 57 | 122 | 290 | 78 |
| 1993 | 0a | 40 | 99 | 231 | 79 |
| 1994 | NA | 3 | 29 | 205 | NA |
| 1995 | NA | 3 | 24 | 184 | NA |
| Total | 123 | 1245 | 1061 | 184 | — |
aFinal EIS delayed on four California national forests due to need to revise previously completed draft plans in response to the listing of the spotted owl as a threatened species. Source: USDA Forest Service 1981-1995, 1995e. | |||||
As more plans were completed and final EIS's issued, plan appeals escalated to a peak level in 1988 and then declined. Forest plan appeals through 1995 totaled 1,245. The number of appeals per plan or forest varied from a low of 5 to a high of 25. In 1995, there were still 184 appeals outstanding — about four appeals per plan. Table 6 summarizes the resolution of forest plan appeals (USDA Forest Service 1995e).
Table 6. Resolution of forest land and resource management plan appeals
| Resolution of Appeal |
1984-1989 | 1990-1995 Number |
Total |
| Appeals on Plans Remanded to Forest | 37 | 7 | 44 |
| Appeals on Plans Affirmed | 132 | 329 | 461 |
| Appeals Nonsubstantive | 70 | 62 | 132 |
| Appeals Dismissed | 179 | 41 | 220 |
| Appeals Withdrawn | 127 | 77 | 204 |
| Totals | 545 | 516 | 1061 |
Source: USDA Forest Service 1995e. | |||
The record of appeal resolutions suggests that appellants' actions were not very effective for their purposes, which belies the actual case. The contents of all appealed plans received careful evaluation in the Chief's Office. In order to be prepared to provide effective responses to a Chief's Office appeal evaluation, most forests reviewed their plans critically. As a result, many appeals were withdrawn through negotiated agreements for revisions and amendments with national forest planning officials below the Chief's level. The dismissals generally reflected untimely appeal submissions, appeals for remedies not legally available to national forest managers, or issues that were outside the scope of the planning effort. The appeals on procedure (nonsubstantive appeals) were concentrated on just two national forest locations — the Los Padres National Forest in California and those involved in the northern spotted owl issue in the Pacific Northwest — and were essentially dismissed. More than 90 percent of the decisions on substantive appeals affirmed the final EIS and its selected final forest plan.
Only 44 of the substantive appeals were remanded to the forests for further review and consideration of the appeal issue and forest-level revision or amendment. Most of the remanded appeals (37) occurred with the earlier completed plans and appeals made before 1990.
Although almost all of the planning appeals resulted in affirmed plans or were dismissed or withdrawn, they raised issues that led to improvements in the planning process, the quality of the disclosure of the environmental impacts in the final forest plan, and the management direction published in the final EIS documents. These improvements appear to be reflected in the relatively fewer number of remands between 1990 and 1995 — 5.1 percent of 136 substantive appeals that were not dismissed or withdrawn compared to 21.9 percent of the substantive appeals not dismissed or withdrawn between 1985 and 1989. In addition, the number of appeals that were dismissed or withdrawn declined substantially after 1989 (table 6). However, relatively more appeals were referred to the Chief for affirmation or remand. This trend indicated more effective presentation of appeals by appellants and relatively fewer negotiated settlements of appeals at the forest level.
NEPA and NFMA Forest Planning Litigation
Some public interest groups and individuals pursued their dissatisfaction with approved forest plans through court suits and adjudication. The number of such suits, however, was much less than the number of forest plan appeals. The first forest plan to be challenged in litigation was the Rio Grande (Colorado) National Forest plan. Between that initial court challenge in 1987 and 1995, a total of 49 court suits relating to national forest plans were adjudicated. This compares with the resolution of 1,061 out of 1,245 forest plan appeals without court suits during the same period. In 39 of the 49 suits (80 percent of the time), the courts upheld the forest plans. In addition to the approval of the forest plan itself, most of the suits involved timber harvest or management issues or biological diversity, endangered species, and wildlife or fisheries management issues. Other suits addressed issues related to range, recreation, roadless area evaluation, water rights, public involvement, watershed effects, old growth, minerals, road development, or, in a few instances, regional guidelines, but at a lower frequency than timber and wildlife issues.
The 10 court suits adjudicated in favor of the plaintiffs generally involved either timber management or endangered species issues or both, including the spotted owl and the salmon species issues in the Pacific Northwest. All but one of these suits related to forest plans in the Pacific Northwest or the northern Rocky Mountains.
Project-Level Appeals and Litigation
As national forest plans were increasingly affirmed through the appeals process and court litigation, public interest groups and individuals increasingly turned to challenging the implementation of site-specific projects to pursue their particular concerns about national forest management. The number of project appeals awaiting decisions rose rapidly, from 163 at the beginning of 1986 to 1,626 at the end of 1992 (table 7).
Table 7. Summary of project appeal activity, 1986-1992
| Appeal Status | 1986 | 1987 | 1988 | 1989 | 1990 | 1991 | 1992 |
| Number of Appeals | |||||||
| Pending January 1 | 163 | 563 | 628 | 1,044 | 1,045 | 1,249 | 1,453 |
| New Appeals | 1,081 | 874 | 1,609 | 1,291 | 1,991 | 1,386 | 1,659 |
| Decisions Rendered | 681 | 809 | 1,193 | 1,290 | 1,787 | 1,182 | 1,486 |
| Pending December 31 | 563 | 628 | 1,044 | 1,045 | 1,249 | 1,453 | 1,626 |
Source: USDA Forest Service 1992a. | |||||||
New appeals in 1986 numbered 1,081, compared with 1,659 in 1992, and totaled 9,983 for the 1986 to 1993 period (includes 1,144 forest plan appeals). Appeals resolved in the same period rose similarly, from 681 to 1,486, but this increase was not great enough to catch up with the growing workload of pending and new appeals.
The appeals focused most heavily on timber sales and management issues (table 8). For 1991 and 1992, such appeals constituted 52.6 percent of the new appeals, while recreation, range, land management planning, minerals and geothermal management, and lands administration each constituted between 6 and 11 percent. Most appeals related to resource management projects; only 201 related to land management planning.
Table 8. Distribution of administrative appeals related to national forest management for 1991 and 1992
| Resource or Management Activity |
Number of Appeals |
Percent of Total |
| Timber | 1,530 | 52.6 |
| Recreation | 320 | 11.0 |
| Land Planning | 201 | 6.9 |
| Minerals | 220 | 7.6 |
| Range | 182 | 6.3 |
| Lands | 189 | 6.5 |
| Wildlife/Fish | 126 | 4.3 |
| Engineering | 62 | 2.1 |
| Pest Management | 13 | <1 |
| Water/Air | 8 | <1 |
| Other | 60 | 2.1 |
| Total | 2,991 | 99.4 |
Source: USDA Forest Service 1992a. | ||
Many of the project-level appeals were filed by interest groups and individuals pursuing issues that they felt had not been fully responded to or resolved in approved forest plans and EIS's or actions on plan appeals. The appeals were widely distributed throughout the National Forest System. The greatest concentration, almost 73 percent of all the appeals in 1991 and 1992, were in the major timber-producing regions: Pacific Northwest (Region 6), Northern (Region 1), Southern (Region 8), and Pacific Southwest (Region 5). Thus, public issues and appeals did not abate as national forest plans were approved for implementation and as forest plan appeals were increasingly resolved. The focal point for appeals merely moved from forest plans to site-specific projects.
After 1988, litigation accelerated. The number of NEPA cases litigated rose from 50 between 1970 and 1988 to 79 for between 1989 and 1995. However, the Forest Service success ratio on NEPA court suits rose from 20 out of 47 cases (43 percent) between 1970 and 1978 to 63 out of 79 cases (80 percent) between 1988 and 1995 — a fact that was largely attributed to the Forest Service's commitment, beginning in 1979, to provide Service-wide intensive training and preventive law advice on NEPA's legal requirements, its related decision documents, and its effective implementation in an effort to help meet the growing challenge of NEPA compliance (Bremen 1995). This initiative contributed importantly to more effective responses to NEPA standards and requirements, as well as to better written NEPA and decision documents.
National Action Plan To Improve NEPA Compliance
In 1988, the escalating number of project appeals and the high level of adverse NEPA court suits led the Forest Service to establish a national task force to determine the underlying causes of this performance. There was a growing concern within the Forest Service that the trend of increasing litigation and appeals would significantly change the balance of management activities on national forests and disrupt timber sales and oil and gas leasing, particularly in unroaded areas and old-growth timber. The task force reported three basic problems requiring correction to achieve more effective NEPA compliance and minimize future litigation and appeals: an often insufficient understanding of NEPA requirements among national forest managers and staff; widespread reluctance within the Forest Service to prepare EIS's; and confusion about when specific planning, management, and NEPA-related decisions were made (USDA Forest Service 1989a). Citizens participating in the NFMA planning process also shared the last concern.
This evaluation resulted in A National Action Plan: Improving Compliance with the National Environmental Policy Act in Project Decisionmaking (Leonard 1989). The action plan involved formal participation of Forest Service leadership from the Chief down to the district ranger and all professional staff involved in preparing environmental analyses. It focused on removing the obstacles national forest managers and staff faced in trying to comply with NEPA and NFMA when analyzing, designing, and deciding on resource management projects. Such obstacles included pressures brought on by heavy, time-consuming workloads and a tendency to cut corners to meet planned program and budget targets — particularly, but not exclusively, for timber harvests; unclear signals on priorities; lack of clear, accessible direction on NEPA compliance; changing interpretation and direction; paperwork overload; and changing analysis standards for assessing environmental impacts.
Formally implemented in the spring of 1989, the National Action Plan's short-term actions included a letter to line officers with Chief's direction, followed up by joint Deputy Chief and regional management meetings; regional action plans and inventories of available NEPA resources and skills; national team assistance on specific projects; a national newsletter on NEPA compliance; a national training workshop with followup on how to help interdisciplinary planning teams and EIS teams; and a state-of-the-art "answer book" with references.
Longer-term activities included a high-quality training course on NEPA and NFMA appeals and litigation processes and requirements as well as other, more specialized courses, including training in conflict resolution, the development of analytical models for estimating environmental impacts, and the expansion of the national database and library on NEPA compliance needs.
The national effort to improve NEPA compliance was applied effectively and energetically throughout the National Forest System. It continues to operate, and its activities have improved and expanded with time and experience. The best evidence of its effectiveness is the major reversal of the ratio of appeal wins versus losses since 1988. The number of new NEPA appeals and suits, nevertheless, has continued to grow, indicating dissatisfaction with national forest use and management among strong residual segments of public interest groups and individuals, which include commodity as well as environmental interests. Their attention generally focuses on commercial uses of the forest and related environmental concerns, and particularly on timber harvesting and management and its perceived environmental effects. In view of the progress national forests have made in meeting NEPA requirements and standards, it raises a question about the goal of the growing number of appeals and suits. Improved national forest NEPA compliance indicates more effective responses to Federal laws setting environmental standards that national forests management must satisfy. Under these circumstances, one would normally expect NEPA compliance appeals and suits to decline rather than rise. However, appeals and litigation are a means of stopping or more thoroughly exploring management decisions that are not favorable to a group's or individual's interests. Some groups became quite sophisticated in the pursuit of these interests. One group, the Wilderness Society, for example, published two handbooks How to Appeal Forest Service Plans and Issues to Raise in a Forest Plan Appeal (Wilderness Society 1986a, 1986b).
Revision of the Rules of National Forest Land and Resource Management Planning
In March 1989, as an initial step for revising and updating the existing rules for the second cycle of national forest planning under NFMA, the Forest Service undertook a comprehensive review and critique of its land management planning experience. The critique, completed in May 1990, documented what had been learned in the first cycle of NFMA planning and suggested the best ways to respond to the planning challenges of the second cycle. A summary report, Synthesis of the Critique of Land Management Planning, Volume 1 (Larsen et al. 1990a), and 10 other, more detailed reports documented the results. The critique involved more than 3,500 people inside and outside the Forest Service. More than 2,000 people participated in or had responsibilities for planning and providing guidance through formal workshops and interviews. They included members of the general public, interest groups, representatives of other resource management agencies, elected officials, Indian tribal leaders, forest supervisors, regional foresters, resource specialists, and members of interdisciplinary planning teams. An additional 1,500 interested people submitted written comments on the planning experience of the 1980's.
The findings identified six major areas where adjustments were needed: citizen, lawmaker, and Forest Service expectations of planning; the Forest Service attitude toward and conduct of public involvement; how the Forest Service conducts planning; simplification and clarification of planning procedures; implementation of plans, particularly to ensure that they are followed and used; and connections between appropriations and forest plans.
Some 272 detailed recommendations were combined into seven major recommendations:
Reduce and clarify planning rules and direction, including a planned, step-by-step approach to forest plan revision and increased responsibility and authority of local resource managers.
Inform and involve public interests early and continuously; increase line officer commitment to planning and improve analytic tools and their application to planning questions.
Ensure that planning is adequately staffed with the variety of skills it needs and that research support is adequate to increase the effectiveness of integrated resource management.
Strengthen and clarify the linkage between forest plans, programming and budgeting, and appropriation activities.
Educate the national forest staff, citizens, and cooperators about the RPA, NFMA, and NEPA planning processes and how they fit into the national forest multilevel planning, decision making, and management processes.
Develop a strategy for revising forest plans and improve methods for monitoring and maintaining forest plans.
Strengthen Forest Service quality control and management review mechanisms and disseminate results together with decisions from appeals and litigation to interested public (Federal Register 1991).
The critique's findings became valuable guidance in preparing the Forest Service's draft proposal to change land management planning regulations. The Forest Service published an advance notice of proposed rulemaking in the Federal Register in February 1991 (Federal Register 1991), soon after Synthesis of the Critique of Land Management Planning was published, to solicit comments on the draft planning regulations. The advance notice of rulemaking's text was strongly based on about a third of the critique. Readers were encouraged to study the critique's reports along with the preliminary text. Other reviews and informational papers used to update the existing rule were the results of land management plan appeals and litigation, various published professional papers on the planning process, and related papers such as the Keystone Policy Dialogue, which addressed biodiversity on Federal lands. The advance notice restated the Forest Service's conclusion that although NFMA had some limitations, it was basically sound policy guidance. NFMA, for example, did not specifically address the ecosystem concept and management approach to national forest land and resource management planning, but the critique included a recommendation to "take an ecosystem approach to multiple-use, sustained-yield management . . . in contrast to a resources approach...." (Shands et al. 1990). The advance notice's proposed regulatory text moved in that direction in its purposes and principles. It emphasized the need to manage national forest multiple uses, including environmental and amenity values, in an ecologically sound manner. Under integrated resource management, the proposed rule included ecological subunits such as biological communities and special habitats as management indicators in addition to the traditional management indicator species.
The Forest Service distributed 20,000 copies of the advance notice to interested persons and groups and invited comments on the rule. More than 600 responses provided 4,700 comments. Business and industry interests; Federal, State, and local government agencies; conservation and environmental groups; and Forest Service employees each provided between 9 and 11 percent of the comments, for a total of 41 percent. Recreation and other user groups, academics, and civic organizations each provided 1 to 2 percent of the comments — a total of 4 percent. The remaining 55 percent came from individuals. (Federal Register 1995). Following the processing of the comments on the 1991 advance notice, there was an extended delay in publishing a proposed rule — until 1995. The delay was influenced institutionally by a Bush Administration moratorium on the issuance of new regulations, the change in Administrations after the November 1992 presidential election, and a need to review the proposed rule making with the new Clinton Administration policy officials. Chief Robertson's 1992 announcement of the intention to move the National Forest System toward an ecosystem approach in managing multiple uses added a new technical dimension to NFMA rule making not addressed in the advance notice. The continuing northern spotted owl controversy in the Pacific Northwest in the early 1990's — a focal point for exploring ways to implement principles of ecosystem management — remained unsettled until late 1994. It created its own uncertainties and tensions about implementing an ecosystem approach to national forest management. There also were substantial litigation and court decisions in this period; these continually introduced new considerations about how and to what extent ecosystem management guidelines could be introduced into the NFMA regulations (Federal Register 1995). The Forest Service finally published its proposed rule in the Federal Register in April 1995. The proposed rule included a major new Forest Service finding and conclusion: "Principles of ecosystem management need to be reflected in the planning regulations."
The Forest Service has made its intention to move toward an ecosystem management approach clear and, in the last few years, it has actively promoted implementing ecosystem principles consistent with existing laws. Other Federal agencies have acted similarly. When the spotted owl controversy in the Pacific Northwest was settled in 1994, it became a particular case in point. The 9th District Circuit Court upheld the validity of an ecosystem approach in sustaining the Record of Decision for the Range of the Northern Spotted Owl from programmatic challenge (SAS v. Lyons, No. C92—479WD [W.D. WA Dec. 21, 1994]). Judge Dwyer, in rendering that decision, stated, "Given the current condition of the forests, there is no way the agencies could comply with environmental laws without planning on an ecosystem basis" (Federal Register 1995).
The Forest Service recognizes that the ecosystem approach to management is an evolving concept and that much remains to be learned about how best to implement its principles practically in managing multiple uses. The Forest Service issued the proposed rule as a transitional step for incorporating the principles behind the ecosystem approach into land and resource management planning consistent with NFMA. Although the existing "crazy quilt" framework of Federal laws occasions some limitations and uncertainties for implementing ecosystem concepts, progress can be made within this framework. The Forest Service believes that existing statutes may need to be adjusted before the ecosystem approach can be transformed from an evolving approach to a fully operational reality for the National Forest System (Federal Register 1995).
The proposed planning rule's first principle requires that the National Forest System be managed to provide sustainable ecosystems that yield multiple benefits to present and future generations. It then defines people as a part of those ecosystems and defines the primary role of resource decisionmaking as meeting people's needs and desires within the capacities of those ecosystems.
Forest plans will establish direction for the integrated management of soil, water, fish and wildlife habitat, grazing, timber, oil, gas, mineral, recreation, wilderness, cultural, historic, geologic, vegetative, air, visual, and other relevant resources.
Management direction will focus on achieving objectives that will be described in terms of desired resource conditions, or ranges of conditions, associated with ecosystem variations.
Objectives will be designed to achieve forest plan goals describing desired end results in broad general terms. These forest plan goals will link broad Forest Service goals expressed in the law, Executive Orders, regulations, or Forest Service directives and the RPA program to the desired resource conditions specified in the forest plan.
The forest plan will not specify a time period for achieving its goals and objectives. Actually, the desired resource condition will be the basis for determining the capability of local national forest ecosystems to meet the multiple uses sought by national forest users.
Under the proposed NFMA planning regulations, projections of goods and service levels or management activity levels would not be any part of forest plan direction. Experience with existing plans has shown that such projections are not reliable or predictable and are often not even determined by the plan; rather, they are determined by annual budgets and programs, actual market demands, and by appeals and litigation — processes and decisions not under the control of national forest managers. Thus, the state of forest resource conditions desired for soils and rangelands and other vegetation, historic or cultural site retention, or visual quality or wilderness experience and the associated management direction would determine the forests' capability to respond to them. The proposed rule also assumes that effective ecosystem management, properly implemented, including the management of endangered, threatened, and sensitive species habitats to avoid their extirpation or listing in the case of sensitive species, would automatically provide for habitat diversity as well as sustainability. The proposed rule focuses forest plans on achieving and sustaining desired resource conditions and responding to multiple-use demands according to the capacity of those ecosystems to supply them. Thus, forest plans would no longer include quantitative outputs except in the case of timber resources. NFMA explicitly requires quantitative output objectives for timber.
Under the proposed rule, national forest management would, in some ways, become more holistic, increase its emphasis on an interdisciplinary approach, and seek more effective public participation to integrate the management of its multiple resources and uses. The ecosystem approach would involve a broader geographic and landscape-oriented perspective in fitting the multiple uses into forest ecosystems. It would also consider conditions on other public and private lands outside the forest plan area to ensure that national forest lands are managed from a broad, ecological perspective rather than one limited to jurisdictional boundaries. This effort will involve improved and increased public participation to avoid impinging on the rights of private landowners and the authorities of other public agencies.
The proposed rule provides still another approach to integrated management of multiple uses in a way that will sustain both the forest uses and the ecosystems that support them for the benefit of future generations. Its final form will depend upon the public comments on the purpose and content of the proposed rule closed in August 1995. A second proposed rule was drafted in response to the public comments and, as of March 1997, had been scheduled to be reissued for an additional 90-day comment period in mid-1997. It is still pending as this book is being published.
Wilderness Designation, Use, and Management
Between 1980 and 1995, public interests prompted congressional wilderness designations that more than doubled the area of national forest wilderness (see fig. 17, chapter 5). Most of these additions had been included in RARE II. Between 1979 and 1984, the designated national forest wilderness area rose by 17 million acres, from 15.1 million to 32.1 million, and the number of units nearly tripled, from 110 to 327, creating a huge challenge for wilderness administration and management. Designations in subsequent years came more slowly. Between 1985 and 1993, national forest wilderness grew by 2.6 million acres, to 34.6 million acres, with 397 units in 38 States. Nearly 93 percent of the wilderness area (32 million acres) was distributed among 254 units in 14 States in the Pacific Coast and Rocky Mountain Regions and Alaska. The remaining 7.4 percent (2.6 million acres) was dispersed among 143 units in 24 States in the eastern and central United States. Wilderness areas constituted 18 percent of the total National Forest System in 1993, 36 percent of the total National Wilderness Preservation System, and 74 percent of the wilderness in the lower 48 States. In 1994, Congress was considering an additional 6 million acres of national forest land for wilderness designation.
Wilderness use grew in the 1980's, but at a slower rate than during the 1970's. RVD use rose from 9.6 million in 1979 to 12.7 million in 1985, and thereafter more or less stabilized at an average of 12.4 million RVD's per year, varying between 11.6 million and 13.3 million per year until 1993.
|
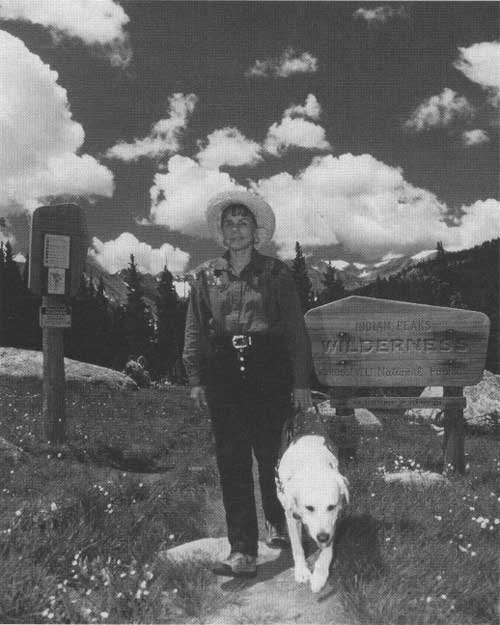
| Hiking along a trail in the Indian Peaks Wilderness on the Arapaho-Roosevelt National Forest, Colorado, 1996. (USDA Forest Service Photo. Taken by Tom Iraci.) |
Management of Wilderness
The rapid expansion of the national forest wilderness acreage and units, along with continued growth in visitor use, particularly in the early 1980's, created a huge new workload to develop action plans and implementation schedules for nearly 300 new wilderness units covering almost 20 million acres. These plans and schedules were designed to ensure quality use and management of wilderness areas in ways that would maintain their quality and character. Wilderness managers' and researchers' knowledge and experience, available technology, and public involvement were used to determine the carrying capacity of the various wilderness units. Monitoring tools and techniques likewise needed to be identified, developed, and implemented to protect the wilderness from unacceptable changes. Wilderness plans also included standards and guidelines for recreation use, wilderness education, trail planning and maintenance, grazing use, fire management, motorized and mechanical equipment use, and other aspects of use and protection specific to each wilderness unit (USDI/USDA 1981-1989).
To handle the expanding workload, wilderness planning and management staffing increased slowly from 174 FTE's in 1979 to 196 FTE's by 1983, and then rapidly doubled to 386 FTE's by 1994 (USDA Forest Service 1994f). By 1994, action plans had been completed for all 397 national forest wilderness units (Thomas 1994).
In 1983, the Forest Service convened a National Wilderness Management Workshop at the University of Idaho. This workshop produced a national guide to provide consistency and direction for improving wilderness management practices — Wilderness Management: A Five-Year Action Program. The workshop was a cooperative effort of citizens, organizations, research and education institutions, State agencies, commercial recreation interests, and others who had a stake in wilderness management. The guidelines developed by the workshop emphasized enlisting the cooperation of wilderness users and interests to improve wilderness management practices.
The general Forest Service management goal for wilderness is to provide for scientific, scenic, educational, conservation, historical, recreational, and other uses consistent with sustaining the natural conditions of the wilderness resource and protecting such wilderness characteristics as solitude and unconfined opportunities for recreation and experiencing natural resources in their primeval state. National forest management activities to protect the wilderness include educating users on wilderness benefits and how to protect them, enforcing regulations established to protect wilderness, rehabilitating damaged areas, maintaining inventory data for wilderness uses and resource conditions, preparing and implementing plans for protecting wilderness quality for the use and appreciation of future generations.
Wilderness Management: 1980-1986
Due to the strong emphasis on recreation use through the 1980's, the actual management of wilderness continued to focus on managing people and their impacts. The greatest challenge was to provide for visitor use while protecting wilderness values and allowing natural ecological processes such as wild\fire to operate freely. Teaching wilderness users about the nature of wilderness and how they could use it and enjoy it without degrading its quality was the principal national forest strategy — educating wilderness users rather than regulating them to protect wilderness quality. It was this "people approach to wilderness management" that generally increased visitors' awareness and sensitivity and persuaded them to care more about the ways that they used and enjoyed the wilderness. National forest managers encouraged and received substantial assistance in their educational efforts from wilderness interest groups, outdoor writers, and outdoor equipment suppliers. National forest wilderness managers also depended increasingly upon volunteers to accomplish the annual workload. Wilderness volunteers grew from less than 100 person-years in 1980 to 178 person-years in 1986, when visitor use began to level off (USDA Forest Service 1981-1987).
Visitors concentrating at the more attractive sites and desirable wilderness locations continued to be a problem. This impacted not only visitor solitude, but also wilderness character and wilderness resources. Such visitor impacts on wilderness have always been highly localized — near trails, streams, lakes, and other forest attractions and the heavily used popular campsites often located near such attractions. The wilderness permit system was a valuable tool for limiting and dispersing such heavy use. In the early 1980's, the Forest Service established an approach called "limits of acceptable change" (LAC) to assess when and where to impose use restrictions. Research began to provide information about site durability and user threshold levels beyond which user impacts would become substantial and difficult to reverse. Such studies helped wilderness managers decide where to encourage camping and other onsite uses and where to discourage them.
The identification of 13 national forests in 1994 as "urban national forests" where urban values, demands, and related uses had become dominant illustrated the intensifying use of wilderness areas observed throughout the 1980's. These forests included the Arapaho-Roosevelt and Pike-San Isabel in Colorado; the Angeles, Cleveland, Los Padres, and San Bernardino in California; the Mt. Baker-Snoqualmie and the Gifford Pinchot in Washington State; the Mt. Hood in Oregon; the Tonto in Arizona; the Wasatch-Cache-Uinta in Utah, Wyoming, and Idaho; the White Mountain in New Hampshire; and the Chatahooche-Oconee in Georgia. These 13 forests included almost 4 million acres of national forest wilderness — more than 10 percent of all national forest wilderness — and were located within 1 hour's travel time of a million or more people. The management environment on these forests as a whole was defined as chaotic, as the managers strived to respond to the expectations of the urban user group while protecting wilderness ecosystems. Urban users placed extremely heavy demands for immediate access to wilderness as well as to highly developed recreation areas, recreational waters, resource education, fire protection, firearm shooting areas, and law enforcement. In 1994, these 13 forests provided 82 million RVD's of use, including wilderness visits — more than a quarter of the total national forest RVD use of 330 million (USDA Forest Service Urban Forest Supervisors 1994).
Despite the growing management effort, reported wilderness violation incidents grew from about 600 per year in 1980 to 1,650 in 1986, and continued to increase thereafter. Most violations were illegal use of motorized vehicles and equipment. Other violations included illegal outfitting and guiding, artifact and fuelwood thefts, camping and pet violations, cultivation of marijuana, destruction of Federal property, failure to abide by permit terms, and vandalism (primarily theft and damage to visitor vehicles at trailheads). Search and rescue missions remained more or less stable at about 300 per year. Fatalities ranged between 30 and 50. The number of serious injuries was much greater. Wilderness managers continued to be highly responsive to search and rescue requests in such emergency situations, even though it was evident that many emergency incidents and occasions of lost wilderness users could have been avoided had the visitors been properly informed or better prepared for wilderness challenges. The public, however, came to expect immediate action, such as helicopter lift-outs or rescue, which intruded into the wilderness environment and the wilderness experience of other wilderness users (USDA Forest Service 1981-1987).
Renewed Efforts To Upgrade Wilderness Management: 1987-1995
In the late 1980's, both the Forest Service and outside wilderness interests became aware that a number of factors were contributing to an inconsistent wilderness management philosophy and shortfalls in wilderness management. Ambiguities in wilderness legislation that permitted nonconforming uses, such as mining and grazing, and wilderness boundaries that were legislatively located next to areas of intensive development were two important sources of such inconsistency. Managers were sometimes uncertain about how such situations should be managed. Most managers were trained or practiced in production objectives, but were not schooled or skilled in a wilderness management philosophy, which was akin to preservation. Most focused their attention on managing wilderness for permitted recreation uses and were responsive to the growing demand for increased wilderness use. Many wilderness managers and users alike lacked a common understanding about what constituted a quality wilderness experience. But there was also a corresponding lack of services and opportunities for acquiring such understanding other than through an extended wilderness experience itself. Limited funding and staffing tended to lead to low priorities for wilderness management and the use of "least cost" or "shortcut" technology to solve wilderness management problems. Different interpretations of wilderness laws among managers, wilderness organization leaders, and politicians likewise contributed to the uncertainty and ambiguity of the wilderness management philosophy (USDA Forest Service Rocky Mountain Region 1989).
To gain a common understanding, acceptance, and support for a consistent wilderness management philosophy and to encourage wilderness managers to apply it on the ground, the Rocky Mountain Region's regional forester encouraged a wilderness philosophy for the region. He enlisted experienced regional wilderness managers and the help of many people with a longstanding interest in and practical knowledge about wilderness — and their organizations, including the American Wilderness Alliance, the Colorado Mountain Club, the Colorado Open Space Council, the National Audubon Society, the University of Iowa, and the Wilderness Society. Working together, they produced and published the Rocky Mountain Region statement on wilderness management philosophy. It focused on wilderness values, uses, users, and management guidelines. Most of these have been incorporated into the Forest Service manual and handbooks (USDA Forest Service Rocky Mountain Region 1989).
Congressman Bruce Vento of Minnesota, Chairman of the Subcommittee on National Parks and Public Lands of the House Committee on Interior and Insular Affairs, spearheaded oversight hearings on national forest wilderness management and a stronger thrust for upgrading wilderness management direction and its consistent application. In March 1989, Vento wrote in a letter to the Chief of the Forest Service that the hearing record was almost unanimous that national forest wilderness management was weak and inadequate and leading to a decline in the quality of its wilderness (Vento 1989). His letter identified the major shortcomings documented in the hearing record and provided 14 recommendations on how to improve national forest wilderness management. These recommendations apparently became the basic guidelines for a major update of the National Forest System wilderness management philosophy and standards — improving the understanding and capabilities of wilderness managers and bringing wilderness management to an equal status with the other National Forest System functional management areas. Congressman Vento's recommendations called for the Chief's commitment and leadership in providing training to wilderness managers and other Forest Service employees on the history, philosophy, and value of wilderness; expanding the wilderness ranger staff; establishing a career ladder for wilderness managers; providing performance standards for all line officers responsible for wilderness management; consolidating wilderness areas fragmented by multiple-use unit boundaries; establishing directors of wilderness in the Washington Office and regional offices to give wilderness an emphasis equal to that of other functional resource divisions; establishing a national public education program on the values of wilderness and its proper use to reduce visitor impacts; and expanding wilderness research in cooperation with other Federal agencies. Vento also requested that the Forest Service report to Congress every 5 years on the condition of national forest wilderness and the restoration of degraded areas. His closing guidance advised the Forest Service to request funding to accomplish these recommendations.
In 1989, the Forest Service's Washington Office enunciated its commitment to manage wilderness as an enduring resource in accordance with the following management principles (USDA Forest Service 1987a): manage wilderness as a distinct resource with inseparable parts; manage the use of other resources and activities within wilderness in a manner compatible with the wilderness resource; allow natural processes to operate freely within wilderness; attain the highest level of priority of wilderness character within legal constraints; preserve wilderness air and water quality; produce human values and benefits while preserving wilderness character; preserve outstanding opportunities for solitude or a primitive, unconfined recreation experience in each wilderness; control and reduce the adverse physical and social impacts of human use in wilderness through education or minimum regulation; favor wilderness-dependent activities when managing wilderness use; exclude the sight, sound, and other tangible evidence of motorized equipment or mechanical transport wherever possible within wilderness; remove existing structures and terminate uses and activities not essential to wilderness management or not provided by law; accomplish necessary wilderness management work with the "minimum tool"; establish specific management objectives, with public involvement, in a management plan for each wilderness; harmonize wilderness and adjacent land management activities; manage wilderness with interdisciplinary scientific skills; and manage special exceptions provided by wilderness legislation (for example, mining, grazing, and access to private lands) with minimum impact in the wilderness resource.
Thus, the problem with wilderness management in the late 1980's was not so much a matter of management objectives and principles, but a lack of consistency in understanding, commitment, and resources for their full implementation. A 1989 study by the U.S. General Accounting Office (GAO) addressed and confirmed these problems in their findings and recommendations (GAO 1989). The GAO report found that the shortfalls and unevenness of wilderness management implementation were generally contributing to some deterioration in wilderness quality and that inadequate funding was a major contributing factor. It also reported that the full extent of the reported deterioration could not be determined because many areas lacked baseline data on wilderness conditions as well as current condition data. Some areas were in relatively good condition, but others often showed deterioration on trails and bridges and around popular camping areas.
Congress addressed the problem of inadequate funding by doubling the national forest wilderness management budget from $13.1 million (constant 1994 dollars) in 1987 to $27.7 million in 1994. This compared with an increase of $4.8 million, or 58 percent, in the preceding 5 years, from $8.3 million in 1979 to $13.1 million in 1987. The Forest Service also took steps to improve its effectiveness and accountability in the use of funds appropriated for wilderness management. However, a 1991 GAO wilderness management study found major weaknesses in the Forest Service's use of and accountability for wilderness management funding (GAO 1991). It found that 37 percent of the wilderness management funding for fiscal years 1988, 1989, and 1990 had been reprogrammed without the approval of the House Committee on Appropriations and that less than two-thirds of the balance was getting down to the ranger district level where the wilderness management practices were implemented on the ground. The Forest Service responded promptly, and by September 1991, before the final GAO report was published, had implemented procedures to ensure that wilderness management funds were being spent as Congress intended, that the reprogramming of funds followed House Appropriations Committee reprogramming guidelines, and that there was greater accountability for the use of funding designated for wilderness management (GAO 1991). The problems of inconsistency in understanding, commitment, and implementation of wilderness management practices were addressed through a strong national training program for all national forest line officers, and more than 500 wilderness managers responded. By 1994, some 400 line officers and 500 wilderness managers had completed the course.
Currently, line officers tend to be more involved in making long-term wilderness decisions. Most national forest regions have provided local training for wilderness rangers (the number of local training programs for wilderness rangers remains limited, but their accomplishments have increased). Wilderness performance standards that reflect the seven goals the Chief identified for rapid wilderness management improvement are in place for all line officers who manage wilderness. They will help unlock managerial creativity and energy and achieve management excellence. The seven goals include integrating wilderness values, principles, and planning systems with ecosystem values, principles, and policies to promote natural, healthy, and diverse wilderness ecosystems. Wilderness ecosystems are visualized as setting an example and standard for the National Forest System's ecosystem approach to national forest management (Thomas 1994).
In 1993, the Forest Service training program for wilderness managers led to the establishment of the National Interagency Training Center and Research Institute for Wilderness Management in Montana. They are named, respectively, after former national forest managers Arthur Carhart and Aldo Leopold, who contributed so much to initiation of dedicated wilderness areas within the National Forest System. Both are staffed and operating, and Department of the Interior wilderness management agencies such as the BLM, the Fish and Wildlife Service, and the National Park Service have been invited to participate in their work.
In 1994, the Forest Service took steps to further strengthen the organizational effectiveness of National Forest System wilderness management. The first step, still pending, was a proposal to establish the Frank Church — River of No Return Wilderness Management Unit, led by a single supervisor reporting directly to one regional forester. This 2.4-million-acre area is the largest national forest wilderness in the lower 48 States and is currently administered by two national forest regions, six national forests, and 12 ranger districts. The consolidation of these multiple units and hierarchical administration into a single wilderness management unit would provide better user services, more effective administrative coordination, improved management consistency across the entire wilderness, lower overhead costs, and, above all, improved opportunities to preserve and manage the multiple units as a single ecosystem. Congress, however, had not yet approved this proposal as of the date of publication of this book.
The second step is the proposed creation of a national wilderness director and staff in the Washington Office that would elevate wilderness to an equal standing with other functional resource staffs such as timber, fish and wildlife, range, and watershed management. The wilderness director position was approved in 1994. As a result of downsizing in 1996, the Chief of the Forest Service has proposed to the Secretary of Agriculture that the wilderness staff be consolidated with the recreation and heritage staffs and that the wilderness director position not be filled. As of the date of publication of this book, the decision memo had been sent to the Secretary of Agriculture and no decision had yet been rendered.
The establishment of wilderness performance standards for regional foresters is the third step for increasing organizational effectiveness for wilderness management (USDA Forest Service 1994c). Thus, in 1996, the Forest Service's role in national forest wilderness management appears to be emerging as guiding light in both the wilderness stewardship movement and the development of an ecosystem approach to the management of natural resources.
Research Natural Areas
A continuing loss of natural landscapes, the wilderness and environmental movements, and the passage of the endangered species legislation during the 1960's and the 1970's gradually raised the awareness of the public, special interests, and the Forest Service that the window of opportunity for protecting examples of pristine natural areas was closing. In 1976, the NFMA requirements for protecting and maintaining biodiversity and for monitoring national forest plan implementation on soil productivity elevated this awareness within the Forest Service and created new incentives for accelerating the pace for establishing RNA's. The NFMA planning process gave special consideration to identifying needed and desirable candidate natural areas. In the 15 years between 1980 and 1995, the number and area of RNA's more than doubled. Their number increased from 129 to 303 and their area grew from over 138,000 acres to more than 300,000 acres. The emphasis on their basic goal intensified: to preserve a representative array of biodiversity within all significant natural ecosystems and, through scientific research and education, compare their components and inherent processes with representative manipulated ecosystems. Thus, RNA's were seen as providing baseline data on ecosystem biodiversity and processes and their performance in the absence of management.
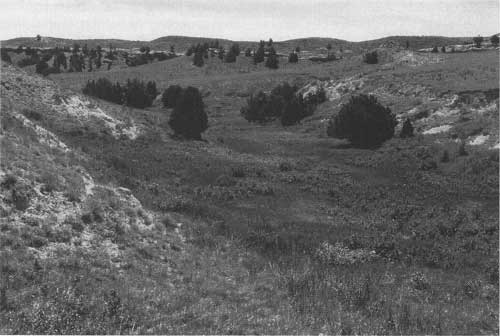
|
| Dave's Draw Research Natural Area, established on the Pawnee National Grasslands, Colorado, in 1995, preserves typical rolling shortgrass and midgrass prairie dissected by high-plains wooded draws — all in excellent condition. (USDA Forest Service Photo. Taken by Tom Andrews.) |
The RNA additions increasingly reflected the National Forest System's biological and ecosystem diversity. New additions focused on aquatic and riparian, shrubland, grassland, subalpine, and alpine ecosystems. Special efforts were also made to add areas representing ecosystems occupied by endangered, threatened, and sensitive species. The Jumpoff RNA (1988) on Utah's Uinta National Forest set aside an area of unusual quaking aspen forest stands and sagebrush grasslands. The Mesita de los Ladrones RNA (1991) on New Mexico's Santa Fe National Forest set aside an area of minimally disturbed pinyon-juniper forest stands. On Arkansas's Ouachita National Forest, the Gap Creek RNA (1990) protected upland headwater stream habitat for the rare paleback darter and the southern ladyslipper growing on its banks, both of which were being reviewed for listing as threatened or endangered species. On Utah's Ashley National Forest, the Sim's Peak Pot Hole RNA (1991) protected excellent wetland, bog, and riparian areas within a mixed conifer forest. The Newaygo Prairie RNA (1988) on Michigan's Huron-Manistee National Forest set aside an area of various native prairie sedges and grasses, especially little and big bluestem.
As the RNA system expanded and national forests turned to an ecosystem approach in managing multiple uses, new questions arose about administering and managing RNA's. To what extent should RNA's be managed to preserve the original natural condition and habitats for endangered, threatened, and sensitive species? Protection from wildfire, for example, was altering habitats previously maintained by fire. Should prescribed fire be used to simulate the natural wildfires that have been excluded from these ecosystems? How should baseline information and the results of any non-manipulative research be effectively linked with the ecosystem approach to national forest management? How does one use the relatively site-specific information (ranging from 40 acres to 10,000 acres provided by RNA's) with the management of ecosystems over tens and hundreds of thousands of acres? These questions are now being asked and addressed by Forest Service researchers and national forest managers to increase the effectiveness of the role of RNA's (Whitmore 1995).
Timber Resource Management
National forest timber resource management experienced its most challenging and difficult years during the 1980's and early 1990's. Administration and congressional policy officials continued to set program and budget goals for timber sales at 11 to 12 bbf per year throughout the 1980's. They also supported timber management programs that included intensive silvicultural practices to maintain timber productivity and ensure that future potential yields would sustain those harvest levels in the long term.
At the same time, the allocation of timber lands to wilderness and other specialized dominant uses and the NFMA requirement that timber lands be limited to those areas suitable for growing and harvesting timber reduced the suitable timber land base from 75 million acres in the late 1970's to 53 million acres in 1993 (USDA Forest Service 1993e; Liggett et al. 1995), concentrating the timber harvest on a smaller land and resource base. Throughout much of the 1970's, this growing concentration raised questions and concerns as to whether existing programmed timber sale and harvest levels could be sustained while meeting the rising demands for nontimber uses and environmental objectives such as biodiversity. By the mid-1980's, the relatively rapid congressional designation of selected RARE II study areas as wilderness on a State-by-State basis tended to ease this situation — releasing nondesignated roadless areas to multiple-use management and excluding their further consideration for wilderness until the next NFMA planning cycle 10 to 15 years hence. However, the release of nondesignated roadless areas seemed to shift the attention of wilderness and related environmental interests from the designation of new wilderness to precluding or delaying timber sale and harvest on the released roadless areas. These efforts focused on forestalling harvest of old-growth timber and centered in the Pacific Northwest. Timber harvest planning, sale preparation, and actual harvest on such lands became increasingly burdened by appeals (table 7), litigation, policy challenges, public demonstrations, and even radically violent actions such as spiking trees planned for harvest, spilling sand into logging equipment motors, and slashing tires, and such nonviolent actions as obstructing logging by tree-sitting and lying down in front of moving logging equipment. In 1985, USDA Assistant Secretary for Natural Resources and the Environment Peter C. Myers expressed the view that despite the designation of 17 million acres of national forest lands for wilderness, for a total of 32.1 million acres, "it is clear that some groups still want even more lands designated as wilderness and are seeking to prevent areas in an unroaded condition from becoming roaded" (Myers 1986).
Despite these challenges, the Forest Service was consistently able to prepare, offer, and sell between 11 and 12 bbf of timber annually throughout the 1980's until 1989. In 1989, timber sales offered fell almost 10 percent short of the congressionally funded target, and timber actually sold declined even more. These declines were primarily attributed to a court injunction concerning the viability of the northern spotted owl population in the Pacific Northwest, its subsequent listing as a threatened species, and the need to protect its habitat, and individual timber sales appeals. Pressure from these sources continued to have an impact on the total level of national forest timber sales offered in the early 1990's and, by 1994, timber sales offered were down to 3.4 bbf and timber actually harvested was down to 4.8 bbf.
The largest part of this reduction related to timber harvest adjustments for wildlife and fish habitat objectives, particularly for protection of the habitats of endangered, threatened, and sensitive species. Inventory volume adjustments, soil and watershed considerations, recreation requirements, and other factors accounted for the balance. About half the reduction occurred in the Pacific Northwest and northern California in response to the Northwest Forest Plan (the spotted owl controversy).
Timber management planning and implementation became increasingly sensitive to NEPA requirements during the 1980's and was dramatically moderated toward the multiple uses in national forest decision making as increased weight was given to nontimber uses such as wilderness, wildlife, and recreation (Hoberg 1993; Wilkinson and Anderson 1987). In 1992, the Forest Service embraced the ecological approach to managing multiple uses on national forests. This step, with the help of extensive public participation, was seen as providing, in time, a more effective basis or framework for resolving the continuing public debate about the proper level and mix of national forest resource uses and their related management. A national hierarchical framework of ecological units was established for classifying and mapping national forest land and resources to provide an ecological basis for data collection, resource analysis, land and resource management planning, and implementation of forest uses and practices (USDA Forest 1991-1995, 1993c; Unger 1993).

|
| Stand examiners measuring and recording tree data on timber inventory sample plot, Deschutes National Forest, Oregon, 1996. (USDA Forest Service Photo. Taken by Tom Iraci.) |
Timber Volume Sold
Total timber volume sold during the 1980's averaged 10.7 bbf per year, slightly less than the 11.0 bbf per year sold during the 1970's decade. In the early 1990's, in response to continuing litigation and action over the spotted owl issue as well as individual appeals, 1994 timber sale offerings declined sharply to 3.4 bbf, below the level of sales and harvest in 1950! Actual volume sold in 1994 dropped even lower — to 3.1 bbf — about the 1945 level of national forest timber supply (see fig. 6, chapter 3).
During the 1990's, the decline was concentrated in the Pacific Southwest and the Pacific Northwest Regions, but all other regions except the Eastern Region also experienced a decline in average annual timber sale levels. Eastern Region timber sales increased to 810 million board feet, 17 percent above the 1980 level (see fig. 14, chapter 4).
Potential for Timber Supply Disruption due to Appeals and Litigation Evaluated
In 1989, it became evident that national forest plan and timber sales appeals and litigation were impairing the National Forest System's ability to meet congressionally programmed targets and budgets. National forest timber actually sold during the 1980's declined slowly, from an average 11.3 bbf in 1979, 1980, and 1981 to an average of 11.1 bbf between 1986 and 1988, then dropped sharply to 8.4 bbf in 1989. The timber harvest for the same years rose from 9.2 bbf to 12.4 bbf. As a consequence, the inventory of sold-but-uncut timber declined steadily during the 1980's. These trends were heavily concentrated in Washington, Oregon, and California, where the spotted owl and old-growth had become a major national issue. The Assistant Secretary of Agriculture for Natural Resources and the Environment, George Dunlop, directed the Forest Service to document this potential disruption of the national timber supply and identify its root causes (Dunlop 1989). The study, "An Analysis of an Emerging Supply Description," completed in June 1990, found that the timber supply under contract to forest product mills that depended on national forest timber had been reduced to an average of 1.6 years, compared with the historical level of 2 to 3 years considered necessary to sustain normal mill operations (Larsen et al. 1990b). This reduction was not seen as critical from a national viewpoint, but it was on the verge of becoming critical for 20 forests with less than 1 year's supply under contract.
Appeals, court decisions, and changes in policy, regulation, and statute had a profound effect in constricting the timber sales volume in the pipeline and under contract. It usually takes 3 to 8 years to initiate, prepare, and offer a timber sale. Increased controversy had raised timber sale preparation costs by 25 to 33 percent and contributed to the loss of many timber sales from the preparation pipeline, thereby, raising the acres needed in some state of sale preparation to meet congressional timber sale targets by 40 to 60 percent. In addition, the continuing controversy and changes in NEPA standards required reworking some 20 to 33 percent of each year's sales, revising or completely redoing many EA's, and revisiting many project decisions. Improving NEPA documentation constituted 70 percent of the increased workload, changing sale unit layouts about 20 percent. (Larsen et al. 1990b).
The timber supply reduction study uncovered a complex of underlying causes for the disruption of the timber sales preparation pipeline and called for several remedial actions: improving the effectiveness of the public participation, including multiparty conflict prevention and mediation, in planning and decisionmaking; increasing the clarity and understanding of the NEPA and NFMA processes and improving their application, and strengthening the Forest Service's responses to appeals and litigation.
This strategy was carried out effectively. It improved the quality of NEPA documents and the success rates in court suits, but did not immediately stem the growth of appeals or litigation.
To reduce the opportunity of appellants to reopen issues already decided, the study recommendations also proposed the revision of the appeals regulations. Postdecision appeals were a special problem because they often involved individuals who had chosen not to participate in the NEPA-generated predecision public involvement process, raised issues that the NEPA procedures did not address, and usually did not include earlier NEPA process participants in the postdecision appeals negotiations.
In 1992, the Forest Service proposed a revision of its administrative appeal process. It chose to limit appeals solely to final decisions approving, revising, or significantly amending national forest land and resource management plans. The proposal's thrust was to expand opportunities for predecisional public involvement in national forest decisionmaking. Its objective was to minimize the impacts of post decision appeals, reduce uncertainties about national forest timber sale offerings, and lower the number and cost of timber sale appeals (USDA Forest Service 1992c). In November 1991, the Senate held hearings on the impact of appeals on national forest timber sale programs and, in 1992, enacted legislation establishing a separate appeals procedure for project-level decisions (U.S. Congress 1992). This legislation did not affect the Forest Service administrative appeals processes for forest plans and regional guides or for permits and authorizations.
The new national forest project-level appeals legislation streamlined the public comment and appeals process, improved predecision information sharing and the opportunity for mediating appeals with the public, shortened the overall time for resolving appeals, and limited appeals to people who had participated in the predecision public involvement and comment process. The final implementing regulations for this process became effective in January 1994. They required that project-specific EA's be made available to for a 30-day public comment period prior to final decision, that national forest managers respond to these comments, and that the final decision be printed in a newspaper.
The public had 45 days to appeal the final decision. National forest managers were to offer to meet with appellants within 15 days of the date of the appeal to attempt to mediate or resolve the appeal issue. The appeal-deciding officer had 45 days from the date of the appeal to render a decision. These new procedures made the regional forester the client for appeals, and depending on the regional forester's decision reduced appeals to the Chief.
In 1994, the first year of operation for the new appeals process, the number of new appeals, excluding those for forest plans, was down to 496, compared with a peak level of 2,631 appeals in 1993 under the previous appeals process. Face-to-face informed appeal resolution meetings led to resolution or partial resolution of 36 appeals. Twenty-four appeals were withdrawn. Fourteen were dismissed for untimeliness, lack of agency authority, or absence of appellant standing. However, 124 appellants on 474 appeals declined to participate in national forest offers for informal disposition meetings. Nine appellants took their appeals to court for resolution. In most cases, the appeals were resolved within the 45-day timeframe provided by the law (Unger 1995).
In 1995, the Forest Service reported that this new appeal process was promoting the open expression of ideas and encouraging the public to join in identifying and analyzing natural resource management options before project-level decisions were made. The improved public input was producing better decisions and contributing to higher quality NEPA decisions.
The Northern Spotted Owl and Old-Growth Management Controversy
Concerns about the adequacy of management for the old-growth habitat needs of the relatively rare northern spotted owl in the Pacific Northwest and northern California — the owl's general range — emerged in the 1970's. The concerns intensified and became controversial in the early 1980's. In the late 1980's and early 1990's, protests, appeals, lawsuits, and court rulings produced a virtual management gridlock. The public debate intensified during those years, and its focus expanded from the old-growth needs of the spotted owl to a concern for all old-growth-dependent species and old-growth ecosystems. Ultimately, the issue led to a drastic reduction of national forest timber sales and harvests in parts of Washington, Oregon, and California.
Concern for the habitat and survival of the northern spotted owl first arose in Oregon in 1972, when researchers observed and reported that the northern spotted owl was most often found in old-growth forests and that timber harvesting was progressively reducing the area of such forests. This concern was shared by the Department of the Interior's Fish and Wildlife Service (FWS) and the BLM and the Oregon Wildlife Commission, who in 1973 formed the Interagency Oregon Endangered Species Task Force to help preclude other species from becoming threatened or endangered in Oregon. The Task Force initially addressed the northern spotted owl and recommended that State and Federal agencies reserve 300 acres of old-growth habitat around each spotted owl site as an interim protection measure. The idea of site-by-site reserves became the model for management guidelines until the late 1980's. At that time, there were 100 known spotted owl sites in Oregon, but both the BLM and the Forest Service deferred such action until a State-wide management goal was established (USDA Forest Service 1993g).
When the ESA was passed in 1973, the northern spotted owl was not included on the Federal list of threatened and endangered species. Therefore, the ESA did not immediately impact the management of the spotted owl's habitat. However, the Oregon Wildlife Commission endorsed its listing as "threatened" on Oregon's threatened and endangered species list — a list that did not have any Federal statutory standing. NFMA regulations, on the other hand, required the maintenance of viable populations of all native vertebrate species in national forest planning areas. This meant that national forest management could not cause the listing of any additional species as threatened or endangered — a stronger requirement than that provided by the ESA, which only called for maintaining individual species. NFMA required maintaining the integrity of species populations and, therefore, their habitats' integrity as well (USDA Forest Service 1993g).
In 1976 and 1977, the Interagency Oregon Endangered Species Task Force recommended a long-term goal to maintain ". . . 400 pairs of spotted owls on public land in Oregon" and the preparation of a plan to reserve habitat management areas supporting clusters of three to six pairs with a minimum of 1,200 acres of contiguous area per pair. A core of at least 300 acres of the oldest available old-growth forest would be included for each pair. Habitat management areas with multiple pairs would be no more than 8 to 12 miles apart (less for single-pair areas). Where pairs of owls within habitat areas were less than a mile apart, core areas for at least two pairs would be included. Several other criteria were also specified in terms of a range of values. The Forest Service's Pacific Northwest Region agreed to implement these spotted owl management guidelines in Oregon through the national forest land and resource management planning process. Its share of the long-term goal was 290 pairs. However, where a range of habitat criteria values had been proposed, only the minimum levels were actually implemented. Even so, it became apparent by 1978 that implementing these guidelines would significantly impact the annual timber harvest on Washington and Oregon national forests. Nevertheless, the region increased its spotted owl surveys and extended them into Washington State national forests and, in 1980, the regional forester directed national forest managers to protect habitat for all confirmed owl pairs in Washington in accord with the Oregon guidelines. In 1981, he raised the goal to 112 pairs for national forests in Washington State. Also in 1981, the Pacific Southwest Region developed regional standards and guidelines for spotted owl management; they largely followed the Oregon model, and implementation began in 1982 under NFMA land management planning procedures (USDA Forest Service 1993g).
In 1981, concerns arising from the continuing harvest of old-growth forests led the U.S. Fish and Wildlife Service to review the northern spotted owl's status. It concluded that this subspecies still did not meet ESA listing requirements. However, its report observed that the owl's dependence on coniferous old growth made it extremely vulnerable, and if old-growth harvest trends continued, the owl could become listed in a short time. In 1982, the Forest Service and BLM established the old-growth wildlife research and development program for western Oregon and Washington, which by 1986 had evolved into the spotted owl research, development and application program and included California. The program generated a variety of studies and numerous reports and publications. The Pacific Northwest Region's final regional guide for national forest planning was issued in 1984. It called for assessing the effects of habitat management areas on 375 owl pairs during the development of Washington and Oregon national forest plans. When the region modified the spacing guidelines between reserved habitat management areas to maintain a more effective distribution of owl populations, its owl target was subsequently increased to 551 pairs. By the end of 1984, a network of spotted owl habitat areas had also been established on national forests in northwestern California and the western Sierra Nevada (USDA Forest Service 1993g).
Late in 1984, the Wilderness Society, in concert with other conservation groups, initiated an administrative appeal of the Pacific Northwest Region's habitat guidelines for the spotted owl. They argued that the guidelines were inadequate and that the decision to the protect the spotted owl's habitat was a major Federal action requiring an EIS. The Chief of the Forest Service denied the appeal, but the Department of Agriculture reversed his ruling and called for a supplemental EIS on the northern spotted owl standards and guidelines. In the same year, a small group of environmental activists in Oregon convened to develop a strategy for achieving ESA listing of the northern spotted owl. They believed there was an adequate scientific basis to do so. However, they also felt that the public's awareness of old-growth forests and their values was so limited that a proposal to list the spotted owl would cause significant political opposition. Their strategizing led them to undertake an educational campaign of talks and organized meetings with newspaper editorial boards and to forge a coalition with groups in Washington State, where there was strong pro-environmental support.
In 1986, a blue ribbon advisory panel, organized by the National Audubon Society in 1985, recommended that additional habitat be maintained to support at least 1,500 pairs of spotted owls in California, Oregon, and Washington. The following year, 1987, the Sierra Club Legal Defense Fund established a Seattle office and entered into a legal strategy to seek an ESA listing for the spotted owl. The strategy included a legal challenge to the BLM's decision to not prepare a supplemental EIS on the spotted owl and a series of legal suits in the Seattle District Court challenging the Pacific Northwest Region's strategy for meeting the NEPA and NFMA requirements for old-growth habitat management for the spotted owl. In the same year, the U.S. Fish and Wildlife Service again reviewed the status of the spotted owl and again ruled that listing was not warranted.
In 1988, environmental interests appealed that decision to the Seattle District Court and won a court order to readdress the listing ruling on the basis that the decision was not biologically determined or sound. The Wildlife Society produced a biological assessment of old growth as a critical and specialized habitat for wildlife and released a position statement that identified old growth as an especially important, but decreasing, wildlife habitat. In this way, wilderness, environmental, and wildlife interests became increasingly involved and focused their efforts on developing the issue for listing the owl as endangered and broadening the issue to include all wildlife species that were dependent on the maintenance and proper management of old-growth ecosystems to sustain their populations (USDA Forest Service 1993g; Hoberg 1993).
The first climax in the northern spotted owl issue occurred in March 1989, when Seattle District Court Judge William Dwyer issued his first injunction on national forest timber sales that involved old-growth timber stands near spotted owl sites in Washington and Oregon. In December 1988, the Forest Service had issued its final supplemental environmental impact statement on the Pacific Northwest Region's guidelines for managing spotted owl habitat. The preferred alternative directed 13 national forests to establish a "spotted owl habitat network" providing old-growth habitat areas for the owl that varied from 1,000 acres per pair in southern Oregon to 3,000 acres per pair on the Olympic Peninsula. The owl habitat was to be located within 1.5 to 2.1 miles of the "core area" for an owl pair. Habitat areas with three or more pairs could be no more than 12 miles apart. For single pairs, habitat areas had to be less than 6 miles apart. The Washington Department of Wildlife, timber interests, and environmental groups promptly appealed the decision for opposing reasons. The Assistant Secretary of Agriculture denied all of these appeals. Environmental groups then successfully sued for an injunction against timber sales in old-growth areas near spotted owl sites (USDA Forest Service 1993g; Hoberg 1993).
Congress, responding to a similar lawsuit on BLM lands, had enacted section 314 of the FY 1988 appropriations bill to exempt BLM timber sales from such litigation. The Dwyer injunction on national forest timber sales escalated the threat of further judicial challenge to timber sales and led the Northwest congressional delegation to recover its control over the issue. It organized the "Timber Summit" with major interest groups to collectively work out a compromise solution — a process that was aborted when the congressional delegation developed its own compromise, known as the Hatfield-Adams Amendment of 1989, and enacted it as section 318, a rider to the Interior Department and Related Agencies Act for FY 1990. Environmental interests strongly opposed the delegation's compromises. The timber industry accepted the compromise, although they would have preferred a more favorable proposal and unsuccessfully offered an alternative providing for a harvest of 4.8 bbf per year for the region. Section 318 declared that the Forest Service supplemental EIS on the regional guidelines for spotted owls and BLM's supplemental management plans for spotted owls were sufficient environmental analysis for preparing timber sales for FY 1990 and, in this way, preempted Judge Dwyer's injunction and other ongoing litigation. It also significantly expanded the acreage of spotted owl habitat areas on national forest and BLM lands and directed the formation of an interagency scientific committee to develop a new spotted owl plan in addition to authorizing the cutting of "ecologically significant" old-growth stands, but only where they were needed to meet the legislatively authorized harvest levels (USDA Forest Service 1993g; Hoberg 1993).
In 1989, the Forest Service, responding to congressional direction, established the interagency scientific committee and charged it with developing a "scientifically credible conservation strategy for the northern spotted owl." The 17-member team was chaired by the Forest Service's Jack Ward Thomas and included representatives from the four Federal agencies concerned with northern spotted owl habitats in Washington, Oregon, and California; environmental interests; the timber industry; and the university community. The committee completed and released A Conservation Strategy for the Northern Spotted Owl in April 1990. It proposed a network of habitat conservation areas (HCA's) that, for the most part, would support 20 or more owl pairs spaced at intervals of 12 miles or less throughout the northern spotted owl's range. Timber harvests were precluded in the HCA's, and the migration routes between such areas were to be managed to disperse owls between them. The strategy provided specific guidelines to ensure that the forest canopy inside and outside the HCA's would be managed to support the northern spotted owl population strategy. The strategy required the reservation of 5.8 million acres of timberland not previously reserved from timber harvesting and became a key "building block" in the development of an ecosystem approach to resource management in the Pacific Northwest (USDA Forest Service 1993g). In June 1990, shortly after the release of the proposed Conservation Strategy, the FWS, following its fourth review of the northern spotted owl's status, listed the northern spotted owl as threatened throughout its range.
Environmental groups responded strongly to the Conservation Strategy under a general theme of the preservation of "ancient forests." They successfully pursued court injunctions for national forest timber sales for noncompliance with section 318 guidelines in the Seattle District Court. In 1990, they succeeded in a suit against section 318 itself. The Ninth Circuit Court of Appeals struck section 318 down as unconstitutional — arguing that Congress had failed to amend the statutes underlying the decision in the litigation that section 318 preempted. This was a severe, but temporary, setback to the Northwest congressional delegation and their strategy for circumventing environmental lawsuits against timber sales. Although the Supreme Court unanimously overturned the Ninth Circuit Court ruling, the efforts of environmental groups to nationalize the spotted owl and old-growth issue were effective in undermining the use of the appropriation rider mechanism to restrict the impact of environmental legislation on national forest old-growth harvests. For example, attorneys general from 17 States and 458 law professors and deans addressed the congressional leadership with letters opposing such restrictions on judicial review. Major national environmental groups, including the Sierra Club, the National Wildlife Federation, and the National Audubon Society, joined the issue. Feature stories and articles appeared in national magazines such as the New Yorker, National Geographic, and Time, placing emphasis on setting aside "ancient forests" that were in decline and located almost entirely on national forests. In these circumstances, the strong jurisdictional concerns and environmental focus of the congressional committees that authorized environmental programs escalated their defense of the environmental statutes that they had written. National public interests in the environment and the spotted owl and ancient forest issue reinforced those concerns. Thus, environmentalists were able to renew their option to sue relentlessly and undermine the regional congressional delegation's use of legislative riders to exclude the planning and management of old-growth harvests on national forests from judicial review (Hoberg 1993).
The Bush Administration, concerned about the proposed Conservation Strategy's economic impacts, appointed a task force led by the Assistant Secretary of Agriculture for Natural Resources and the Environment to review the strategy and find lower cost alternatives. In lieu of any report, the task force issued a press release in September 1990 announcing that Pacific Northwest Region national forests would be managed in a "manner not inconsistent with" the Conservation Strategy proposed by the interagency scientific committee. This decision did not have the benefit of an EIS or a formal statement of adoption in the Federal Register. In the fall of 1990, the Seattle Audubon Society brought suit against the Forest Service for failing to adopt a credible conservation strategy meeting the requirements of ESA, NEMA, and NEPA. During the trial, the economic and social impacts of reducing national forest timber sales in spotted owl habitats were strongly argued. The timber industry, however, joined with the Forest Service attorney and supported the soundness and adequacy of the interagency scientific committee's strategy. The Seattle Audubon Society argued that the strategy was unsound and inadequate. In May 1991, Judge Dwyer decided the suit in favor of the Seattle Audubon Society and ordered the Forest Service to establish standards and guidelines that would ensure the northern spotted owl's viability on national forest lands. He also enjoined further national forest timber sales in northern spotted owl habitat areas until the Forest Service had completed and adopted a plan for complying with NEPA, NFMA, and ESA. The Forest Service was given 10 months to adopt such a plan. In the meantime, timber sales in national forest owl habitats within the owl's range came to a halt (USDA Forest Service 1993f; Hoberg 1993). Total national forest timber volume sold dropped to 6.4 bbf in 1991 and 4.6 bbf in 1992.
The Forest Service returned to the drawing board, as directed by Judge Dwyer's 1991 ruling, prepared a final EIS, released a record of decision in March 1992, and selected a management alternative that was the equivalent of the interagency scientific committee's strategy reflecting the 1990 state-of-the-art and scientific knowledge. In the same month, the Seattle Audubon Society brought suit against the EIS and the record of decision on the basis that, contrary to NEPA requirements, the final EIS had not considered new data for weighing the impact of continued logging on the spotted owl habitat and their populations. Contrary to NFMA requirements, the EIS did not prescribe practices to protect northern spotted owl habitat, nor did it assess the viability of other old-growth-dependent species. Judge Dwyer again ruled in favor of the environmentalists and again enjoined timber sales until a satisfactory plan became available. He found that the Forest Service had not taken into account the latest scientific data indicating that the spotted owl numbers were declining faster than previously determined, nor had the Forest Service and the BLM coordinated — a violation of NEPA.
Judge Dwyer also argued that the EIS had failed to address the viability question for species other than the northern spotted owl, which drastically shifted the objective of the whole process to "planning for the entire biological community" rather than just for the viability of the northern spotted owl populations. Although the Forest Service was justifiably taken aback by this profound shift in the planning objective for the spotted owl EIS, it again returned to the drawing board to do still another, more complex and holistic ecosystem assessment of timber harvesting and resource management to ensure the viability of all old-growth-dependent vertebrate species populations (USDA Forest Service 1993g; Hoberg 1993). The Forest Service named a team of agency scientists and technical experts under the direction of Jack Ward Thomas to develop a new EIS to evaluate the impacts of timber and resource management on all species, including at-risk fish populations associated with old-growth forests, and recommend measures that ensured their viability.
In late 1992, the House Agriculture and Interior Committees considered alternative ways to resolve the multiple-species aspect of the northern spotted owl habitat management issue, but were unable to come up with any substantive legislation that ensured protection of all vertebrate species consistent with the district court ruling and direction. Thus, the Committees proposed no legislation for consideration by the full House. The Bush Administration had examined options to review NFMA's viability regulations in 1991, but could not find a way to overcome NFMA's diversity concept and the legislative history or to ensure that the spotted owl issue would not be redefined in ESA terms. Thus, without any feasible congressional or executive policy options to respond to the spotted owl issue and lift the judicial injunction on national forest timber sales in the Pacific Northwest, northern spotted owl habitat management and the related timber supply problems became a political issue in the 1992 Presidential election (Hoberg 1993). During the Presidential campaign, Bush articulated this politicized issue as a "jobs versus owls" question with a preferred solution that would amend related environmental legislation in favor of maintaining timber supplies and jobs. The Clinton campaign played down "jobs versus environment" as a "false choice" and argued for a "Timber Summit" where the conflicting Pacific Northwest interest groups could jointly work out a compromise solution.
After the 1992 election, President Clinton scheduled a regional "Forest Conference" for April 1993 to convene the stakeholders and resolve the northern spotted owl issue. The shift from "timber" to "forest" was made to cover more ground and more issues. The change from "summit" to "conference" was made to avoid diminishing the importance of an international summit meeting with the Russians immediately following the Forest Conference. The President, the Vice President, and six cabinet officers were the primary conveyors. Neither the Northwest congressional delegation nor the Forest Service were invited to speak. The agenda consisted of a series of panels made up of scientists, environmentalists, loggers, mill owners, local government, American Indian tribal government representatives, union officials, and others. The Forest Conference received national attention. Interest groups each evaluated the issue to reflect their particular viewpoints and achieve their particular ends. Environmentalists focused their views on clean water and salmon habitat restoration objectives in old-growth management, in this way appealing to the more popular environmental objectives. Timber interests emphasized the loss of jobs and related social and community impacts.
The President closed the conference with a commitment to develop a plan that was "scientifically sound, ecologically credible, and legally responsible within the framework of existing language and which would break the gridlock over Federal old-growth management within the range of the northern spotted owl in the Pacific Northwest and California" (Hoberg 1993; FEMAT 1993). He established three interagency working groups to develop the plan: the forest ecosystem management assessment team (FEMAT), the labor and community assessment team, and the agency coordination team.
He directed the FEMAT to develop an ecosystem approach to forest management, including restoring biodiversity for late-successional and old-growth forests, protecting the long-term productivity of these forests, sustaining levels of renewable resource use, and maintaining rural economies and communities. The planning effort was to include a range of alternatives covering a medium to a very high probability of ensuring viable populations of all vertebrate species. The FEMAT's assessment was to receive peer review by properly credentialed reviewers. The FEMAT's report, Forest Ecosystem Management: An Ecological, Economic, and Social Assessment, was published in 1993 as part of a draft supplemental EIS on the range of alternatives to be considered in selecting a management plan for the northern spotted owl.
The President announced his preferred alternative as "option 9." This option provided large areas as habitat reserves to protect and improve northern spotted owl populations and riparian reserves to protect anadromous fishery habitats. The preferred alternative also established a timber sale volume of 1.2 bbf per year, which FEMAT advised was the maximum level legally feasible under the existing laws. The timber industry was stunned by the reduction. Environmentalists, on the other hand, were "outraged" that some timber sales would be permitted in the reserved areas under restrictive conditions. To relieve the jobs and economic impacts of reduced timber sales, the President's plan also included a proposal for a $1.2 billion economic assistance program. An option to include a provision that would preclude further judicial review was also considered, but not adopted.
The Speaker of the House of Representatives, Washington State Congressman Tom Foley, made it clear that Congress could not endorse the preferred alternative and noted that congressional authorizing committees would block any suggestions for revising existing environmental laws (Hoberg 1993). Following the completion of the final supplemental EIS and the release of the record of decision in 1994, USDA and the Department of the Interior jointly adopted option 9 with slight modifications. Option 9 was initially referred to as the "President's plan." This title was later changed to the "Northwest Forest Plan."
When compared with the timber industry's 1989 compromise proposal to the Northwest congressional delegation for spotted owl habitat management that would have permitted a timber sales level of 4.8 bbf per year, the Northwest Forest Plan was an enormous achievement for environmental interests. The plan also expanded forest management focus from maintaining the viability of the spotted owl population to a more holistic ecosystem approach addressing the viability of all vertebrate species' populations dependent upon old-growth habitats. In addition, the Northwest Forest Plan actually came very close to the environmental interest group ideal for preserving most of the remaining old growth on Federal lands within the northern spotted owl's range (Hoberg 1993).
Nevertheless, the Seattle Audubon Society, with 12 other environmental organizations, brought suit against it. The Sierra Club and three other environmental organizations filed separate suits. The environmental complaints contended that the new plan's compliance with environmental laws was still inadequate and sought an order to remand the plan to the agencies for further analysis and an injunction against all or nearly all timber sales in the meantime. The environmental groups also challenged certain procedures used in developing the plan. The Northwest Forest Resources Council, representing timber interests including loggers and mill owners, also brought suit against the plan, on both substantive and procedural issues (U.S. District Court 1994).
Judge Dwyer adjudicated the suits in late December 1994 in the U.S. District Court in Seattle. He upheld the Northwest Forest Plan and the Forest Service's decision to adopt it. He denied various claims by the numerous environmental plaintiffs as well as challenges from the timber industry. He found that Federal agencies had acted within their lawful scope in adopting the Northwest Forest Plan. The question was not a matter of whether the court would have written the same plan, but whether the agencies acted according to the requirements of the law. The answer to that question was "yes." This ruling, if upheld on appeal, marked the first time that the Forest Service and the BLM had worked together to preserve ecosystems common to their lands and manage northern spotted owl habitat forests under a plan ruled lawful by the courts (U.S. District Court 1994). Judge Dwyer also noted that, "Given the current condition of the forests, there is no way the agencies could comply with environmental laws without planning on an ecosystem basis." This seemed to signify that the Forest Service and BLM had sufficient legal authority to apply an ecosystem approach to natural resource management.
Two environmental groups, the Native Forest Council and Save the West, have since filed appeals with the Ninth Circuit Court in San Francisco for relief from Judge Dwyer's decision on substantive grounds. The Northwest Forest Resources Council has also filed suit with the Ninth Circuit Court on procedural grounds. Both suits contribute a note of uncertainty about the finality of the Seattle District Court rulings.
The Below-Cost Timber Sale Issue
As the spotted owl issue unfolded during the late 1970's and early 1980's, environmental interests also began to question the purpose and justification of below-cost timber sales on national forests — sales whose receipts were less than the cost of preparing and administering them. The below-cost timber sale issue focused on the question of whether national forests should be offering timber sales that were prepared primarily for the timber market where their costs exceeded their revenues. The issue was first precipitated by a paper published in Science magazine by Marion Clawson, economist with Resources for the Future (Clawson 1976). He analyzed timber sale receipts and expenditures for each of the national forests and regions and found extreme variances in their profitability. He concluded that many sales were being made in areas where timber values were much too low to yield a net return and "should be abandoned for timber-growing purposes." While such timber stands could be valuable for other uses and worth managing for those uses, he felt that "the growing of timber was not economically sound." Dr. Clawson's analysis led to congressional hearings and to a legislative proposal to ban timber sales where their costs exceeded their revenues. The issue, however, became controversial and generated much confusion in Congress. The Forest Service opposed the proposal. It argued that such sales were justified by the benefits of road access, such as improvements to wildlife habitats and insect, disease, and wildfire control (Wilkinson and Anderson 1986).
The below-cost timber sale issue became quite heated as wilderness and environmental interests pressed it at the national level, especially after 1983, when Congress had largely resolved the RARE II wilderness evaluations and recommendations on a State-by-State basis and released roadless areas for multiple-use management. The issue continued to harass the Forest Service throughout the 1980's. In the 1990's, it abated somewhat as timber sale injunctions and the final approved 1994 Northwest Forest Plan brought national forest timber sales to relatively low levels and contributed to major timber stumpage price increases and a reduced incidence of below-cost timber sales. Nevertheless, in 1994, the Clinton Administration targeted below-cost timber sales as an area for reducing unjustified Government costs.
In 1980, Tom Barlow, working for the Natural Resources Defense Council, compared annual timber receipts for each forest for the 1974 to 1978 period with related timber harvest expenditures. He found that timber stands did not recover the costs of timber management and reforestation on more than half the forests nationally (Barlow et al. 1980). The GAO (1984) and the Congressional Research Service conducted similar studies (Wolf 1984; Beuter 1985). Although these studies used somewhat different data, methods, assumptions, and time periods, their results were similar to Clawson's and Barlow's. In 1985, Robert Repetto, using most of the foregoing study results, identified 74 national forests that consistently offered below-cost timber sales. Of these forests, 45 were located in one of the four Rocky Mountain and Intermountain Regions, 24 were almost evenly divided between the Eastern and Southern Regions, 5 were located in the Pacific Southwest Region, and two were in Alaska. None were identified in the Pacific Northwest Region (Repetto 1985).
In the 1970's and early 1980's, the Forest Service could not determine the exact amount of timber sold at below-cost levels. Nevertheless, Administration policy officials and national forest managers were not insensitive to the below-cost sales issue. The policy direction for the 1980 RPA program, for instance, called for increases in timber supplies from national forests, but constrained such increases to regions where they could be cost-effective. A comparison of the 1975 and 1980 RPA programs reveals that the timber sales projected by the 1980 RPA for 1985 and 1995 were reduced by 20 to 30 percent. The bulk of the 1985 reductions occurred in the Rocky Mountain Regions and Alaska, where the 1975 RPA program had more than doubled timber sale offerings. The 1980 RPA concentrated increases to softwood production in the Pacific Northwest, California, the northern Rockies, and the South, where timber sales increases could be cost-effective (USDA Forest Service 1980a).
In 1985, the Wilderness Society found that 30 out of 55 national forests with consistent below-cost sales had issued draft or final NFMA plans proposing increased sale volumes above those offered between 1979 and 1984 (Emerson 1986). USDA policy officials remanded several forest plans that had proposed major long-term increases in below-cost timber sales. Because the final EIS's and records of decision for those forest plans had not justified the increase in below-cost timber sales, the remand called for their rigorous justification in terms of nontimber benefits or a revision of the plans (Myers 1986).
Below-cost national forest timber sales were justifiable where they effectively served multiple-use purposes other than timber supply. The Ninth Circuit Court of Appeals validated this principle in the Jersey-Jack case in 1985. Environmental interests had sued to enjoin the construction of a logging road into the Jersey-Jack Roadless Area on Idaho's Nez Pence National Forest as a violation RPA's requirement that roads meet needs in an economically and environmentally sound way. The evidence indicated that the road costs would exceed the value of the timber accessed. The Ninth Circuit ruled that RPA did not require that timber road costs be exceeded by the value of the accessed timber. It was reasonable for national forest managers to consider benefits other than timber returns in determining whether the road was economical. The Nez Perce had claimed that the road would produce benefits from motorized recreation, fuelwood gathering, and access to the area by local residents. The proof of such benefits was not questioned because the issue was whether multiple-use benefits could be considered at all, rather than the actual worth of the benefits (Wilkinson and Anderson 1986).
Wilderness supporters and environmentalists generally recognized that below-cost timber sales could contribute benefits to uses other than timber supply. They were not opposed to below-cost timber sales where such benefits were overriding and timber harvesting was the lowest cost method of providing them. However, they also felt there was "a growing body of evidence that many alleged multiple-use benefits of logging did not exist or were simply too uncertain to justify the environmental damage and costly public expenditures required to support below-cost timber sales." Environmentalists and others expressed concern that the Forest Service was significantly overstating the multiple-use benefits of logging. As a result, it was "building too many roads and logging too much land" (Emerson 1986). The general Forest Service response to the below-cost issue was to point out "the fact that: timber sales produce a variety of other resource benefits and many costs are the result of requirements for other resources" (Stout 1995).
Forest Service leadership at the time felt the issue was an effort by a few key interests to protect the remaining unroaded national forest lands for future wilderness designation (Myers 1986; Stout 1995). Unfortunately, the Forest Service did not have the documentation to justify the multiple-use, joint-benefit argument for below-cost sales. As the issue continued to be pressed, it gained a wider following. The Forest Service proposed and discussed a strategy for documenting the multiple-use benefits and cost of below-cost timber sales, but failed to adopt one until Congress directed it to do so in 1985. The House Appropriations Subcommittee on the Interior and Related Agencies decided it was time for the Forest Service and GAO to develop a separate accounting system that would allow the members of the Committee and others to understand the relationship between below-cost timber sale costs and other resource requirements (Liggett et al. 1995; Stout 1995).
The Forest Service established a task force to develop, field test, and evaluate procedures to account for and display timber sale benefits and costs. The final report, presented to Congress in April 1987, included a financial accounting system — based on accrual accounting principles — that documented cash costs and receipts of each individual forest's actual timber sales on an annual basis. A second component, an economic report, estimated the long-term benefits and costs of the annual timber sale program and other multiple uses and reflected the Forest Service's justification for defending below-cost timber sales. A third component, a socioeconomic report, presented the effects of the timber program and annual harvests on community employment and income. These components were collectively referred to as the Timber Sale Program Information and Reporting System (TSPIRS).
TSPIRS became operational in FY 1989. The first TSPIRS report found that 65 out of 123 national forests had timber revenues less than costs and an average harvested volume per forest of 2.0 million board feet. The total volume of below-cost sales made up 16.8 percent of the National Forest System's total timber harvest. For FYs 1990 to 1992, costs exceeded revenues on 66 forests. Their average harvested volume was 1.8 million board feet (USDA Forest Service 1993f, 199Sf).
In 1993, TSPIRS excluded forests with less than 1 million board feet of timber sales or no commercial sales from the below-cost category — dropping below-cost sales forests to 47. In FY 1994, primarily because timber prices had risen 50 percent, in part due to decreased supply caused by timber sale injunctions and harvest declines in the Pacific Northwest, the number of below-cost forests declined to 36. In 1994, average revenues per thousand board feet on the below-cost forests were $112.85, compared with $75.59 in FY 1993.
In FY 1993, the Forest Service Timber Management Division began to report on three different timber sale purpose categories in TSPIRS and in other reports. A timber commodity component included all commercial sales where timber supply was the primary purpose of the sale (USDA Forest Service 1993f). In FY 1994, these made up 67 percent of the total harvested volume. A stewardship component included timber sales designed to achieve primarily ecological and nontimber resource benefits vegetative through management — 26 percent of the total timber harvest. A personal use component — 7 percent of the total harvest — included sales of fuelwood, Christmas trees, ferns, and boughs to individuals for personal use and not for remanufacture or resale.
Some 490,000 families and individuals used this component (USDA Forest Service 199Sf).
In FY 1993, the Clinton Administration asked the Department of Agriculture and the Forest Service to gradually phase out below-cost timber sales. In his address "A Vision of Change for America" on February 17, 1993, President Clinton justified this request:
The Nation can no longer afford subsidies and giveaways to those who don't need them, and we must assure the taxpayer is fairly compensated for services and resources provided by the government.... Timber sales from some national forests do not cover the cost to the Government of making the timber available for sale.
The President's FY 1994 budget proposal included a 4-year phaseout of below-cost sales — an estimated cost savings of $46 million for FY 1994 and $86 million by FY 1998 (USDA Forest Service 1993h). The Department of Agriculture, in a hearing before the Senate Subcommittee on Agricultural Research, Conservation, and Forestry, testified that it was committed to meeting the President's goal, but that the Forest Service would have to proceed slowly in the first year because it had to develop data and information to achieve the goal. That information included the nature and extent of below-cost timber sales and TSPIRS's adequacy to provide such information. TSPIRS was a forest-level information tool on the annual performance of the overall timber program and did not provide data on individual sales. Phasing out below-cost sales would require sorting out individual below-cost sales. Stewardship and personal-use sales would presumably be excluded. The sorting would be limited to commercial timber sales and require both reliable allocation of costs to individual sales and credible prediction of timber sale prices and revenues. It would also involve determining the causes of below-cost sales to evaluate potential cost reductions and increase the efficiency of the overall timber program.
Although there were several 1992 and 1993 congressional hearings on phasing out below-cost sales, including President Clinton's proposal for the FY 1994 budget, no definitive action emerged. The House Appropriations Committee acknowledged the President's proposal in its report and expected that the Forest Service would establish credible rules and procedures for identifying and phasing out below-cost timber sales. The congressional appropriations bill included a "sense of the Congress" statement that such rules be issued at the earliest date possible. The report also advised that such rules provide regional foresters with the flexibility and discretion to make an orderly transition to above-cost status for timber sales, be sensitive to impacts on dependent communities, and minimize economic impacts and community disruption (U.S. House of Representatives 1994a).
The Senate Appropriations Committee in its report further advised that any below-cost phaseout proposal take account of all cost factors that influenced the profitability of the national forest timber sales. It noted that interests opposed to timber sales have no incentive to minimize timber sale costs for environmental standards, archeological protection, and the multiple laws for a wide variety of objectives that drive costs upward — increasing the possibility of below-cost sales. The shift to an ecosystem approach to management may also drive costs upward, but timber values may not increase correspondingly. Thus, the likelihood of below-cost sales rises (U.S. Senate 1994). The conference report advised the Forest Service to continue implementing its efforts to achieve cost savings in its timber program (U.S. House of Representatives 1994b).
Timber Harvests
During the 1980's, despite the interests of wilderness and environmental groups and the growing pressures from appeals, litigation, and demonstrations to reduce national forest timber sales and harvests, the average annual timber sales and harvest nationally were largely sustained. Timber harvests declined sharply in the early 1980's, as housing starts and timber demands responded to double-digit interest rates, averaging 8.3 bbf per year through 1983 (compared to an annual average sales volume of 11.0 bbf). However, as housing and timber demands began to recover in 1984, the harvested volume rose to 12.7 bbf in 1987 and remained at or above 12.0 bbf in 1988 and 1989. As a result, the total timber harvested for the decade was about equal to that sold, 107 bbf (see fig. 15, chapter 5).
In the early 1990's, timber actually harvested declined precipitously, from 10.5 bbf in 1990 to 4.8 bbf in 1994, as injunctions against timber sales in the spotted owl range took hold and the Northwest Forest Plan became effective. An even greater reduction in actual timber sold — from an average of 10.7 bbf per year in the 1980's to less than 3.1 bbf in 1994 — indicated further declines in the regular harvest of standing live timber.
Clearcutting
Clearcutting on national forests declined sharply with the reduction in timber harvest because many of the timber sales and much of the harvest volume carried silvicultural prescriptions for clearcutting old-growth and overmature timber stands and establishing new stands. Between 1978 and 1993, the area clearcut declined from 310,000 acres to 133,000 acres (table 9). Total area harvested rose from a low of 613,000 acres in 1986 to a peak of 904,000 acres in 1990 and then dropped to 732,000 acres in 1993. The percentage of harvested area clearcut dropped even more dramatically — from more than 38 percent in 1986 to 18.4 percent in 1993. The area of timber sold with a clearcutting silvicultural system reveals an even stronger trend away from this practice — a drop of 74 percent, from 329,000 acres in 1986 to 86,000 acres in 1993. However, this sharp decline in planned clearcuts did not set in until after 1988, when the Chief demanded that clearcutting be reduced (Murphy 1994).
Table 9. Trend in clearcutting and total area harvested on national forests, 1984-1993
| Fiscal Year | Clearcutting | Total Area Harvested | ||
| Area Sold | Area Harvested | Thousand Acres | Percent Clearcut | |
| thousand acres | ||||
| 1984 | N/A | 243 | N/A | — |
| 1985 | N/A | 250 | N/A | — |
| 1986 | 329 | 236 | 613 | 38.4 |
| 1987 | 320 | 257 | 673 | 38.2 |
| 1988 | 324 | 283 | 728 | 38.9 |
| 1989 | 248 | 257 | 839 | 30.6 |
| 1990 | 204 | 229 | 904 | 25.4 |
| 1991 | 138 | 187 | 796 | 23.4 |
| 1992 | 95 | 163 | 756 | 21.5 |
| 1993 | 86 | 133 | 732 | 18.4 |
Source: USDA Forest Service 1995g. | ||||
In 1992, when Chief Dale F. Robertson committed the Forest Service to adopt an ecosystem approach for managing multiple uses, he simultaneously announced that clearcutting on national forest lands would be reduced by 70 percent from the 1988 level. Although more than 80 percent of this objective had been accomplished by 1991, it was unclear how much of this achievement was attributable to injunctions on timber sales in the northern spotted owl's range. The Chief's directive called for greater use of individual tree and group selection, green tree retention, seed trees, and other regeneration systems that collectively would provide more visually pleasing and more diverse vegetational conditions on a forest-wide basis. Clearcutting was specifically limited to one or more of the following forest plan objectives or management guidelines: improve wildlife habitat, especially for threatened, endangered, and sensitive species, or improve water yield values and provide for recreation, scenic vistas, utility line and road corridors, facility sites, reservoirs, and similar developments; minimize the occurrence of potentially adverse impacts from insect or disease infestations, windthrow, logging damage, and other factors affecting forest health and to rehabilitate lands actually damaged by such factors; provide for the regeneration and growth of preferred tree species or other vegetative species that are shade intolerant; rehabilitate stands poorly stocked due to past management practices or natural events; or meet research needs.
Road Construction
The direction, criteria, and procedures for selecting road design standards were revised in 1982 to comply more closely to actual forest use needs. The new direction minimized reconstruction of existing roads, reduced road standards, restricted the amount of resurfacing, reduced slash disposal levels on road rights-of-way, and closed some roads when timber sales were completed. The transportation program was also directed to areas where limited road investments were needed in the short term to continue current management and use. This was a partial effort to reduce the double-digit inflation and, in the longer term, to design roads that met forest use standards to reduce long-term road costs — a substantial contributor to below-cost sales (USDA Forest Service 1983). The leveling off and actual decline in national forest recreation use in the mid-1980's helped this effort, as it reduced the pressure for constructing and reconstructing roads for recreation.
Road construction dropped to 8,730 miles in 1982, compared with more than 10,000 miles per year in the preceding 5 years, and continued to drop in the balance of the 1980's to a low level of 5,540 miles in 1989. This progressive decline was facilitated by the near completion of the national forest arterial access system in all regions except the Northern Region. The same was generally true for collector roads, except in the few forests with large unroaded areas where some new road construction was still required (USDA Forest Service 1987b). The typical forest road project in the latter 1980's and early 1990's was the construction and reconstruction of relatively low-standard local roads — single lane, 12 to 14 feet wide, with dirt or gravel surfacing — to provide timber sale access. In future years, many of these roads would be used for the recreation purposes and management of other resources and uses.
As timber harvests declined sharply in the early 1990's, road construction dropped to even lower levels, reaching 3,400 miles in 1993. New construction declined more than reconstruction, from 38 percent of the total miles constructed and reconstructed in 1986 to 24 percent of the total in 1993. Total road system growth slowed accordingly. It rose from about 300,000 miles in 1980 to 343,000 miles in 1985 and increased only 25,000 miles over the next 8 years, to a total of 369,000 miles in 1993. Arterial roads made up about 5 percent of the total road mileage. Collector roads were 20 percent of the total system and linked to local roads — 75 percent of the total road system — within a watershed or timberland to arterial roads.
About 55 percent of the road system was being maintained for use by high-clearance vehicles such as pickup trucks, four-wheel drive vehicles, and logging equipment, and about 25 percent for use by low-clearance passenger cars. The balance, about 20 percent of the roads, was permanently closed to motorized traffic. To prevent undesirable resource impacts, reduce reconstruction and maintenance costs, and avoid unnecessary road damage, roads were closed or restricted to motorized traffic needed to achieve resource management objectives. More specifically, restrictions and closures were used to protect wildlife during migration, mating, birthing, or rearing periods; reduce the risk of wildfires; avoid risks to public safety during periods of high fire danger; protect road investments during inclement weather and unstable road conditions; and protect the public during periods of heavy timber sale activity (USDA Forest Service 1987b).
Those roads no longer needed to manage national forests were being obliterated and revegetated. In 1992, for example, 4,000 miles were obliterated. In the same year, special appropriation language authorized the use of road maintenance funds for this purpose. Often, road obliteration contributed to riparian area restoration, water quality improvement, and wildlife habitat improvement (USDA Forest Service 1993c). In 1993 and 1994, an additional 4,422 miles of roadways were obliterated.
Road Analysis and Display System
In 1986, USDA completed a 10-year analysis (1975 to 1985) of annual cost variability per mile (unit costs) of road engineering, construction, and related support activities among forests and regions (Fedkiw 1986). The results revealed more variation in unit costs than could be explained or understood. To control such costs and evaluate the cost efficiency and consistency of these unit costs, the Forest Service's Engineering Division designed and implemented the Road Analysis and Display System (ROADS) in 1987.
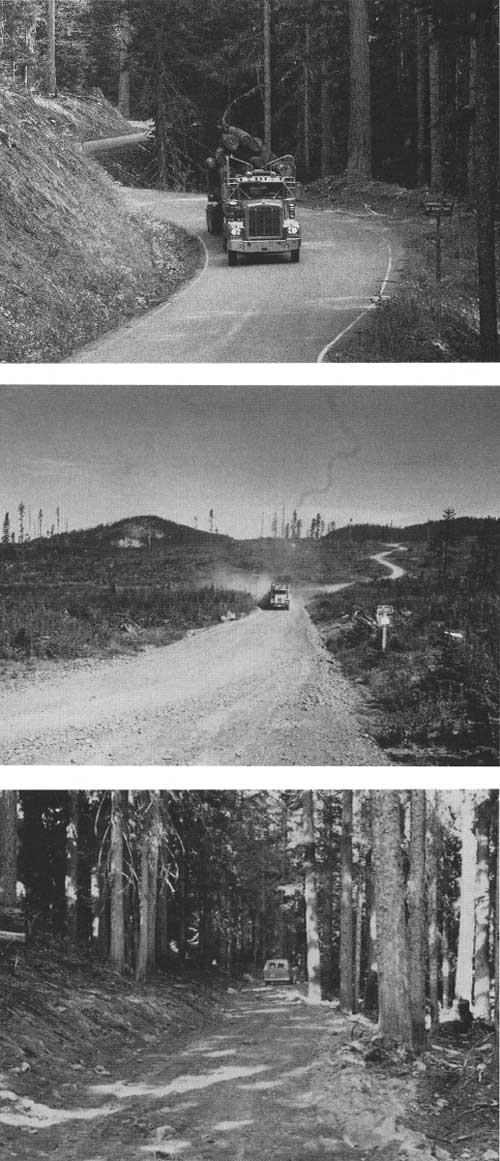
|
| Examples of national forest road design and standards: from top, arterial or high, collector or intermediate, and local or low. (USDA Forest Service Photo.) |
Road design direction was revised in 1982. National forest road system managers successfully reduced road costs by applying less demanding design criteria and standards and more rigorous land use planning for roads. For example, when intensive land use planning revealed that perennial use of new roads was not necessary, the proportion of intermittent-use roads — with lower design standards than roads built for continuous use — was increased. In some regions, intermittent roads were heavily seeded to grasses or other native vegetation to serve as linear wildlife openings. Other improvements included deferring road construction costs by using fewer surfacing materials on new roads in favor of more frequent reconstruction in later years. Costs were transferred to users through the construction of steeper grades, rougher running surfaces, and other cost-saving standards that met projected traffic requirements and environmental and safety considerations. A USDA Office of Inspector General (OIG) audit during 1986 and 1987 found that national forest managers had established reasonable controls over road system design and costs and had made significant progress in reducing them (USDA Forest Service 1988b).
Silvicultural Examinations and Practices
In the 1980's, silvicultural examinations increasingly became the primary means to provide the necessary data for planning site-specific projects such as timber sales, reforestation, and timber stand improvement, and to integrate these practices with other overlapping and complementary uses of the same lands and adjoining areas. In the 1990's, silvicultural examinations were adapted to and became an important tool for fitting timber management practices with the ecosystem approach to forest land and resource management. They now provide data on the existing ecological habitat; tree stand conditions such as age, size, health and vigor; use capabilities; and forest growth and mortality trends for specific use and management areas. The data are used to develop site-specific integrated land and resource management prescriptions that meet forest plan management area direction.
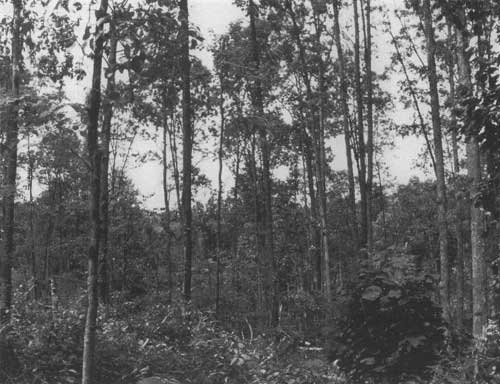
|
| Recently thinned young pole timber in even-aged hardwood management unit, Daniel Boone National Forest, Kentucky, 1991. (USDA Forest Service Photo.) |
Silvicultural examinations were first formally scheduled and reported in 1975, when they covered 4.8 million acres. They achieved a peak level of 9.0 million acres in 1979, when NFMA planning was implemented throughout the National Forest System. They averaged 6.8 million acres per year during the height of the NFMA planning effort, from 1980 to 1985. Thereafter, they dropped to the normal management needs, an average of 5.2 million acres per year. In 1993 and 1994, as timber sales and harvests were reduced to their lowest levels in modern times, silvicultural examinations declined to 2.5 million acres per year (USDA Forest Service 1994f).
Reforestation
Reforestation practices include planting, seeding, and natural regeneration with or without site preparation. The acres reforested declined from 434,000 acres in 1980 to 370,000 in 1985 — the year the Forest Service reported that it had eliminated the national forest regeneration backlog. The initial backlog in the 1970's was estimated to be 3.1 million acres. In the decade between 1975 and 1985, a total of about 1 million acres of the backlog were successfully reforested or seeded; 700,000 acres were examined and found to be satisfactorily stocked and not in need of reforestation; another 1 million acres were withdrawn due to changes in land use classification such as wilderness designation; 200,000 acres were allocated for multiple-use purposes such as retention of wildlife forage areas; and 100,000 acres were withdrawn for other reasons, such as land exchanges (USDA Forest Service 1985). During the 5 years between 1980 and 1984, an average of 87 percent of all regeneration treatments successfully met stocking objectives. In 1993, the average percentage of success 3 years after planting rose to 90 percent (USDA Forest Service 1985, 1994e).
At the close of 1985, 820,000 acres needed regeneration — representing a normal 2-year reforestation level at the early 1980's average. (It usually takes 2 years of lead time to prepare a site and grow seedlings adapted to it.) After 1985, reforestation needs rose sharply, to a peak of 1.2 million acres in 1990 as timber harvest escalated to near record levels and wildfires between 1987 and 1989 caused extreme fire damage in the western regions. Stand losses from a 1988 Utah bark beetle outbreak also contributed to this acceleration. The acres actually reforested between 1989 and 1992 reached a historic peak of nearly 500,000 acres per year. In 1993, only 441,000 acres were reforested, and in 1994 reforestation dropped to a more normal level of 300,000 acres as timber harvest levels were reduced and the area damaged by wildfire was reforested.
Annual seedling production at national forest nurseries rose from an average of 118 million seedlings per year in the latter 1970's to 136 million per year as the national forests worked to reduce the reforestation backlog. Seedling production dropped to an average of 122 million per year from 1986, after the backlog reforestation was completed, to 1994, except for 1990 and 1991, when seedling production averaged 134 million per year to meet the increased reforestation needs due to increased timber harvest acreage and extensive wildfire damage in the late 1980's.
Timber Stand Improvement
In 1980, timber stand improvement opportunities were estimated to be 1.7 million acres. This total was reduced to 1.25 million acres by 1991 as the area treated each year — an average of 375,000 acres per year — equaled or exceeded the accumulation of new opportunities. Between 1991 and 1994, timber stand improvement treatments fell to 264,000 acres per year. By the end of 1994, because new needs increased more than treatments, the total timber stand improvement opportunities rose to 1.4 million acres (USDA Forest Service 1995c). Precommercial thinnings, mainly in coniferous plantations, made up 60 percent of these treatments. Release and weeding constituted 30 percent, fertilization 8 percent, and pruning 2 percent.
Forest Growth, Mortality and Potential Yield Trends
Net annual national forest timber growth continued to increase, as it had since 1952 and before (fig. 25). It reached a peak level of 3.4 billion cubic feet per year in 1986 and then declined slightly, by 3.2 percent, to 3.3 billion cubic feet per year by 1991. This slight decline largely reflects increased mortality rather than actual growth decline after 1986. National forest timber mortality reached a low point of 1.01 billion cubic feet per year in 1976 and then began to increase to 1.05 billion cubic feet per year in 1986 and 1.20 billion cubic feet per year in 1991 indicating an accelerating increase. National forest timber harvests in 1991 were 2.0 billion cubic feet — less than 59 percent of the net growth. The sharp decline in timber sales and harvests in the early 1990's signaled a continuing rise in mortality and further decreases in net growth. These trends do not contribute to the improvement of overall forest health, which has become a new public issue in recent years. The national patterns are similar for softwoods and hardwoods (Powell et al. 1993; Waddell et al. 1989).

|
| Figure 25. National forest timber growth, harvest, and mortality, 1952-1991. Source: USDA Forest Service; Waddell et al. 1989; Powell et al. 1993. |
Regional patterns for timber growth and mortality are similar to the general national pattern for all national forest regions except those on the Pacific Coast, including Alaska. Net timber growth, primarily softwoods, continued to increase in the latter regions to a peak of 1.1 billion cubic feet per year in 1991, while mortality continued to decline to a low 400 million cubic feet per year as the old growth was increasingly harvested. National forest timber harvests in the Pacific Coast regions were just equal to the net growth of 1.1 billion cubic feet per year. With the major reduction of old-growth Pacific Coast timber harvests in 1991, this balance of net growth, mortality, and harvests is likely to involve increased mortality and slower net growth in future years. Increased wildfire losses can also be expected.
The long-term sustained-yield capacity (LTSYC) for timber harvest on national forests is estimated to be 12.16 bbf per year. The LTSYC is the estimated annual net forest growth for a fully managed national forest condition with current management intensity and practices. This is reflected in forest plans for all regions except the Pacific Northwest Region, where LTSYC is based on the Final Supplemental EIS on Management of Habitat for Late-Successional and Old Growth Forest Related Species within the Range of the Northern Spotted Owl. Table 10 shows the distribution of the LTSYC by national forest regions. The comparison of LTSYC with the estimated current allowable sale quantity (ASQ) — 7.56 bbf — indicates that the current ASQ is well below the growing capacity (potential yields) of a fully managed condition of national forests, with today's management intensity in every national forest region.
Table 10. National Forest System long-term sustained-yield allowable sale quantity by region, 1994.
capacity and| Region | Long-term Sustained Region Yield Capacity (LTSYC) |
Allowable Sale Quantity (ASQ) |
ASQ as a Percent of LTSYC |
| (billion board feet) | |||
| Northern | 1.99 | 1.12 | .56 |
| Rocky Mountain | 0.79 | .44 | .56 |
| Southwest | 0.85 | .44 | .52 |
| Intermountain | 0.65 | .39 | .60 |
| Pacific Southwest | 1.43 | 1.12 | .78 |
| Pacific Northwest | 1.63 | 1.38 | .85 |
| Southern | 2.56 | 1.34 | .52 |
| Eastern | 1.52 | .87 | .59 |
| Alaska | 0.72 | .47 | .65 |
| Total | 12.16 | 7.56 | .62 |
Source: USDA Forest Service Timber Management Staff. | |||
Pest Management and Forest Health
State and Private Forestry continued to lead national forest pest management activities and directly coordinate cooperative pest management activities with other ownerships that shared common pest problems with the national forests. During the 1980's and early 1990's, pest detection and evaluation surveys were conducted on a relatively stable average area of 120 million acres each year. Pest outbreak prevention and suppression activities continued to be conducted on only the highest priority areas, which varied from 500,000 to 1.5 million acres per year — less than 1 percent of the national forest lands. An even smaller area was treated with insecticides or fungicides, about 550,000 acres per year between 1980 and 1988 and then less than 200,000 acres per year between 1989 and 1992. This sharp drop in pesticide use resulted directly from the 1988 forest health strategic plan.
The 1988 forest health plan recommended increased forest-level staffing for pest monitoring, detection, and evaluation; improved support and decision systems for integrated pest management; and increased emphasis on maintaining and restoring forest health through silvicultural management and practices, including integrated pest management (IPM) — the decisionmaking and action process for incorporating biological, economic, and environmental evaluation of pest-host systems to manage pest populations (USDA Forest Service 1981-1995; 1988a).
The 1992 Forest Health Strategic Plan
Another forest health strategic plan was prepared in 1992 as a direct response to five 1992 congressional hearings that focused on the health of western forests that had been altered by successful fire control and other practices and were now being severely damaged by drought, pest epidemics, and wildfires. Congress wanted to know and asked how forests so damaged could be restored and how similar future damage could be prevented (USDA Forest Service 1993b; 1994b). The Forest Service established a forest health steering committee and task team to respond to this request. In addition to National Forest System, Research, and State and Private Forestry experts, it included several State foresters and one State entomologist. The 1992 Forest health strategic plan, which was published in 1993, built on the background of the 1988 plan and linked forest health with the ecosystem approach to management. It recognized that outbreaks of some natural pests were exceeding historic levels — often due to past management practices, including wildfire suppression, which had created favorable conditions for pest populations. It also recognized the linkage between pest outbreaks and fuel buildups and the increasing intensity of wildfires.
The 1988 forest health plan cited the following factors that contributed to more destructive pest outbreaks: stand ages exceeding the existing tree species entomological and pathological rotation ages, planting and regenerating disease-prone varieties in areas where the same disease is known to occur, letting stand densities increase, planting or naturally regenerating extensive monocultures, failing to remove infected overstory trees during timber harvest, and failing to provide a substitute for the forest mosaic created by uncontrolled natural wild fires (USDA Forest Service 1988a).
The eight components of the 1988 forest health plan were decentralizing pest management to the forest level to work more directly with resource managers in developing and implementing forest plans, effective public communication and involvement, the role of integrated pest management, funding for pest suppression, environmental analyses of pest-host interactions, availability of acceptable pesticides, the development of new technology, and forest health monitoring.
The four new components proposed by the 1992 plan were restoring forest health in the ecosystem management framework, managing introduced pests, excluding exotic pests, and providing for international cooperation in forest health protection. The 1992 plan identified the desired state of forest health as a condition where natural and nonnatural influences such as pests, atmospheric deposition, silvicultural treatments, and harvest practices do not threaten long-term resource management objectives. This linkage integrates forest health directly into national forest land and resource management plans.
Western Forest Health Initiative
In September 1994, Chief Jack Ward Thomas chartered a western forest health initiative team to identify approaches to restore western forested ecosystem health. The team addressed all forested western lands — national forests, industrial, non-industrial private, and other public lands. It gathered and evaluated forest health management project information from all 92 western national forests, 16 States, all research facilities, and tribal governments. This evaluation found that not all forests were threatened by insects or disease, nor were they all in immediate risk of catastrophic change by fire. However, forest health problems were widespread and all could not be immediately addressed on all lands. The practical approach was to treat those landscape segments that were most at risk to fire, insect, and disease damage and to ensure the fullest protection of the landscape, especially in those areas with the highest risk of habitat loss to threatened, endangered, and sensitive species population recovery. The team identified three hazard reduction categories: areas of potential catastrophic loss of key ecosystem structure, composition, and processes; areas requiring restoration of critical ecosystem processes; and stressed sites in need of rehabilitation (USDA Forest Service 1994b).
In 1994, in response to this assessment, western forest managers scheduled the implementation of 335 high-priority forest health projects. By 1995, 64 of these projects had been completed; 248 were expected to continue, with completion dates extending from 1996 to 2000; and 23 were withdrawn due to lack of funds or excessive deterioration of salvageable, fire-damaged timber (USDA Forest Service 1996a). The total area of the projects covered 2 million acres. Individual projects ranged from less than 500 acres to more than 150,000 acres — about a third were less than 500 acres. The average project size was almost 6,000 acres. Projects involving timber management, primarily reforestation (34 percent); fuel management (16 percent); habitat management (6 percent); watershed improvement (4 percent); range improvement (2 percent); various combinations of management activities (37 percent); and other (1 percent) were implemented. In addition, national forest managers also began implementing some 40 western forest health initiative team recommendations to restructure existing procedures that could prevent timely and effective responses to forest health problems. These recommendations called for improving communication and coordination with related internal Forest Service interests and external organizations, increasing the flexibility of budget and program planning, and changing existing laws or obtaining new legislation on matters affecting national forest management.
In 1994, the national forest land ethic incorporated the objective for sustaining healthy ecosystems: "Management of the national forests to meet human needs while maintaining the health, diversity, and productivity of ecosystems." Chief Thomas declared "ensuring ecosystem health as a foundation for all life, a concept that builds on Leopold's definition of land health as a vigorous state of self-renewal a first priority in managing national forests for multiple uses" (Thomas 1995; USDA Forest Service 1994d).
Exotic Pests and Log Imports
The discovery of three new exotic forest pests — the Asian gypsy moth, the common European shoot beetle, and Eurasian poplar leaf rust — in the United States in 1991 and 1992 and the recent industrial expansion of log imports from foreign lands elevated risks for protecting the Nation's forest health. The United States has typically not been a big importer of logs. However, domestic log supply reduction on the West Coast opened its markets for timber imports. Pest assessments for larch logs from the Russian Far East, Monterey pine from New Zealand, and Monterey pine and native hardwoods from Chile revealed a serious risk of introducing damaging new pests to U.S. forests. (Fowler 1996).
The far eastern Russia risk assessment revealed the threat of the Asian gypsy moth. It is a greater threat to North American forests than the established European gypsy moth. The Asian gypsy moth feeds on a larger number of hosts and can disperse more quickly because the females can fly. The first Asian gypsy moth infestations on the West Coast were located near the ports of Portland, Oregon, and Tacoma, Washington. These infestations have been eradicated, but the fact that the moth came into the country aboard Russian grain ships elevates concerns and risks. The United States and Russia have developed a monitoring and inspection program to reduce the chance of future introductions. (Fowler 1996).
Vegetation and Animal Control
The Forest Service reduced herbicide use to control unwanted vegetation on rights-of-way and forest and range management areas by 50 percent, to less than 120,000 acres. The use of chemicals for animal damage control was reduced from 115,000 acres in 1983 to less than 7,000 acres by 1992 (USDA Forest Service 1981-1995).
Fire and Fuel Management
Wildfire damage during the early 1980's was below average. Between 1980 and 1984, the average annual burn was 118,644 acres — less than 1 percent of the total National Forest System. Favorable weather and soil moisture conditions which were not conducive to wildfire ignition or spread were important contributors. The most dramatic fire event was the Mount St. Helens eruption in 1980 and the fires it ignited. National forest managers were faced with a unique problem of keeping fires from moving out of the devastated area and protecting the health and safety of firefighters in the hazard zones. A comprehensive action plan and command center for directing and coordinating the firefighting teams helped suppress the wildfires. (USDA Forest Service 1981b).
During the first half of the 1980's, the average annual number of fires reported on national forest lands was 9,000. Nationwide, half were lightning-caused and half were human-caused. However, the ratio between human- and lightning-caused fires differed enormously between the western national forests, where 80 percent were lightning-caused, and the southern national forests, where 80 percent were human-caused. Among the human-caused fires, arson was the most frequent cause, at 32 percent; campfires caused 21 percent; and smoking, 11 percent. Various other human causes, each at 9 percent or less, accounted for the remaining 36 percent.
As directed by Congress in 1978, the Forest Service undertook a comprehensive analysis of national forest fire management policy and implementation strategies to develop an economic model for planning fire management. The model, completed in 1980, compared alternative wildfire responses for each national forest with the corresponding sum of the estimated suppression costs and the value of natural resources lost to those fires. The optimum response strategy and fire management budget level was the one that produced the lowest sum of costs plus resource losses. This planning system, the National Fire Management Analysis System (NFMAS), was first used in 1981 to allocate a $174 million budget for fire management. Some forests received higher budget allocations, some received lower than their traditional allocations, and others received about the same. Each year's experience has been added to the model's database to improve its performance over time.
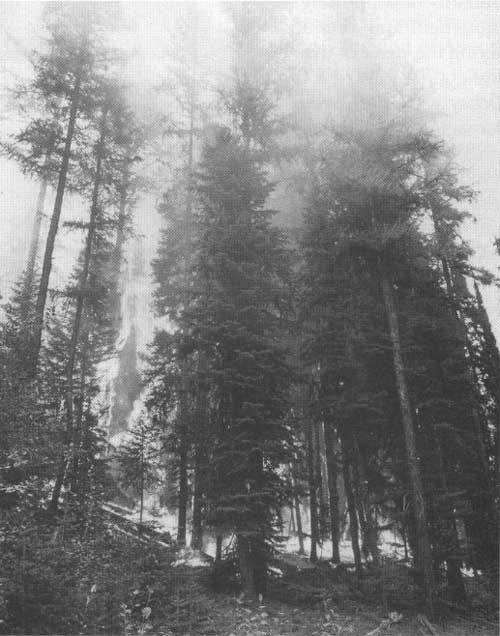
|
| Severe wildfire damage associated with heavy fuels, Colville National Forest, Washington, 1988. (USDA Forest Service Photo. Taken by Y. Yee.) |
The National Interagency Incident Management System (NIIMS), which uses an incident command organization, interagency coordination and communications, and a terminology common to all wildland firefighting agencies, continued to be implemented during the early 1980's. It uses the most cost-effective firefighting resources for each situation, regardless of agency jurisdiction. It was, and still is, used to manage larger wildfires and produces substantial savings. The Forest Service led the development of NIIMS by providing training and guidance for participating agencies and by transferring NIIMS technology to wildfire fighting, search and rescue efforts, hurricane disaster relief, law enforcement, and planning for other natural disasters (USDA Forest Service 1986). The NIIMS system has also been successfully used in plane crashes and is now being used internationally as part of International Forestry's disaster assistance support program.
In 1984, despite the extensive lightning activity and ignitions, the total area burned on national forests was very low, less than 99,000 acres, and the smokejumper program achieved the historic mark of 100,000 jumps. During the 1984 fire season, national forests fully used smokejumper capability to respond to major lightning-caused wildfires throughout the Pacific Northwest. In the same season national forest managers monitored 65 lightning-caused prescribed wilderness fires.
Wildfires Worsen After 1984
The 1985 fire season was the worst experienced nationwide, particularly in the South and West, since 1934 and ushered in 5 more years of extreme drought in the West and even more severe fire seasons. The overall fire situation required a massive response from all parts of the Nation and set a record for interagency mobilization of people and equipment. The National Interagency Fire Coordination Center (NIFC) in Boise, Idaho, moved more people and resources over a broader geographical area in the shortest time period in its 20-year history. More than 17,000 firefighters were mobilized at one time. The national forest area burned totaled 463,950 acres. The 1985 fire season in many ways was a fortuitous experience in firefighting logistic, for there were far worse seasons to come in 1987 and 1988 (USDA Forest Service 1986).
The 1986 national wildfire season was another severe one, but the area burned was less than 295,000 acres. The 1987 fire season, particularly the "Fires of September," became the most destructive national forest fire season since 1929, burning more than 1,066,000 acres. Rainfall 25 percent below normal created extremely dangerous burning conditions in northern California and southwest Oregon. In late August and September, more than 11,000 lightning strikes ignited 1,900 fires — a ratio of one fire for every six lightning strikes compared with a typical ratio of one fire per 100 strikes. NIFC mobilized more than 25,000 people and record amounts of supporting equipment and aircraft during the peak of the firefighting. Almost 3 bbf of timber were destroyed, damaging wildlife habitats, range forage, visual resources, and cultural resources. In some situations, suppression forces had to be shifted from protecting national forest resources to protecting human life and developed property. Tragically, 12 firefighters lost their lives. (USDA Forest Service 1988b).
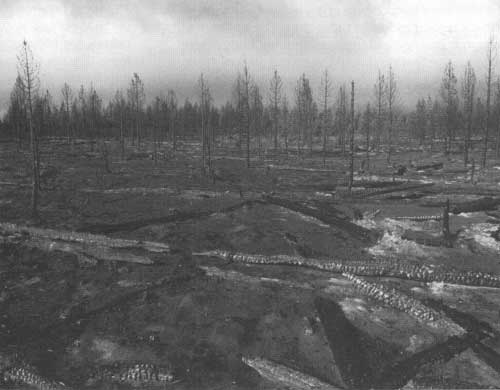
|
| A very hot, intense fire through a stand of mature timber destroyed ground cover and damaged soil on the West Yellowstone Ranger District, Montana, during the 1988 West Yellowstone Area Conflagration. (USDA Forest Service Photo. Taken by Don Nichols.) |
Efforts to rehabilitate damaged watersheds began as soon as the fires were controlled. Thousands of acres were seeded to grass to prevent erosion, 105 miles of stream channels were cleared, and erosion control structures were installed on damaged watershed sites to stabilize soil and protect downstream water uses. Several hundred culverts were installed to improve drainage on nearly 2,000 miles of road to avoid erosion. Trees were felled on the contour on more than 4,000 acres of damaged watershed areas to check erosion.
The 1988 season continued the extreme fire activity that began in August 1987. Continuing severe drought created an extremely high fire potential throughout the western United States. National forests experienced more than 11,000 fires that burned nearly 1.5 million acres — a level not exceeded since 1919, when 2 million national forest acres were burned. More than 41,000 fire personnel were mobilized in 1988, including trained crews from 39 States and Canada. Some 5,600 military personnel and 4,000 emergency firefighters were also trained and mobilized. Ninety percent of all fire starts on national forests were suppressed at 10 acres or less as a direct result of planned and available fire protection forces.
The most intensive fire situation developed in the Greater Yellowstone Area — mainly inside Yellowstone National Park. A combination of severe drought, natural fuel accumulations, and insect-killed trees created extreme fire behavior conditions with high rates of spread. Strong ember-carrying winds started new fires. Intense fires completely consumed fuels and threatened several communities. National forest firefighting forces played a major role in suppressing eight major fires covering more than 1.1 million acres in Yellowstone National Park and 566,600 acres of national forest outside Yellowstone (USDA Forest Service 1989c).
The severity of the 1988 fire season — particularly the fact that several wildfires that began as natural fires had been allowed to burn in national forest wilderness areas and in Yellowstone — led the Secretaries of Agriculture and the Interior to review the wilderness "let burn" fire management policy. Wilderness fire policy became a major public issue. The review improved coordination among the Forest Service, Department of the Interior agencies, and the National Association of State Foresters and communication with the public. It endorsed the existing prescribed natural wildfire policy and recommended preparing regional and national contingency plans to constrain natural fires under extreme burning conditions and planned ignitions to supplement natural prescribed fires in reducing heavy hazardous fuel accumulations (USDA Forest Service 1990b).
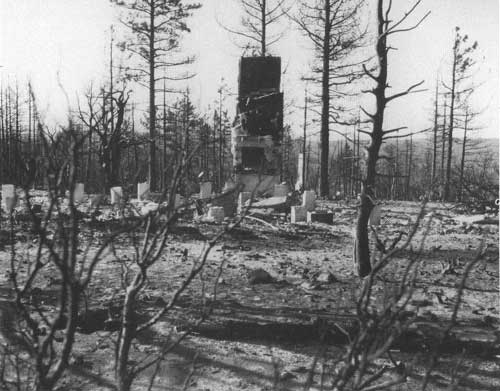
|
| Residence destroyed by intense wildfires. Los Padres National Forest, California, 1990. (USDA Forest Service Photo. Taken by Y. Yee.) |
1989 was another droughty year. National forests prepared contingency plans for areas with extreme fire risks; provided supplemental funding for early emergency fire planning, training, and firefighting equipment; increased tools and equipment in all fire caches; and accelerated contracts for aircraft, fire retardant chemicals, caterers, shower units, and other suppression resources. In 1989, western national forests had 6 percent fewer wildfires. Most were ignited by lightning. Advanced preparation and rapid mobilization kept these fires small, and favorable weather closed the fire season by the end of August. The area burned was 424,000 acres.
An improved version of the NFMAS was introduced in 1990. It determined the most efficient fire management organization as one that minimized the sum of presuppression costs, suppression costs, and resource losses. This improved the allocation of fire management budgets and increased fire management efficiency at the national forest level.
From 1990 to 1993, drought conditions persisted — with some abatement in 1991, when only 143,000 acres burned, and in 1993, when a return of moist weather conditions kept the burn to 239,000 acres. Even so, the average annual area burned was 310,000 acres, 1.7 times the average burn in the 40 years between 1945 and 1984, before the conflagrations of the late 1980's. National incident management teams were dispatched to 20 major fires on national forests in 1990 and 26 in 1992. Six firefighters lost their lives on Arizona's Tonto National Forest in 1990 when wildfire overran their crew. It became clear in these years that fuel buildup on national forests needed special attention and could only get worse in future years. (USDA Forest Service 1991-1995).
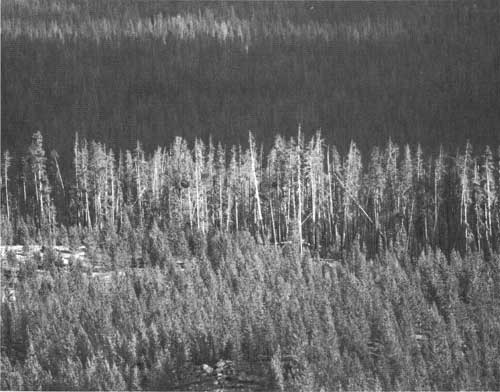
|
| Heavy fuel (middle ground) of beetle-killed lodgepole old-growth, green old-growth in background, and young lodgepole regeneration with low fuel buildup in the foreground, Gallatin National Forest, 1980. The area largely escaped the 1988 Yellowstone fires except for a fringe of intense burn in the foreground. (USDA Forest Service Photo. Taken by Ron Nichols.) |
The most severe and damaging wildfire season on national forests in recent times came in 1994. More than 14,400 fires were fought on almost 1.5 million acres. Forty-nine States supported national forest suppression efforts by supplying firefighting crews. The military provided more than 4,000 troops. More than 100 major fires were suppressed in the six western national forest regions. At the peak of the firefighting activity in August, more than 25,000 firefighters were assigned to fires at one time. Large fire-damaged areas accompanied the tragic loss of 28 lives across the West (USDA Forest Service 1995d). National forest fire management expenditures in 1994 reached a recordbreaking total of nearly $1 billion. These extraordinary costs became a special concern to policy officials because real dollar expenditures (after inflation) for national forest fire suppression had not increased since 1970 (Bell et al. 1995).
Fuel Management
During most of the 1980's and early 1990's, fuels were reduced on about 950,000 acres pen year. This effort included three components: the direct fuel management program, timber sale brush disposal, and the prescribed burns and mechanical fuel reductions for range and wildlife habitat improvements. On average, each component made up about a third of the total average annual achievement. Brush disposal declined from 352,000 acres to 225,000 acres as national forest timber harvests were reduced in the early 1990's. In the same period, the directly funded fuel management program increased from 347,000 acres to 385,000 acres — it had previously averaged less than 300,000 acres per year.
The directly funded program's focus was to reduce the inflammable material buildup on forest floors in areas with a history of large, costly, and destructive fires and the potential for the recurrence of such fires. Brush disposal and the prescribed fires and mechanical biomass reductions for wildlife habitat and range improvement supplemented the direct program's achievements. However, the western forest fires between 1986 and 1992 made it obvious that the scale of such efforts was not matching the scale of the national forest fuel hazard problem.
The 1987 "Fires of September" demonstrated that fire crews could directly attack wildfires and contain them in areas that had received intensive fuel treatment. However, direct attack was not an option on areas that had not had intensive fuel treatments. The combination of high fuel loadings and extremely dry weather caused high spread rates, high fire intensities, and dangerous fire behavior — conditions too dangerous for fire crews to attack directly. The fire experiences of 1987 to 1992 made it clear that with current fuel management treatment levels, it would take many, many more years to make wildfires easier to control (USDA Forest Service 1992b).
In 1994, Chief Jack Ward Thomas, alerted by the disastrous loss of life, resources, and costs in fighting wildfires in that year and the preceding decade, asked for a Forest Service assessment of its fire management strategy (USDA Forest Service 1995h). That report basically recommended shifting fire management away from its traditional focus on control and suppression to become a working tool in the ecosystem approach to management, establishing cooperative agreements for fighting wildfires on the wildland-urban interface, and improving leadership's ability and workforce capabilities to respond to wildfires.
Two studies elaborated on these broad recommendations (USDA Forest Service 1995b; Bell et al. 1995). They reported that timber cutting, domestic livestock grazing, insect control, and prolonged absence of periodic low-intensity burning had resulted in changes in species composition and stand structure that had disposed about 39 million acres of fire-adapted forests to insect and disease attacks and severe stand-replacement wildfires. Both studies recommended increasing mechanical and prescribed burning to 2 or 3 million acres per year to reduce fuel loadings in fire-adapted forests. They also recommended that forest plans address wildfire consequences and set mechanical treatment and prescribed burning objectives for areas with excessive fuel loads. They also recommended developing an interdisciplinary workforce capable of maintaining, restoring, and protecting fire-adapted forests and training, qualifying, and making 75 percent of the total national forest workforce available to respond to fire emergencies by the year 2000. Other recommendations included intensifying line officer training to better redeem fire management responsibilities, clarifying responsibilities by renegotiating cooperative fire agreements with States and local communities and other partners at the wildland-urban interface, and phasing out the Forest Service's current role as the primary fire protection agency in urbanized and developing rural areas. These recommendations clearly elevated the role of fire management in protecting and managing national forest ecosystems in the future and set new directions and strategies for fire and fuel management on national forests in the 21st century.
Management of Rangelands
In 1980, 102 million acres, or 55 percent, of national forest lands were in grazing allotments: 58 million acres were "forested" rangeland and 44 million acres were classified as "rangeland." (USDA Forest Service 1981a). National forest range managers continued to improve range and rangeland watershed conditions to increase national forest allotment-forage and browse-grazing capacity in keeping with water quantity and quality, wildlife habitat, scenic quality, and wild free-roaming horses and burros resource objectives. For 1984, the goal was equivalent to 10 million animal unit months (AUM's) of livestock grazing. This goal was attained; authorized allotment grazing use rose to 10.1 million AUM's in 1983 and was sustained through 1987 (USDA Forest Service 1981-1995).
Domestic Livestock Use
Actual grazing use, however, remained at a stable 8.8 million AUM's through 1986 and then dropped to 7.7 million AUM's by 1992, responding to persistent severe drought conditions. The authorized or permitted grazing likewise declined after 1986 to about 9.1 million AUM's by 1993 (USDA Forest Service 1981-1995).
The number of cattle grazed on national forests remained very stable at 1.3 million per year between 1980 and 1988, but it declined by 100,000 by 1993. The number of sheep grazed in 1980 likewise was 1.3 million, but their numbers began to decline in 1983; by 1993, they numbered less than 1 million, a drop of 300,000 sheep (USDA Forest Service 1981-1995).
Range Management Activities
In 1980, there were 10,754 grazing allotments encompassing the entire 102 million acres of national forest rangelands. However, only the 52 million acres classed as suitable rangeland were used to determine the carrying capacity for domestic livestock grazing. The number of allotments increased to 11,069 in 1982, but steadily declined thereafter, to 9,343 in 1993. The number of paid permits and permittees also declined, from more than 15,000 to 9,113. Since the area of suitable rangeland remained about the same, the reduction in allotment numbers represented a consolidation of some units for management efficiency.
Many small grazing operators withdrew from the cattle industry as beef consumption declined steadily, from its peak 28 billion pounds in 1976 to 24 billion in 1993. Per capita beef consumption declined even more: from 128 pounds in 1976 to 93 pounds in 1993. Total cattle numbers declined similarly, from a peak of 132 million in 1975 to 99 million in 1993. Most of the waived grazing capacity was picked up by larger operators who remained in the cattle business (USDA Forest Service 1981-1995, 1986-1994). The decline in permittee numbers also reflected a shift from counting individual permittees holding grazing association permits on national grasslands to just counting association permits.
The number of allotments where the prescribed treatments in approved allotment management plans were being implemented ranged between 7,400 and 7,600 — generally tending to increase. In 1991, 7,600 allotments were implementing approved plans and 400 more plans were ready to be implemented. Almost 82 percent of the allotments were or would be under satisfactory management. In 1992, national forest range managers changed their method of assessing the adequacy of range management within grazing allotments (USDA Forest Service 1989c). These changes increased attention to multiple uses, delegated more management authority to local managers, and added new measures for assessing range health and applying an ecological approach to vegetation analysis. These changes helped a growing number of public groups and individuals interested in range uses other than livestock grazing to focus their attention on the management of range vegetation. The new approach focused on vegetation management objectives that the new national forest plans had established for national forest grazing allotments.
Under the new approach, epitomized as "Change on the Range," national forest managers introduced new measures for rangeland vegetation analysis and forest plan vegetation objectives to reflect an ecosystem approach to management (USDA Forest Service 1989c). Range condition assessments related to the full gamut of rangeland use and management objectives. Cattle forage would no longer be the sole criterion for range condition. This approach reduced the area suitable for livestock grazing to less than 50 million acres (USDA Forest Service 1989c).
In 1993, forest plans included 97 million acres where grazing was authorized by permits — 5 percent less than in 1980. These plans identified range vegetation management objectives on 74.3 million acres. Resource objectives were being met on 34 percent of this area largely through livestock management. An additional 30 percent was progressing toward meeting forest plan objectives. About 15 percent was not meeting or progressing toward forest plan objectives and required revised allotment plans, and 21 percent was still being evaluated to determine its status (USDA Forest Service 1994e).
"Change on the Range" separately identified and assessed riparian areas within grazing allotments. In 1993, grazing allotments included nearly 2.5 million acres of riparian areas, 60 percent of which was meeting or moving toward forest plan objectives. An additional 16 percent was not doing so, and the remaining 24 percent was being evaluated (USDA Forest Service 1994e).
Rangeland conditions and productivity were maintained and improved by both structures and vegetative management. National forests typically installed about 1,300 miles of range fencing; water developments at 1,600 sites, including about 260 miles of water pipelines; and 300 other site-specific practices each year. About 140,000 acres of seeding and fertilizing and mechanical, controlled burning or chemical brush and range plant treatments were applied each year. Some 1.5 to 2.5 million acres of rangeland were benefitted each year.
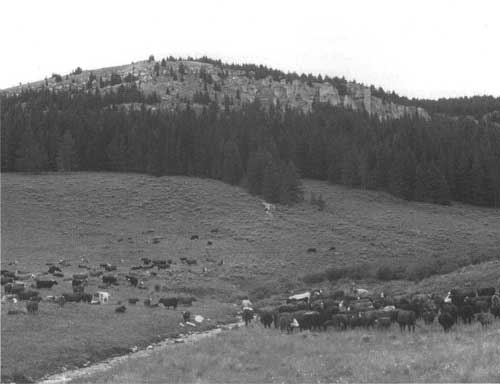
|
| Rider moves cattle to another rotational grazing unit, Big Horn National Forest, Wyoming, 1990. (USDA Forest Service Photo. Taken by K.L. Grove.) |
Noxious Weed Control
Noxious weed infestations continued to spread on national forest lands. They adversely affected wilderness, soil conditions, aesthetic quality, riparian areas, aquatic ecosystems, hydrology, and land productivity, as well as the forage supply and its nutritional values to wild and domestic animals. During the 1980's, national forest managers treated noxious weeds on about 21,000 acres per year (USDA Forest Service 1981-1995)
In 1983, the principal noxious weeds were estimated to infest 1.6 million acres and were spreading at the rate of 7 percent per year (USDA Forest Service 1987b). By 1995, that acreage had increased to 6 to 7 million acres (Clark 1996). This not only reflected the continuing spread of noxious weeds, but also increases in the number of species and changes in the definitions and criteria for noxious weeds (Clark 1996).
In the early 1990's, the effort to contain the spread of noxious weeds on national forests doubled, to an average of 41,000 acres per year (USDA Forest Service 1981-1995). In 1995, the Forest Service undertook the lead for developing a USDA interagency strategy for noxious weed control to integrate noxious weed management with ecosystem analysis, resource assessment, and national forest planning. It recognizes the primary importance of cooperation with all parties affected by noxious weed infestations and the increasing threat that noxious weeds pose to wildland ecosystem integrity, especially wilderness and research natural areas (USDA Forest Service 1996b).
Role of Public Participation
During the 1980's, range users, wildlife groups, and other resource interests increasingly participated in national forest range planning and management. This approach improved cooperation among the interest groups and helped to identify needed forage and structural improvements and to accelerate their implementation to protect and improve range vegetation and achieve a better distribution of grazing and foraging animals. Public issues and management concerns about range conditions, the spread of noxious weeds, the impacts of national forest plans, and about water quality, riparian areas, wildlife, and scenic beauty nevertheless grew during the 1980's and were an important factor in bringing about "Change on the Range." Public concerns were underscored by GAO reports on range conditions, particularly on overstocked allotments and riparian areas (GAO 1988a, 1988b). Under "Change on the Range," national forest managers emphasized restoring rangeland riparian areas, improving rangeland conditions, and developing new partnerships with interested groups and individuals. In 1989, for the first time, national forests collected data on deteriorated riparian areas that were receiving treatment to improve their vegetative condition and reported 42,727 such acres for that year (USDA Forest Service 1986-1990).
In 1990, representatives of the Forest Service, livestock organizations, and wildlife interests called a joint conference to review how effectively forest plans were addressing the longstanding conflict between livestock and wildlife. As a result, the Forest Service in 1992 launched "Seeking Common Ground" in the Western States. It sought project proposals from Government agencies, livestock producers, and wildlife organizations to demonstrate practical solutions to big game and livestock management issues. A panel of experts evaluated the proposals. Selected proposals were implemented in 1993 with both public and private funds. These on-the-ground project achievements will be monitored and reported on when they are fully implemented. (USDA Forest Service 1991-1995).
Issuance of New Grazing Permits
In 1994, as national forest managers anticipated the expiration of some 4,000 grazing permits between 1995 and 1997, a question about the need for NEPA analysis for grazing allotment plans and issuance of grazing permits arose. A growing number of lawsuits involving NEPA and the issuing of grazing permits had been decided in the plaintiffs' favor. The USDA Office of General Counsel (OGC) advised the Forest Service to develop procedures to expeditiously complete NEPA analyses before grazing permits were reissued. Because there was no legal requirement to issue a permit when the existing permit expired — even though the current permittees legally had the first opportunity to receive such a permit — the OGC saw the issuing of a permit as a discretionary act and, therefore, within the purview of NEPA. National forest range managers, on the other hand, believed grazing permits implemented the decisions made in NEPA-based allotment and forest plans. They felt that grazing permits did not require additional NEPA evaluation or documentation. The Forest Service, however, followed OGC's interpretation and streamlined the NEPA process. Existing permits were categorized by range allotment conditions and unacceptable environmental effects from the allotment management plans. Where permit issuance required mitigation measures that reduced livestock or any other allotment management plan adjustments, they would be implemented in the interim until a new NEPA analysis could be completed. However, in the summer of 1995, the Rescissions Act (P.L. 104-19) required national forest managers to issue new grazing permits when existing permits expired or when current permittees sold base holdings and to schedule new NEPA analyses for all grazing allotments. The legislation extended the timeframe for updating grazing allotment NEPA analyses to 2010 (Clark 1996).
Emergence of the "County Supremacy" Movement on Federal Lands
In the early 1990's, grazing interests were a strong and dominant force in the emergence of the current "County Supremacy" or "Home Rule" movement on western national forests and BLM lands. In more recent years, a number of western counties adopted ordinances declaring that the Federal Government has no authority to manage Federal lands. Their contention, under the "Equal Footing Doctrine," was that States, at the time they were admitted to the Union, acquired administrative authority over any Federal lands that remained open and unclaimed (Clark 1996). This movement, however, received a serious setback in 1996 when the U.S. District Court in Las Vegas, Nevada, ruled that ordinances adopted by the Nye County Nevada, County Commission did not apply to Federal lands and that Federal agencies had complete regulatory control over the lands they were charged to administer (U.S. District Court, Las Vegas, NV 1996).
The expansion and persistence of the "County Supremacy" movement has raised questions about how the Forest Service and other Federal agencies can more effectively involve local communities and whether new legal tools are needed to provide local communities with a more effective voice in the management process. National forest managers for the Humboldt and Toiyabe National Forests, the locus of the Nye County suit, have proactively sought formal written agreements with Nevada counties in hopes that such agreements will lead to greater understanding and better working relationships. (Humboldt-Toiyabe National Forests 1996; Howell 1996).
Mineral Exploration and Development
The Forest Service's role in managing mineral exploration and development continued to be focused on protecting surface resources and ensuring that mineral exploration and mining activities did not have significant adverse environmental impacts. This work was closely coordinated with the BLM and the Geological Survey, who have the administrative and technical responsibilities for subsurface resources under Federal mineral laws. National forest managers annually conducted 25,000 reviews and evaluations for lease applications, prospecting permits, notices of intent, operating plans, actual mining operations, mineral claim validations, geophysical exploration permits, and surface resource use permits for mining of private mineral estates and on reserved outstanding mineral rights on national forest lands purchased under the Weeks Act of 1911. These reviews and evaluations included appropriate environmental documents where significant environmental impacts were possible.
Oil and Gas Leases
About half of the aforementioned reviews were conducted for oil and gas leases. The number of acres of national forest land leased for oil and gas exploration and potential development rose from 18 million acres in 1977 to a peak of 35 million acres in 1983. Thereafter, as the energy supply situation eased and the 10-year leases expired, the leased acreage dropped to 18 million acres in 1987 and to less than 6 million acres by 1994. The number of leases declined similarly, from 24,600 in 1983 to 8,800 by 1994 (fig. 26) (USDA Forest Service 1981-1995).

|
| Figure 26. Oil and gas leases on national forests, 1983-1994. Source: USDA Forest Service, Minerals and Geology Management Area tabulation. |
The number of oil- and gas-producing leases, however, rose steadily, from 500 in 1980 to 2,014 in 1994. Oil production rose from 8 million barrels in 1977 to a peak of 22 million barrels in 1988, then declined to 12 million barrels by 1994. Gas production was sustained throughout this period at about 210 billion cubic feet per year to 1993. In 1994, gas production increased by more than 50 percent, to 325 billion cubic feet.
In 1987, Congress enacted the Federal Onshore Oil and Gas Leasing Reform Act, which gave the Forest Service authority to regulate and approve all surface-disturbing activities for gas and oil leases and lease operations rather than just making recommendations to the BLM. The Secretary of the Interior's authority to issue oil and gas leases on national forest lands was made contingent on Forest Service determination that such lands were suitable for leasing. This determination required a pre-lease NEPA environmental analysis and followup compliance inspections and enforcement. The new responsibility gave national forest managers the initiative to identify the highest priority tracts and put them on the market rather than respond to industry initiatives to apply for oil and gas leases (Robertson 1988). The Forest Service's implementing regulations for the Act were effective in 1990, but by that time the demand pressure for oil and gas exploration and development on national forest lands had fallen to its lowest level in 20 years.
The new regulations allowed the Forest Service to use staged decisionmaking and environmental analysis at each step of the permitting process — an approach that made it possible to defer environmental analysis of production plans and activities for areas with unknown potential, speculative interest, or no history of drilling or production until the operations stage (USDA Forest Service 1989b).
Coal and Geothermal Leasing
Coal leasing expanded similarly. Leased acres rose from less than 150,000 in the 1970's to 208,000 in 1986 and then declined to 122,000 acres in 1988 as leases expired more rapidly than they were renewed or new leases were issued. Thereafter, the leased acreage rose again and reached almost 197,000 acres in 1994 (fig. 27). In 1994, coal leases on national forest lands were producing 114 million tons, compared to 7 million tons in 1980. One surface coal mine on national forest lands in Wyoming, the largest surface coal mine in the world, was producing 3 percent of all coal mined in the United States (USDA Forest Service 1981-1995).
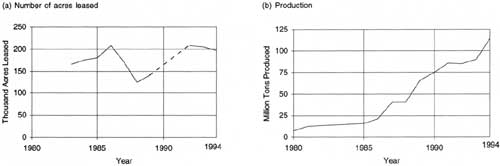
|
| Figure 27. Coal leases and production on national forests, 1980-1994. Source: USDA Forest Service. |
In 1983, geothermal energy leases occupied more than 700,000 national forest acres. By 1986, the leased acreage had risen to more than 1.2 million. In 1994, however, geothermal leasing was down to 286,000 acres, a result of lower oil prices. The first geothermal power facilities on national forest lands began operation in 1981. By 1994, three geothermal powerplants were operating on national forest lands.
Minerals Leased on Acquired National Forest Lands
Lead and phosphate are leased on acquired national forest land primarily in the Eastern States. In 1993, national forests were producing 95 percent of the Nation's lead output, and phosphate mines were producing a total of 5.5 million tons.
Locatable Minerals
Locatable minerals include gold, silver, copper, zinc, molybdenum, and other minerals. Out of 7,000 active, locatable mineral mine sites, only 1,200 are currently producing.
The passage of the Federal Land Policy and Management Act of 1976 (FLPMA) required owners of unpatented lode and placer mining claims located before 1976 to file a record in the office where the original claim notice was filed, with a copy to the BLM, along with a "notice of intent" to hold and work the claim by 1980. This requirement made it possible, in the early 1980's, for the Forest Service to identify legitimate claims and have BLM null and void claims where location notices had not been filed.
Mineral Materials
Mineral materials include sand, gravel, stone, pumice, cinders, and other fairly commonplace materials used for local construction, road construction and maintenance, and landscaping. National forests managed more than 1,000 pits and quarries and sold these materials to the private sector (public sector use was free). National forest managers took care to ensure that lands disturbed in extracting these materials were properly reclaimed.
Boil, Water, and Air Resources
During the 1980's and early 1990's, the primary role of soil, water, and air resources management was to coordinate the protection of soil productivity, watersheds, waterflows, and air quality with other resource management activities. This role, including inventory, monitoring, and land management planning activities, constituted 88 percent of the total soil, water, and air workload (USDA Forest Service 1994f). The balance was devoted to installing soil and water improvements. Much of the management and coordination input that the soil, water, and air resources staff provided was directly implemented by the resource management staffs they assisted. The benefits of this coordination came largely in the form of avoiding undesirable or adverse impacts on national forest soils, waters, and airspace. Over the nine decades of national forest management, the absence of major widespread problems with soil productivity, watersheds, waterflows, and water quality on national forests has largely been a reflection and measure of the quality of soil and water resource coordination and management. From the time of Gifford Pinchot, the long-term protection of soil and water resources has been the primary concern of national forest managers.
Coordinating Resource Management With Soil and Water Objectives
More than 50 percent of the total workload of the soil and water program has been providing technical assistance and coordination to timber management, minerals exploration and development, range management, engineering, and other resource activities to protect soil productivity, waterflows, and water quality. Timber sale planning, including roads, has constituted the largest share; mineral exploration and development was the next largest component. Such coordination integrates soil and water objectives into the planning for all other national forest resources and uses and recommends ways to prevent soil loss or damage and water quality impairment from land-disturbing resource management activities. As both timber harvests and mineral exploration and development declined in the 1990's, these efforts were scaled down to less than 30 percent of the soil, water, and air management workload (USDA Forest Service 1981-1995). The dominant workload shifted to inventorying and protecting long-term soil resources and riparian areas; ensuring adequate stream flows for fisheries, recreation, and municipal watersheds; improving watersheds; and protecting wilderness resources from air pollution (Bryant 1996).
In 1988, while States were developing regulations to control nonpoint pollution under section 319 of the Clean Water Act, the Forest Service approved a strategy to minimize nonpoint sources from national forest land and resource management activities. This strategy provided for the design and application of "best management practices" (BMP), monitoring to ensure the practices were in place and effective, and applying mitigation measures where unacceptable impacts had occurred or could occur. National forest managers developed cooperative agreements with State agencies that spelled out the roles and responsibilities of each in preventing nonpoint pollution sources. The national forest regions developed handbooks for minimizing nonpoint pollution. The guidelines in these handbooks were incorporated by reference into national forest land and resource management plans (USDA Forest Service 1989c; Bryant 1996).
Followup monitoring was exemplified by the water monitoring stations on Arkansas's Ouachita National Forest below 21 timber stands, where resource managers found unacceptable herbicide contamination. As a result, application methods and herbicide mixing locations were modified to maintain water quality. On Alaska's Chugach National Forest, monitoring of placer mining's effects on anadromous fish streams led to the installation of additional sediment-collection ponds to meet State water quality standards.
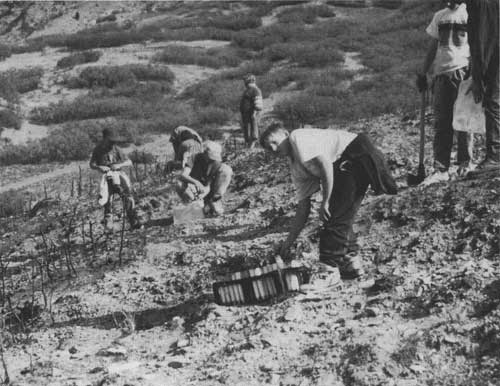
|
| Volunteers in a community replanting project on the Wasatch Forest in the area of an arson-caused fire, Uinta National Forest, Utah. (USDA Forest Service Photo, Uinta National Forest.) |
Soil and Water Inventories
Between 1950 and 1993, soil surveys were completed for almost 70 percent of national forest lands. They included the determination of soil suitability, productivity, and reforestation potentials; erosion and soil stability problem areas; soil and vegetation effects on water yields and water quality; and baseline information to monitor changes caused by management activities. Soil inventory work and analysis produced maps and interpretations that resource managers increasingly used to make more informed decisions on sensitive land management activities such as planning timber sales, locating potential recreation sites, determining where and how to use prescribed fire, identifying the sites and routes most suitable for road construction, estimating soil productivity for range forage, and many others. During the latter 1980's, many national forests began to monitor timber management effects on soil productivity. In 1991, for example, Oregon's Malheur National Forest monitored soil quality to determine the effects of timber management on soil compaction. The results indicated that the regional soil compaction standards were being exceeded and potentially were impacting soil productivity on many acres. National forest managers adopted best management practices to avoid or mitigate such excessive compaction (USDA Forest Service 1981-1995). In 1989 and 1990, Louisiana's Kisatchie National Forest monitored soil erosion following site preparation with a roller drum chopper and slash burning on selected reforestation areas. The initial results showed that erosion was within the tolerable loss limits defined in the forest plan.
Long-Term Soil Productivity Study Initiated
In 1990, the National Forest System and Forest Service Research established a nationwide cooperative study to identify and quantify the kinds of changes different soils could sustain without losing long-term productivity and to set soil compaction and organic matter content threshold standards on benchmarks for designing forest practices, monitoring soil condition trends, and assessing the effectiveness of soil and water conservation. The project sought to better understand the basic relationships between soil properties and the long-term productivity of the Nation's major forest ecosystems. In 1991 and 1992, the Forest Service installed study plots in Louisiana, North Carolina, Minnesota, Michigan, California, and Idaho. Universities, other agencies, Canada, and New Zealand expressed interest in cooperating in this study as it was being put in place (USDA Forest Service 1991-1993). In 1995, information was being compiled on early findings and the current status of this widespread study effort.
Shift Toward an Ecological Approach and Emphasis
Some national forests began to introduce an ecological approach to soil inventories in the late 1980's and early 1990's. In 1990, Michigan's Huron-Manistee National Forest applied the Integrated Ecological Classification System to 80,000 acres to improve resource capability determinations and to increase its knowledge of the linkages between ecological processes and land management. This ecological approach added vegetation and sometimes hydrologic information to the soils data, making interpretations of ecological processes easier and more reliable. Other regions and forests introduced similar approaches. In 1991 and 1992, Idaho's Targhee National Forest and Wyoming's Bridger Teton National Forest classified vegetative types and designed ecosystem unit maps that could be linked with the soil inventories (USDA Forest Service 1991-1993).
In 1992, Forest Service researchers working with national forest managers developed a draft National Hierarchical Framework for Ecological Units to address an ecosystem approach to national forest resource management. They also developed a national ecological database to manage information from expanding ecological inventories. The National Hierarchical Framework of Ecological Units was completed in 1993 and the Chief's Office directed national forest managers to use it in developing an ecological approach to future land and resource planning (Unger 1993).
"Ecological units" are terrestrial mapping units determined by macroclimate, geomorphology, geology, soils, and potential natural vegetation and reflect predictable and uniform capabilities and responses to management. The National Hierarchical Framework — built on earlier work by Robert G. Bailey, "Ecoregions of the United States," compiled in 1976, and by W.A. Wertz and U.F. Arnold, "Land Systems Inventory," completed in 1972 — is a way of mapping and using ecological units at several different scales. In 1995, the ecological mapping effort added a hierarchical framework of aquatic ecological units to identify and differentiate aquatic ecosystem components (Bryant 1996).
Water Resource Surveys
National forests conducted watershed condition surveys on more than 35 million acres to assess water quality conditions, predict the timing and amount of runoff, and prevent floods. This information was used to identify and prioritize opportunities to improve the management of activities that could adversely impact water quality.
In 1988, national forests classified and assessed the condition of 17,600 miles of stream channels. In the same year, the Northern and Intermountain Regions, in cooperation with the State of Idaho's effort to quantify water uses, inventoried 30 percent of the water uses and improvement needs on Idaho's Snake River. These inventories identified fish, recreation, wildlife, timber, watershed, and range improvement needs and provided a quantitative basis for national forest water rights claims for streamflows in the Snake River Basin (USDA Forest Service 1989c).
In 1993, the Forest Service opened the Stream System Technology Center at Fort Collins, Colorado, to improve the basic knowledge of mountain stream systems and processes and to develop operational tools, provide training, and give land managers technical support as they worked to secure "favorable conditions of waterflow" and maintain stream flow conditions provided in the 1897 Organic Act.
Soil and Water Monitoring
Monitoring determined whether resource management prescriptions were being properly designed and fulfilling soil, water, and air resource objectives and covered a wide range of practices throughout the National Forest System. In 1986, for example, monitoring timber sale operations on the Goat Creek Drainage on Washington State's Gifford Pinchot National Forest confirmed that BMP's such as removing floating logging residues, suspending logs over stream channels, and leaving all embedded logs in the channels were effective in preventing unacceptable stream turbidity increases (USDA Forest Service 1987b). Monitoring determined that ripping compacted soils and seeding to grass was effective in restoring more permeable soil conditions on California's Los Padres National Forest (USDA Forest Service 1987b). In 1987, water quality monitoring at 200 Pacific Northwest Region sites established that timber harvesting BMP's were effectively meeting State water quality standards (USDA Forest Service 1988b). Sample monitoring on eight California national forests demonstrated that properly applied BMP's on ski slopes, offroad vehicle trails, timber harvest areas, and roads were at least 95 percent effective in preventing nonpoint source pollution (USDA Forest Service 1988b). These examples illustrate that in soil and water monitoring is becoming a tool to ensure that environmental quality standards are met in managing multiple uses and that they are effective in maintaining or restoring ecosystems over time.
Riparian and Wetlands Management
Riparian and wetland areas make up about 5 percent of the national forest land base. Over half of this area is in Alaska. Most of the balance is located on the eastern and southern national forests. In the extensively arid low-rainfall areas of the Western States, this percentage is closer to 2 percent. In the Southern Region, it is 8 percent; in the Eastern Region, it is 7 percent.
During the 1980's, national forest managers gave increasing attention to improving management and protection of riparian areas and wetlands. The public increasingly saw these areas as key to productive fisheries and wildlife habitat, diverse scenery and recreation sites, flood reduction, quality water for downstream users, and continued groundwater recharge. Forest plans introduced standards and guidelines to maintain and improve them. Regions and forests developed forest plan implementation approaches that stressed riparian values. The Intermountain Region prepared a 1988-1992 riparian action program defining its goals and objectives for improving riparian area management. By 1990, all regions had begun to implement riparian area strategies on areas and sites with unsatisfactory conditions to achieve forest plan standards. In the same year, an analysis of 359,000 riparian area miles in the six contiguous western national forest regions found that only 57 percent met current forest plan goals. The balance were classed as moving toward or failing to meet the goals (Bryant 1996).
A 1991 national strategy for improving riparian areas called for an integrated approach in applying forest plan standards to riparian areas and wetlands. It set national, regional, and forest on-the-ground riparian goals, including the completion of an inventory of the ecological health of riparian areas by 1995. This inventory had not been completed as this book was published.
The Quinn River riparian rehabilitation demonstration project on Nevada's Humboldt National Forest was initiated with the cooperation of the EPA and the Nevada Department of Environmental Protection. National forest managers installed in-stream structures, stabilized streambanks, planted willows, and fenced off a riparian pasture to improve riparian conditions. They also monitored a channel cross-section for water chemistry, temperature, and macro-invertebrates to assess the area's future responses to the management (USDA Forest Service 1991-1995).
Water Rights
In response to the 1978 Supreme Court ruling in New Mexico v. United States (the Rio Mimbres case) and the growing realization of the importance of both consumptive and in-stream flow-water uses on national forest lands, the Forest Service in the 1980's began to file claims for beneficial water uses in various Western States. Policy and case law had previously encouraged regional foresters to simply notify States of their Federal reserved water rights and uses without quantifying them. With increasing competition for water and shifts in the relationship between the Federal Government and States over water management, the Forest Service had to quantify its water-rights claims in all adjudications and defend them against legal attacks by other water users and the States themselves. In 1992 and 1993, for example, the Forest Service was involved in water-rights adjudications in Idaho, Montana, Nevada, Oregon, Colorado, and several other Western States (USDA Forest Service 1981-1995; Glasser 1996).
Soil and Water Resource Improvements
National forest soil and water improvements are usually applied to situations where resources have been impaired or are seriously threatened. The first priorities are to maintain and restore degraded or threatened water quality and to maintain or restore damaged or threatened soil productivity. Improvements are funded with appropriated funds and Knutson-Vandenberg Act funds (also known as KV funds) from timber harvest receipts. KV funds are applied to correct and improve watershed conditions only on timber sale areas. These improvements increase water's infiltration into the soil and reduce overland waterflow, which can potentially erode the soil, reduce productivity, and increase stream sedimentation. KV-funded range, wildlife, and fish habitat improvements such as livestock fencing, fish pools, and reseeding vegetation are also designed to improve watershed conditions.
The Forest Service has also cooperated with States, using funds authorized by the Surface Mining Control and Reclamation Act to make improvements to abandoned coal mine sites. The work on many of these projects has been done by human-resource programs and volunteers. There are still more than 25,000 abandoned mines on national forest lands, but only about 10 percent involve hazardous situations. Some still need treatment to meet the Clean Water Act standards (Bryant 1996).
In 1980, 38,000 acres of soil and water resource improvements were installed. This level dropped to about 11,000 acres per year by 1986 as the staffing and funding for such improvements was heavily retrenched. Inventory and resource coordination staffing, however, was maintained and integrated with other resource activities to meet soil, water, and air resource objectives. With the restoration of soil and water staffing and funding in the early 1990's, soil and water improvements were again being installed on 35,000 to 40,000 acres per year (USDA Forest Service 1981-1995).
Emergency rehabilitation following wildfires and floods has also made important contributions to restoring and maintaining water quality and soil productivity. Depending upon weather conditions, such damage varies widely from year to year. During the severe drought conditions in the latter 1980's and early 1990's, emergency rehabilitation exceeded 100,000 acres per year for 6 years. In more normal years, such measures would range from a few hundred to 50,000 acres. Flood damage on national forest lands ordinarily is less extensive than wildfire damage. The most intensive emergency flood rehabilitation work was in 1985, when unusual weather patterns caused major floods and severe damage to national forest watersheds, stream channels, transportation systems, and recreation and administrative facilities in Arizona, California, New Mexico, and Utah, involving about 25,000 acres of restoration work (USDA Forest Service 1981-1995).
Air Quality Management
In 1977, the Clean Water Act gave national forest managers special air quality protection responsibilities at 88 congressionally designated class I areas in national forest wilderness (areas that were wilderness in 1977 and larger than 50,000 acres). All regions developed screening processes to determine which air quality values should be protected and monitored and how to evaluate the potential air quality impacts from atmospheric emissions originating from national forest activities and from nonpoint sources. Using automatic cameras, they assessed effects on visibility and terrestrial and aquatic habitats in class I airsheds. National forest managers notified State officials when monitoring showed adverse effects of air pollution on visibility or water quality or foliar damage from ozone in any of the class I airsheds. States had the lead in determining mitigation measures and further study needs to remedy such situations. Some class I airsheds already had existing adverse effects from air pollution. These were documented. National forest managers and States cooperated to develop State implementation plans (SIP's) to meet air quality guidelines and protect resources and environmental quality in these cases.
The emergence of prescribed fire as a major resource and ecosystem management tool raised the paradox of actually producing some air pollution (smoke from prescribed fires) while working to improve the health, productivity, and resilience of certain national forest resources and ecosystems. The National Forest System and many external interests have accepted this apparent contradiction between preserving air quality and the need to create limited air pollution. But there are outstanding issues, particularly in heavily populated areas with air quality problems from other sources, where the citizens feel that national forest smoke management is not sufficient to satisfy local air quality goals. Often, however, communities are ready to accept the smoke from prescribed fires as a favorable or even tradeoff with smoke from wildfires.
Each year, national forest managers review with States some 40 to 80 applications, received from major oil, gas, and other commercial developments on or near national forests, for new facility emissions source permits for prevention of significant deterioration of air quality (USDA Forest Service 1981-1995). In such cases, national forest managers, working together with the EPA, States, and the involved industries, affirm that air quality values on national forest lands are protected. These determinations often lead to improved control measures for proposed facilities to mitigate or prevent any further degradation.
More Forest Service specialists monitored air quality and visibility at selected sites across the Nation — increasing from 32 in the early 1980's to more than 55 in 1993. In cooperation with States, the EPA, and the National Park Service, they also operated nine IMPROVE (interagency monitoring of protected visual environments) network sites and developed lichen monitoring and ozone leaf damage protocols that most regions are implementing (USDA Forest Service 1981-1995).
In 1988, national forest and EPA specialists sampled airborne chemical pollution in 888 acid-sensitive lakes where air pollutants had significantly degraded the lake's buffering capacity for such pollutants. This monitoring continues at the most sensitive sites. National forest specialists also collected acid rain data as a part of the national acid deposition program and network (Bryant 1996).
In 1994, the Forest Service developed the National Strategic Plan for Air Resource Management to ensure that air resources were considered in the ecosystem approach to resource management. The strategy provided for stronger coordination and continuity in air quality management efforts across the National Forest System and directed resource managers to become more proactive and less reactive in carrying out their role. The strategy gave forest managers a consistent approach for addressing interregional air issues affecting the management of national forest ecosystems and gave the regions a framework for their local strategic plans. Its five guiding principles included integrating air resource management with other disciplines, basing recommended actions on science, forming partnerships to achieve resource management goals and sharing them with other Federal agencies, striving for excellence, and obeying the law (USDA Forest Service 1994g).
Weather Monitoring Program
A national weather monitoring program was established in 1986 to incorporate meteorological expertise and weather and climate information into overall management of multiple uses and to help improve the existing fire danger rating system. To improve accuracy and reliability, this program improved the siting, coordination, and maintenance of about 300 remote automatic weather stations. By 1988, the Forest Service had completed a comprehensive Service-wide weather information communication needs assessment and selected specifications for a new Weather Information Management System (WIMS) to gather, process, distribute, and store weather data and information. The new WIMS was developed and tested during the next 5 years and became operational in 1993 at the National Information Technology Center in Kansas City. WIMS is linked with the National Weather Service telecommunications network that supplies integrated weather data and climate information for resource management and fire management (USDA Forest Service 1981-1995). Nationwide, the Forest Service operates more than 500 remote automatic weather stations.
Outdoor Recreation Use and Management
During the 1980's and 1990's, national forests offered the most extensive and diversified outdoor recreation opportunities, activities, and experiences within the United States for the American people. The spectrum of outdoor recreation activities ranged from pristine wilderness challenges to urban team sports; from organized group activities to individual hunting and fishing trips; from guided auto tours through scenic corridors with distinctive aesthetic, cultural, and historical sites to whitewater rafting; from skiing high mountain slopes to hiking more than 100,000 miles of trails; from birdwatching to volunteers exploring and developing archeological projects; and from swimming and boating to hang gliding. These opportunities were located in all parts of the country, but were concentrated in the West, where more than 80 percent of the national forests are located and more than 80 percent of the RVD's occur.
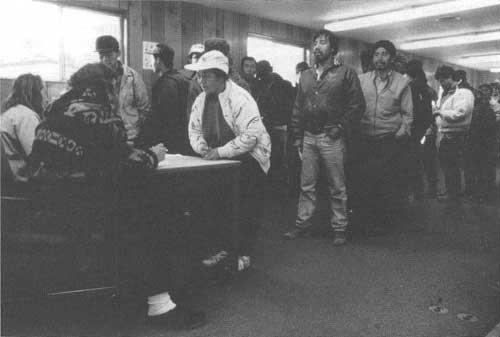
|
| Forest staff issuing special use permit for gathering wild matsutake mushrooms growing on the Chemult Ranger District, Winema National Forest, Oregon. (USDA Forest Service Photo. Taken by Frank Erickson) |
Recreation Use of National Forests
Outdoor recreation use on national forests reached a peak of 236 million RVD's in 1981 (see fig. 8, chapter 3), then declined to 225 million RVD's in 1985 before beginning to rise again. Some of the decline can be attributed to changes in RVD counting, but major shifts in recreation use patterns also contributed. Repeat visits to national forests rose from 60 percent to 77 percent of the total visits. The number of visits of shorter duration, less than 4 hours, increased from 14 percent to 48 percent. Visits longer than a day dropped from 70 percent to 21 percent. The percentage of all trips involving 2 hours or less of travel time increased from 43 to 72 percent, while trips with more than 8 hours of travel time decreased from 23 percent to 6 percent.
These patterns were common to all Federal lands, including the national parks, although visitor use declines on some Federal recreation lands began earlier and ended earlier than those on national forests (Cordell et al. 1990). The cause of this shift and the temporary decline in RVD's appears to be associated with a decline in leisure time that began in 1976 and continued into the 1980's. It was attributed to an increase in urbanization and two-worker households. People began to take shorter vacations at places closer to home (Domestic Policy Council 1988).

|
| Forest Service employees discussing national forest universal accessibility with local community user interests, 1990. (USDA Forest Service Photo. Taken by Ed Fox.) |
Between 1980 and 1986, dispersed recreation use, including hiking, snowmobiling, skiing, hunting, fishing, driving for pleasure, and wilderness experiences, were 64 percent of the total national RVD use. The other 36 percent occurred at developed sites: campgrounds, picnic areas, boat landings, ski slopes, private resorts, recreation residences, concession sites, swimming beaches, observation sites, and visitor centers. Private facilities such as lodges, resorts, and recreation residences provided 43 percent of the developed site use, while national forest facilities provided 57 percent.
Even with the visitor use decline in the early 1980's, servicing and maintaining developed national forest sites became a major management challenge as recreation management funding was reduced by 18 percent between 1980 and 1986. This funding was not fully restored until 1990 (USDA Forest Service 1994f). Recreation management staffing had declined by 24 percent by 1986, and likewise was not restored until 1990. As a result, the visitor capacity of forest-operated facilities that remained open to public use declined by 22 percent between 1980 and 1986. In addition, the capacity of open facilities with full services decreased from 65 percent in 1980 to 29 percent in 1985. (USDA Forest Service 1981-1995).
Between 1980 and 1986, funding for recreation site construction was reduced by a third, with most of the available funds being used to upgrade health and safety (drinking water and sanitation) at developed sites. These management efforts increased visitor use and comfort, although the quality of the visitor's experience may have been reduced with more people using the available facilities. For example, in the early 1980's, visitor use at developed sites declined by only 4 percent while the capacity of forest-operated facilities declined by 22 percent. However, this decrease was partially offset as volunteers and human-resource programs provided maintenance and services for 10 to 15 percent of the total capacity in addition to the services of the national forest programs (USDA Forest Service 1981-1995).
RVD use began to rise again in 1987, to 238 million, and continued to grow, to 296 million visitor days in 1993 — an average annual rate of 3.9 percent compared with a 1.2-percent population growth rate for the same period. After 1986, funding for recreation management grew by 7.9 percent per year and staffing by 8.1 percent per year. The annual developed site capacity grew by 3.4 percent per year. Annual developed site use rose to 116 million RVD's and constituted more than 39 percent of the total RVD use. The Forest Service attributes much of this sudden reversal in RVD trends to the development and implementation of the new national recreation strategy in 1988 — to improve the effective use of national forest recreation opportunities.
National Recreation Strategy
The National Recreation Strategy emerged as a national initiative in response to the priorities set in completed national forest land and resource management plans. The primary objective was to improve the quality of the user experience through better services and more effective maintenance of recreation sites and facilities. The ultimate goal was greater user satisfaction. A secondary objective was to expand partnerships with other recreational agencies and private enterprises — using incentive grants to encourage their participative funding of national forest recreation opportunities and services. The strategy's third dimension was to improve the American public's awareness, understanding, and appreciation of the management of multiple uses and use opportunities on the national forests (USDA Forest Service 1987-1995).
Implementation plans focused on expanding recreation use and improving user satisfaction in "urban" national forests. A national campground reservation system became operational and served 367 campsites in 1989. In 1990, it was serving almost 600. By 1990, many national forests were installing "sweet-smelling toilets" in response to visitors' number-one complaint. The Forest Service was also developing local national forest visitor maps to meet user information needs.
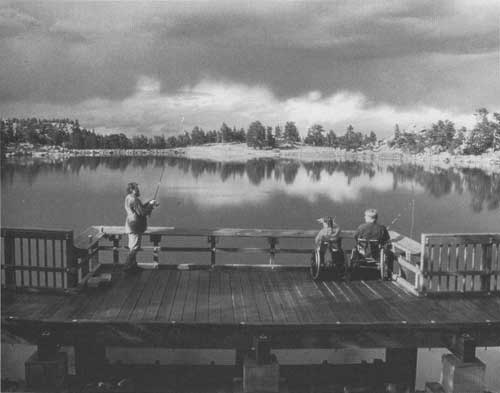
|
| Fishing dock on Bellaire Lake, Arapaho-Roosevelt National Forest, Colorado, provides safer access for wheelchair users. (USDA Forest Service Photo. Taken by Tom Iraci.) |
Universal Access to Recreation Opportunities
In 1987, the Forest Service adopted "universal design principles" to ensure access to all recreation users, especially children, the elderly, and people with sensory, cognitive, or mobility disabilities. In the following years, national forests conducted accessibility surveys and more than 100 training workshops on access surveys, awareness of people's needs, and "universal design." The Forest Service developed partnerships for access with more than 90 community organizations to complete more than 600 accessibility projects across the Nation. The Forest Service developed and published Universal Access to Outdoor Recreation: A Design Guide as a tool for guiding outdoor recreation access planning and design in a partnership with Project Play and Learning in Adaptable Environments, Inc. A new chapter was added in 1993 to help designers and planners apply the design guide's technical specifications to existing and new recreation sites. The Forest Service developed a partnership with Wilderness Inquiry and American Outdoors to produce a manual that would help outfitters and guides apply universal design principles in their programs and services (USDA Forest Service 1987-1995).
Scenic Byways and Tourism on National Forests
In 1988, the Forest Service designated its first scenic byway — a national forest travel route that traverses scenic corridors of outstanding aesthetic, cultural, and historical interest — on Tennessee's Cherokee National Forest. This initiative responded to the largest recreational use among national forest visitors: driving for pleasure and viewing scenery, which represented 32 percent of the total RVD use. Ten scenic byways were designated in 1988. By 1990 there were 75, and they totaled 3,800 miles of scenic roadway and a ferry system (the Alaska Marine Highway) spread across 31 States from Alaska to Florida and from New Hampshire to California. By 1993 there were 120 national forest scenic byways covering more than 6,900 miles in 34 States. Visitors driving for pleasure and viewing scenery increased by 31 percent from 1987 to 1993, while total visitor use of national forests increased by only 24 percent (USDA Forest Service 1987-1995).

|
| Scenic opening on the Sandia Crest Scenic Byway, Cibola National Forest, New Mexico. (USDA Forest Service Photo.) |
In a parallel initiative, national forest managers developed tourism partnerships with local, regional, and State organizations to help diversify and strengthen the economies of rural communities. The tourism initiative focused on the role national forests could play as special attractions, scenic backdrops to many rural communities, and suppliers of campgrounds, trails, resorts, ski areas, and scenic vistas. In 1992, the Forest Service sponsored an interagency conference on tourism. The Forest Service, Department of the Interior agencies, the Army Corps of Engineers, and the Travel and Tourism Administration endorsed a memorandum of understanding to work together to promote tourism.
Urban National Forests
Urban national forests, those with a million or more people living within about a 1-hour drive, were given special recognition and separately classified in 1987. By 1995, the National Forest System had 13 recognized urban national forests. All except the two most recently designated, the White Mountain National Forest in New Hampshire and the Chattahoochee-Oconee National Forest in Georgia, were in the West. One out of every seven Americans is within a 2-hour drive of these urban forests. Populations within a 2-hour drive of these forests ranged from 2 million at the Mt. Hood National Forest near Portland, Oregon, to 15 million at the Angeles and Los Padres National Forests in southern California.
Because of their complex relationships with adjacent governments, interest groups, and large, diverse populations, these forests are unique. RVD use at these forests exceeded 73 million in 1993 and concentrated one quarter of the total national forest RVD use on just about 10 percent of its land base. The urban national forests provide dramatic mountainscapes and scenic backdrops for Los Angeles, Seattle, Portland, and Salt Lake City, where they become an integral part of those cities' images as desirable places to live.
Frequently, recreation use on many urban national forests has the appearance of a "city park." Yet often, these heavily used areas are not providing the level of services metropolitan people desire. Some sites are now showing severe heavy-use impacts. Riparian areas have been historically popular with metropolitan visitors, but their use has been compromised in many places. The traditional rural setting and orientation of national forest management has not always served urban forests effectively. Finding a balance between serving large metropolitan populations, meeting preferences of rural interests, and protecting the resources and environment on these forests presents a difficult challenge. Planning management that will effectively meet such demands is an important step in protecting national forest resources and their environment and ensuring their sustainable management and use by future generations (USDA Forest Service, Urban National Forest Supervisors 1994).
Interpretive Services
During the 1980's and early 1990's, interpretive services matured into a broad national educational effort to better acquaint Americans with national forests and the extraordinary opportunities to learn about the outdoors and enjoy the wide diversity of recreation, aesthetic, and educational experiences it provides. National forest interpreters guide visitors on field visits and trips that introduce them to the natural and cultural wonders of the national forests and grasslands and how they are managed. Their interpretive services cover a wide variety of partnerships. In northern Minnesota, several small lake resorts and local foundations work with the Superior National Forest to place forest interpreters at resorts to lead hikes, tour local sawmills, and provide educational programs. Their customers have responded by staying longer and repeating visits. The State of Alaska formed a partnership to provide forest interpreters on board the State ferry fleet (the Alaska Marine Highway), which travels between Bellingham, Washington, and Skagway, Alaska, through the scenic Inside Passage. Interpreters provide talks, films, children's programs, and narration about the Inside Passage's historical, cultural, and natural resources. Dude ranches near Jackson, Wyoming, fund interpreters from the Bridger-Teton National Forest to provide evening programs and interpretive trail rides sponsored by the ranches. In Oregon and Washington, Mobility International USA, Telephone Pioneers of America, the Easter Seal Society of Oregon, and local civic groups work with the Pacific Northwest national forests to build interpretive trails and fishing platforms and to erect interpretive signs for people with disabilities. Although some interpretive services are administered by national forest staff, many are heavily dependent upon volunteers, partnerships, and many nonprofit interpretive associations.
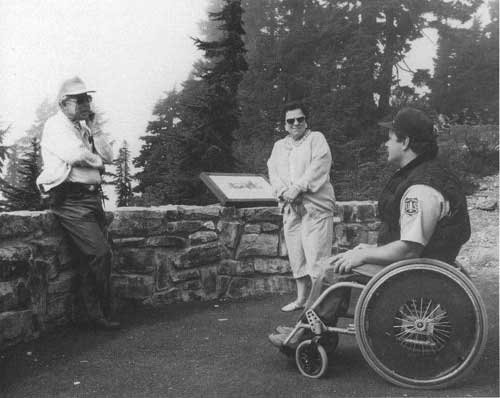
|
| Forest Service interpreter assists visitors at overlook site, Mt. Baker-Snoqualmie National Forest, Washington, 1992. (USDA Forest Service Photo. Taken by Tom Iraci.) |
Nonprofit interpretive associations have been established as public service organizations to further the interpretation and understanding of natural resources and their management on national forests. These associations provide visitor center staffs, sell maps and books at visitor centers and national forest offices, prepare brochures and a wide range of other publications, and purchase new equipment for interpretive programs. There were 44 nonprofit interpretive associations in 1988 and 57 in 1995. National forests use the net revenues of these associations, mainly from sales of maps and books, for recreation improvements. Such contributions rose from $170,000 in 1985 to more than $2 million by the early 1990's (USDA Forest Service 1981-1995).
"Challenge Cost-Share" Program Expands Recreation Partnerships
In 1988, as an initial part of the National Recreation Strategy, the Forest Service launched the $500,000 pilot "Challenge Cost-Share" program to encourage partnerships with private and other public interests on recreation improvement projects. The response to Challenge Cost-Share was spontaneous and strong as partnerships emerged with local, county, State, and national agencies, plus private interest groups, senior citizens, people with disabilities, veterans, correctional facility inmates, students, utility companies, recreation industries, timber operations, interpretive associations, and private businesses. The partners provided more than $900,000 for recreation improvements, nearly $2 for each Federal dollar (USDA Forest Service 1987-1995). They provided natural resources education, improved campground access for visitors with disabilities, developed interpretive sites, investigated archeological sites, and prepared and funded many publications.
In 1989, the Federal portion of Challenge Cost-Share increased to $3 million, and partners responded with more than $7 million. This approach has continued to grow; in 1993, the partners contributed $34.2 million and the Federal Government $16.6 million. The total partnership contribution since 1988 has been $90 million, and the Federal share has been $45 million.

|
| Regional Forester Elizabeth Estill (at right), Rocky Mountain Region, Denver, Colorado, consulting with Human Resources Staff, 1996. (USDA Forest Service Photo, Region 2. Taken by Dave Steinke.) |
Volunteer Services contribute to Recreation Program
In addition to the partnerships in the early 1990's, volunteers and participants in the "Touch America Project" — a volunteer program that gives youth between 14 and 17 job experience and environmental awareness through work on public lands — were contributing work valued at about $25 million per year to recreation-related projects. This contribution was almost two-thirds of the total work contributed by all Forest Service volunteer programs (USDA Forest Service 1992b). Thus, while volunteers were an important component of the National Recreation Strategy's implementation, they contributed in their own way to educating the American public about national forest and grassland services and benefits.
Heritage Management
During the 1980's and early 1990's, heritage management (formerly cultural resources management) evolved into a progressive recreation initiative to make cultural, historical, and archeological artifacts accessible for visitor education and enjoyment. Earlier efforts had focused largely on surveys and inventories to preserve and protect these artifacts where land-disturbing management activities might have damaged or destroyed them. Heritage management staffing steadily increased from 159 FTE's in 1980 to 410 FTE's in 1994 (USDA Forest Service 1994f). Funding increased even more rapidly, from $7.6 million to $28.3 million.
Between 1980 and 1994, heritage programs staff surveyed 40 million acres for archeological, historical, and cultural artifacts. Tens of thousands of such artifacts were identified, and hundreds were listed in the National Register of Historic Places. In 1989, a new initiative, "Windows of the Past," was introduced as a part of the National Recreation Strategy to convert the preservation of cultural artifacts into recreation opportunities for visitors. Its objectives were to increase visitor awareness of archeological, historic, and cultural resources; to strengthen the public's interest in protecting those resources; and to develop partnerships and recruit volunteers to get the job done. "Windows of the Past" contributed thousands of person-hours of work to heritage projects. Historic cabins, lighthouses, bridges, and archeological sites were stabilized and protected, making hundreds of new recreational and educational opportunities available and providing interpretive services to improve visitor experiences.
In 1991, the "Passport in Time" initiative offered national forest visitors an opportunity to work with professional archeologists and historians on excavation and restoration projects, oral history collections, and surveys. In that year, 600 volunteers contributed 21,000 hours on 49 projects nationwide. By 1993, national forests had 1,300 volunteers working on 92 projects. Because volunteer interest was so strong, a second season of archeological and historical excavation and restoration offered 15 to 20 winter projects. In 1994, the Passport in Time recruitment brochure for the summer-fall season invited volunteers to assist with 86 projects on 62 national forests (Schamel 1994). During 1994, some 1,200 volunteers contributed more than 57,000 hours to 120 Passport in Time projects on 68 national forests (USDA Forest Service 1995d).
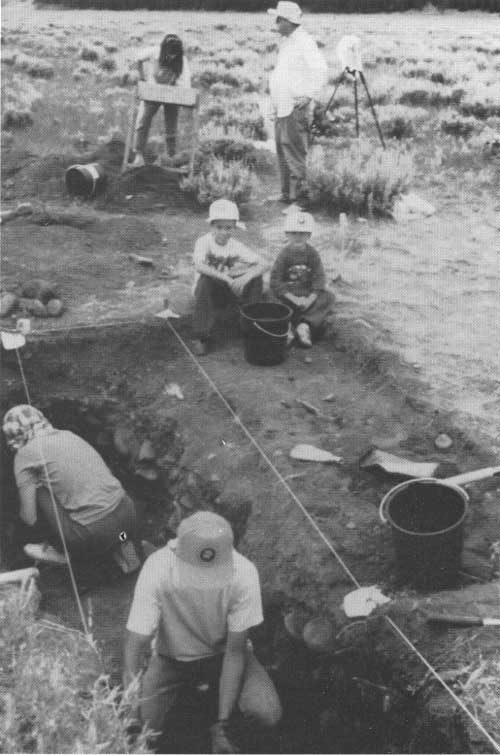
|
| Volunteers assist at a Passport in Time project site in Strawberry Valley, Uinta National Forest, Utah. (USDA Forest Service Photo.) |
Trails
In 1980, there were more than 101,000 trail miles on national forests, including 301 national recreation trails totaling more than 3,500 miles and parts of eight national scenic or historic trails. National forests administered two of the latter: the Pacific Crest and the Continental Divide National Scenic Trails (USDA Forest Service 1981b). By 1987, national forests included parts of 17 national scenic on historic trails and administered four of them. The additional trails were the Nez Pence National Historic Trail (1,170 miles), designated in 1983, and the Florida National Scenic Trail, (1,300 miles), designated in 1986 (USDA Forest Service 1981-1987).
During the period of retrenched outdoor recreation funding, actual useable trail mileage declined to less than 100,000 miles, even though the total miles of trail built and rebuilt exceeded 6,000 miles. The decline was due to reduced maintenance support and a 36-percent reduction in trail construction and reconstruction funding. During this period, trails that could not be maintained to acceptable standards were simply closed. Human resource programs and volunteers built or rebuilt fully a third of the total trail miles (USDA Forest Service 1981-1987). As the new National Recreation Strategy was implemented, trail construction and reconstruction funding increased each year, and by 1994 was four times its average early-1980's level (USDA Forest Service 1994f). Trail maintenance was likewise improved. Many closed trails were reopened. By 1994, the total available trail miles had risen to more than 121,000 miles (USDA Forest Service 1987-1995).
National forest trails were used by cross-country skiers, hikers, horseback riders, offroad vehicle riders (including motorcyclists and snowmobilers), bicyclists, and recreationists with disabilities. RVD use of trails rose from about 21 million per year in the early 1980's to 30 million in 1993 — from less than 9 percent to more than 10 percent of total RVD's. Trail rehabilitation, together with the creation of loop trails to access vistas and historical sites, and joining forest trails with urban park trails were among the trail construction priorities (USDA Forest Service 1981-1995).
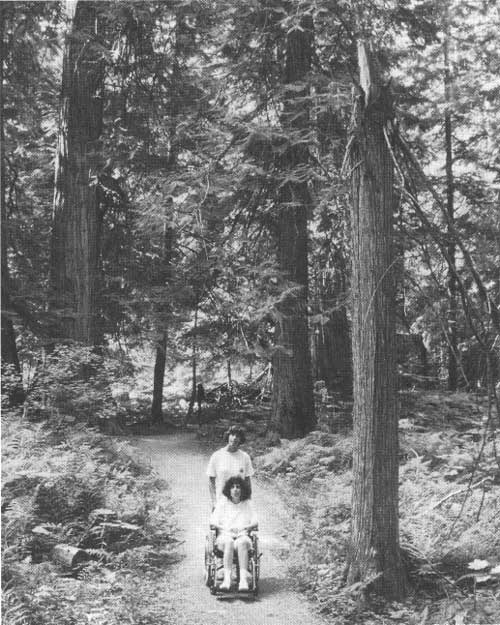
|
| Visitors enjoy giant Ross Crest Cedars on the Kootenai National Forest in Montana, 1992. (USDA Forest Service Photo. Taken by Jim Hughes.) |
Tread Lightly
The Forest Service and the BLM developed the "Tread Lightly" initiative to educate motorized equipment users about proper trail and primitive road use and care. It received strong support from organized offroad vehicle (ORV) users, vehicle manufacturers, and other public land management agencies. In 1990, the Forest Service, the BLM, ORV use organizations, vehicle manufacturers, conservation groups, and ORV users successfully founded a nonprofit, privately funded educational corporation, Tread Lightly, Inc., that promotes environmentally sound ORV use on public and private lands. It also produces and distributes outdoor conservation ethic brochures to ORV users (USDA Forest Service 1987-1995).
Leave No Trace
In 1992, the Forest Service joined the BLM, the National Park Service, the Bureau of Reclamation, and the Fish and Wildlife Service in the "Take Pride in America" campaign to expand the scope of the "Leave No Trace" program — a Forest Service-initiated user ethics program directed primarily to backcountry users. These agencies developed a memorandum of understanding with the National Outdoor Leadership School to explain the "Leave No Trace" ethic to Forest Service employees and public-land visitors engaged in nonmotorized recreation activities. It emphasizes responsible wildland use among urban populations and encourages training and research on proper practices to minimize wildland use impacts. This led to the establishment of a nonprofit, privately funded education corporation, Leave No Trace, Inc., in 1995.

|
| Family and friends enjoy a nature trail specially designed for comfortable travel by persons with visual or other disabilities, George Washington National Forest, Virginia, 1991. (USDA Forest Service Photo. Taken by Tom Iraci.) |
Wild, Scenic, and Recreational Rivers
At the beginning of 1980, there were 23 designated river segments in the National Wild and Scenic River System, totaling almost 2,300 miles. By 1993, the National Wild and Scenic River System had grown to 153 rivers or river segments, totaling 10,410 miles. National forests managed 96 of these rivers or river segments, totaling 4,316 miles, or more than 41 percent of the National Wild and Scenic River System mileage. Thirty-two percent of this mileage was on wild rivers — about a quarter of all wild river segments in the national system (USDA Forest Service 1994e). National forests managed 27 percent of all scenic rivers. The balance of national forest-managed wild and scenic river segments are called recreational rivers. (National Park Service 1994).
The National Forest System's goal in managing wild and scenic rivers is to enhance the qualities that led to their designation and avoid any degradation. This goal permits recreation activities, a variety of agricultural practices, and residential development on non-Federal lands within designated river corridors. It informs users about the care of designated river segments and alerts them to respect other property owners' rights. A permit system is used to keep the use of the most popular wild, scenic, and recreational river segments within their carrying capacities (U.S. Geological Survey 1992).
Special Recreation Areas
At the beginning of 1980, there were eight national forest national recreation areas and two special management emphasis areas. By 1994, there were 51 legislatively designated special recreation areas with a total of more than 8.4 million acres. The 41 additional areas included 11 national recreation areas, 7 national scenic areas, and 4 national monuments. Six of the new national recreation areas were located in the East and the South, with the balance in the West. The national scenic areas were located in California, Georgia, Virginia, and Washington (one area each) and in Oklahoma (two areas). The seventh, the Columbia River Gorge National Scenic Area, included parts of national forests in Oregon and Washington.
The four national monuments were Admiralty Island and Misty Fiords on Alaska's Tongas National Forest, dedicated in 1980; the Mount St. Helens National Volcanic Monument on Washington State's Gifford Pinchot National Forest, dedicated in 1989; and the Newberry National Volcanic Monument on Oregon's Deschutes National Forest, dedicated in 1991. The remaining 19 additions were designated as special emphasis areas to respond to local rather than national interests. Ten were very unique roadless areas on Alaska's Tongas National Forest that had failed to achieve wilderness designation. Others were in the Lake Tahoe Basin Management Area in California, the Oregon Cascade Recreation Area, the Green Spring Special Management Area in Missouri, and the Lee Metcalf Recreation and Wildlife Area in Montana. The legislative dedication of these special recreation and management areas ensures priority management attention to their recreational use and qualities and that other uses will not detract from them.
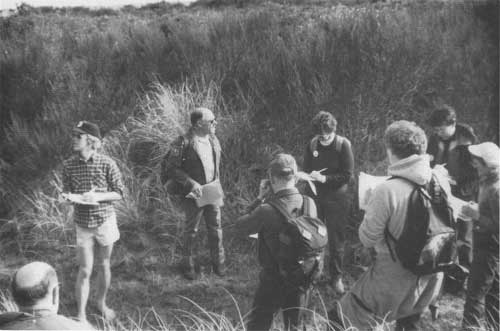
|
| National forest interpretive specialist leads workshop on the Oregon Dunes National Recreation Area, Siuslaw National Forest, Oregon, 1987. (USDA Forest Service Photo. Taken by Sam Frear.) |
Wilderness, wild, scenic, and recreational rivers and special area designations, together with the extension of the trail system and the many components of the National Recreation Strategy, gave outdoor recreation management the strongest, most aggressive thrust yet experienced in 90 years of managing national forest use. They were accompanied by informational and educational efforts that addressed the multiple-use aspects of national forest management and aggressively sought to improve the public's understanding of the management of multiple uses.
Law Enforcement
The rapid visitor use expansion brought increased law enforcement responsibilities — a challenge that was met, in part, by educating the public about national forest use and care. The Forest Service revised public use regulations to make them more understandable and less burdensome to users and to improve the protection they provided to national forest resources, property, and employees.
National forest managers carried out Federal laws on national forests. Local law enforcement officers, primarily county sheriffs, protected visitors and their property. During the 1980's and early 1990's, the Forest Service compensated about 400 law enforcement agencies out of some 750 eligible jurisdictions for the help they provided under the cooperative law enforcement program (USDA Forest Service 1981-1995). Law enforcement incidents and violations grew throughout the 1980's and 1990's, but the most rapid growth occurred after 1988. Reported incidents and violations rose from about 5,000 per year in 1988 to 112,000 in 1992. Violations included vandalism, timber theft, wildland arson, unlawful removal of archeological artifacts, prohibited vehicle use, illegal occupancy and use (including the cultivation and manufacture of illegal drugs), and activities hazardous to user health and safety. About 170 special agents and 600 uniformed civil law officers performed investigations and enforcement. In the first half of the 1980's, the Forest Service sent more than 100 employees per year to the Federal Law Enforcement Training Center for high-quality law enforcement courses such as "Criminal Investigation" and "Law Enforcement for Land Management Agencies." The Forest Service staffed three instructor positions at the center to plan and offer interagency courses. In the early 1990's, the Forest Service was sponsoring basic and advanced law enforcement training for 300 to 500 staff and line people per year.
The investigation and prosecution of vandalism to archeological and cultural resources, pollution, illegal digging, and theft began in the mid-1970's and remained a great and growing concern through the 1980's and early 1990's. In 1986, for example, the Utah interagency task force cooperated with national forest officers to recover some 300 items of archeological significance, including 14 baskets valued at a quarter of a million dollars.
Marijuana Cultivation on National Forests
Illegal marijuana cultivation became a problem and concern on national forest lands in the late 1970's. The primary concern was the risk national forest visitors, contractors, and employees encountered from the growers tending or guarding their high value, illegal crops. Despite Forest Service efforts to eradicate it, the area cultivated on national forests grew rapidly, from an estimated 220,000 acres in 1980 to more than 1.5 million acres in 1982. In 1983, the area cultivated had been reduced by more than 50 percent, to 692,000 acres, through eradication efforts. Sustained effort further reduced the area to 573,000 acres in 1984. But in 1985, the acreage almost doubled, to 946,000 (USDA Forest Service 1981-1995).
The enactment of the National Forest Drug Control Act of 1986 strengthened the Forest Service's role in marijuana eradication. It authorized the arrest of people suspected of producing illicit drugs on national forest lands. Between 1986 and 1989, the Forest Service apprehended 200 to 250 suspects per year and destroyed 200,000 to 250,000 marijuana plants. In the 1990's, the marijuana investigation intensified. By 1993, more than 600,000 plants were being eradicated annually from more than 8,000 sites. There were more than 1,000 arrests per year. By 1994, a total of 1,800 special agents and 433 full-time law enforcement officers were performing investigations and enforcement activities (USDA Forest Service 1981-1995).
Wildlife and Fisheries Management
In the 1980's and 1990's, the National Forest System provided a wide variety of habitats for more than 3,000 species of birds, mammals, reptiles, fish, and amphibians, and for more than 10,000 plant species. During the first half of this period, wildlife and fisheries management focused on maintaining the viability of native vertebrate populations. This involved protecting special habitats such as old growth, riparian areas, trout streams, snags, and wetlands, and ensuring the productivity of selected species such as elk, deer, turkeys, bear, and salmon for recreational and commercial uses. It also required preparing recovery strategies for threatened and endangered species such as the bald eagle, red-cockaded woodpecker, northern spotted owl, grizzly bear, black-footed ferret, and others. The number of listed threatened and endangered animal and plant species occurring on national forests rose from 90 in 1980 to more than 290 in 1995. Three basic strategies were used to achieve this objective: multiple-use management coordination with timber, range, and mineral management to ensure the consistent application of practices with wildlife and fishery uses and objectives on the disturbed lands; habitat investments to mitigate the offsite impacts of other resource activities; and targeting conservation and recovery strategies to address the needs of threatened, endangered, and sensitive species (USDA Forest Service 1981-1995).
During most of the 1980's, the full integration of wildlife and fisheries management with timber, range, and mineral resource activities received the highest priority. For example, when wildlife and fishery staffing and funding were reduced between 1980 and 1986, staffing and direct funding for resource coordination and integration and threatened and endangered species actually increased. The reductions occurred in direct habitat improvement funds. Some reductions were offset by increased use of KV-funded wildlife and fishery improvements. These rose from 49,000 acres in 1980 to 200,000 acres by 1986. KV funding and intensified coordination for wildlife and fishing purposes made timber management a particularly important factor in meeting deer, elk, and turkey habitat objectives. Some timber sales, for example, were planned to improve elk habitat by harvesting in areas that would provide forage closer to cover. National forest elk populations increased by 70,000 through this period. The declines in white-tailed and mule or black-tailed deer, mountain goat, and black bear populations bottomed out in 1980, and these species were on the increase by 1987. Moose, caribou, pronghorn, antelope, bighorn sheep, and mountain lion populations continued their upward trend on national forest lands through the 1980's (Thomas 1988).
Management Practices: 1980-1986
The total direct habitat improvement treatments, including those funded by KV, declined from a peak of more than 600,000 acres in 1980 and 1981 to 350,000 acres in 1986. These acres do not include resource protection and mitigation achieved through multiple-use coordination and integration efforts that modified timber, range, and mineral management practices to meet wildlife and fishery objectives (USDA Forest Service 1981-1987). Forty percent of such coordination and habitat improvement was associated with timber management activities (USDA Forest Service 1982a). Nearly 85 percent of the direct practices and treatments maintained and improved habitats for wildlife populations with a strong public hunting demand: elk, bear, deer, wild turkey, grouse, waterfowl, squirrel, and other small game species. Prescribed burning, one of the least costly habitat treatments, accounted for the largest amount of acres treated. It improved forage for mule deer and elk in the West and white-tailed deer in the East and South.
Wildlife managers on Lake States, Southwest, and California national forests implemented wetland habitat improvements, including nesting islands and sites, and created and enlarged ponds. In 1984, when Ducks Unlimited, Inc., desired to expand their waterfowl habitat protection and improvement activities to public lands, the USDA entered into a memorandum of understanding to authorize cooperative projects funded by Ducks Unlimited on national forest wetlands. The first three cooperative wetland habitat improvement projects were completed on Minnesota's Chippewa National Forest. In 1985, Ducks Unlimited entered into a cooperative agreement to install 200 artificial islands as nesting habitat for the dusky Canada goose on ponds in the Copper River Delta on Alaska's Chugach National Forest, where the 1964 earthquake and tidal flooding had destroyed existing natural waterfowl nesting sites (USDA Forest Service 1985).
In 1986, Congress enacted the wildlife and fisheries Challenge Cost-Share program. More than 100 conservation organizations participating in the program's first year, 1986, contributed $2 for each $1 of Federal funding, or $67 million in money, materials, and services. Among the first of the Challenge Cost-Share projects was one improving 4,000 acres of bighorn sheep habitat in the Wyoming and Colorado Rockies. Cooperators included the Foundation for North American Wild Sheep, Martin Marietta Aerospace, the Colorado Division of Wildlife, the Wyoming Game and Fish Department, and the Rocky Mountain Bighorn Sheep Society. Cooperators participated in a wide range of projects that included forest habitat improvements for deer, elk, grouse, turkey, songbirds, and other forest mammals; wetland development; reintroduction of the peregrine falcon; nest-box construction; road closures to protect bald eagle nests; and wild turkey and grouse openings (USDA Forest Service 1987b).
Fisheries Management
National forest fisheries and aquatic resources are located in 42 States and Puerto Rico. They include 200,000 miles of streams and rivers; 2.2 million acres of ponds, lakes, and reservoirs; and 16,500 miles of coasts and shorelines. National forest waters provide habitats for salmon, trout, catfish, pike, muskellunge, bass, walleye, and sunfish, as well as for hundreds of nongame species. In California, Oregon, Washington, and Idaho, for example, national forests provide more than 50 percent of the freshwater spawning and rearing habitat for anadromous fish on 15,000 miles of streams. In Alaska, 27 percent of the freshwater habitat for salmon and steelhead is located in 30,000 miles of national forest streams (USDA Forest Service 1988c).
Fishery habitat improvements annually involve habitat work on 10,000 to 20,000 acres, and installing 3,000 to 5,000 habitat improvement structures. Managers target anadromous, cold-water, and warm water fish habitats, mainly for salmon and steelhead, trout, and bass. In response to 1980 RPA policy direction, anadromous fish habitat improvement in Alaska, California, Oregon, Washington, and Idaho received the highest priority. Management practices included stream habitat development, providing for fish passage to upstream habitats, and lake fertilization. In the Columbia River Basin, the Bonneville Power Administration supplemented national forest investments. In the Southern Region, a conservation camp for fishery and wildlife volunteers was established with a cost-share grant. Working with the conservation groups and State fish and game agencies, volunteers restored numerous stream habitats destroyed or damaged by 1985 floods and installed fish attractors in lakes and reservoirs. Fishery management coordination and integration with other resource activities protected fish and wildlife habitat areas from erosion and sedimentation and protected riparian areas and streambanks.
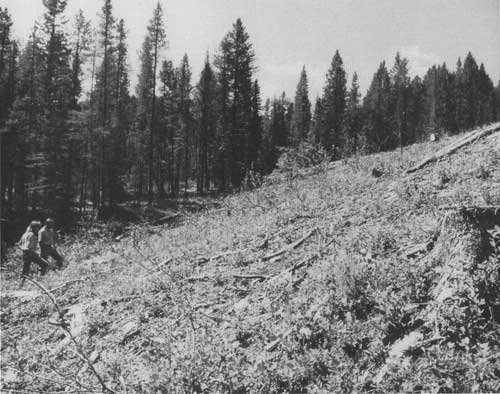
|
| Forest workers checking for buffalo berry bushes, essential forage for grizzly bears, Lewis and Clark National Forest, Montana, 1990. The unit was harvested in 1989 to encourage buffalo berry. (USDA Forest Service Photo. Taken by Jill Bauermeister.) |
Threatened and Endangered Species
Nationally listed threatened and endangered animal species on national forest lands rose to 141 in 1986 — 30 percent of all U.S. listed species. This growth in the number of listed species was more an outgrowth of the increasing emphasis on endangered species protection and improved wildlife and fisheries inventories than habitat degradation.
By 1986, national forest managers had written 60 ESA-required draft or final recovery plans for these species. Each year, about 10 percent of the habitat improvement work (35,000 acres) was targeted to protect listed species. Management emphasis, however, was concentrated on about 10 priority species. The bald eagle and the peregrine falcon received national emphasis and the grizzly bear, spotted owl, and Puerto Rican parrot regional emphasis. Other emphasized species were the mountain caribou, California condor, Kirtland's warbler, Lahontan cutthroat trout, and Oregon silver spot butterfly, as well as several plant species (USDA Forest Service 1981-1987).
Bald eagle populations were stabilized or increasing on most national forests due to proper management of their nesting and wintering sites and retention of suitable habitat. Populations of peregrine falcons were also increasing as a captive-breeding and stocking program reintroduced them into unoccupied habitats in California, Colorado, Arizona, New Mexico, Minnesota, and New Hampshire. Declining residual levels of DDT and other persistent chlorinated hydrocarbon pesticides, a result of the U.S. ban on their use, reinforced these efforts. Eggshell thinning attributed to such pesticides was being reduced in many areas.
In the early 1980's, grazing allotment plans on national forests in Idaho were revised to protect grizzly bears and their habitats. In Montana, national forests changed road designs and closed roads to protect both grizzly bear and gray wolf habitats. In 1983, the Northern, Intermountain, and Pacific Northwest Region national forests were emphasizing grizzly bear management with policy support from the Departments of Agriculture and the Interior. The Departments co-signed a memorandum of understanding establishing a national interagency grizzly bear committee to encourage and implement grizzly bear recovery. To protect both backcountry users and grizzlies, national forests undertook an intensive information campaign on proper human conduct in grizzly habitats to reduce conflicts between bears and humans and eliminate unnecessary killing of grizzlies. The mapping of grizzly bear habitat rose to more than 2 million acres per year by 1986. Interagency guidelines approved for grizzly bear management were implemented in 1987.
In the Southern Region, census and monitoring techniques for the red-cockaded woodpecker were improved. In California, a combination of land purchases; road, trail, and campground relocations; and public access restrictions protected the California condor and its habitat. In Michigan, 1,000 acres of habitat were improved for the endangered Kirtland's warbler, a songbird which nests only in young Jack pine stands (USDA Forest Service 1981-1987).
Threatened, endangered, and sensitive species staffing increased from 19 to 47 FTE's between 1979 and 1986 (USDA Forest Service 1994f). In addition to implementing special management practices for listed species, regional foresters identified "sensitive species" and coordinated and integrated management to help ensure the continued viability of their populations with an emphasis on avoiding impacts that would cause them to become threatened or endangered.
Wildlife and Fishery Use: 1980-1986
>WFUD's, like RVD's, declined from their peak of 34.9 million in 1981 to 32.0 million in 1986 — an 8.3-percent decline — slightly more than the decline for total RVD use. The causes were probably much the same as for RVD's — reduced leisure time, a shift to shorter vacations and holiday trips to places closer to home, and an increase in households where both parents worked outside the home. The decline occurred in hunting, fishing, and nonconsumptive wildlife and fish uses and was reflected in all sub-sectors: big game, small game, and waterfowl hunting, and in both cold-water and warm-water fishing (Flather and Hoekstra 1989).
Wildlife and Fishery Habitat Relationships: Modeling Efforts
During the 1980's, a considerable effort was directed toward developing new wildlife and fishery habitat relationship models to determine the cumulative effects of wildlife and fishery habitat changes and to evaluate wildlife and fishery population viability standards. This required expanding habitat capability models to include more species and areas. Habitat capability models integrated wildlife and fishery objectives into the management and use of other resources. They also made it possible to quantify wildlife and fishery resource relationships in ways that provided more reliable and consistent information for conserving biodiversity, managing viable populations, managing featured species habitat, and producing wildlife and fish to meet public demand.
The Northern Region developed a model to assess the cumulative effects of sediment on fish populations on Montana and Idaho national forests. Alaska's Tongas National Forest developed two types of models to improve Sitka black-tailed deer habitat planning and management. National forest planning and management in Washington and Oregon used a spotted owl assessment model. By 1987, the National Forest System was using 21 habitat capability models to evaluate wildlife and fish habitat relationships (USDA Forest Service 1981-1987).
In the following years, the wildlife and fishery habitat relationship program, housed at Utah State University in Logan, continued to work with national forest wildlife and fisheries managers and Forest Service Research to improve the wildlife and fishery habitat relationship models. In 1992, this program developed new wildlife, fish, and rare plant inventory techniques for habitat evaluation models that provided more accurate habitat capability assessments. It assisted field units in developing databases and geographic information system applications to monitor and inventory habitat conditions. The wildlife and fishery habitat relationship program also offered entry-level and mid-career professionals continuing education on state-of-the-art information and technical skills. In 1992, they offered courses on basic surveys and their application, program management for biologists, and management of forest structure and composition to 430 Forest Service, BLM, and State biologists (USDA Forest Service 1987-1995).
Wildlife and Fishery Management and Use: 1987-1995
After 1986, wildlife and fishery management shifted toward a more holistic approach to maintaining and managing healthy ecosystems. This approach considered the broaden dimensions of ecosystems in project activities and management. It involved more aggressive pursuit of goals for producing wildlife and fish; protecting threatened, endangered, and sensitive species; and providing hunters, anglers, amateur naturalists, photographers, and all other national forest users more attractive opportunities. National forest wildlife and fishery management staffing increased in all activities, rising from 854 FTE's in 1986 to 2,231 in 1994. Funding increased from $48 million in 1986 to $121 million in 1994 (in constant 1994 dollars) (USDA Forest Service 1994f).
Specific programmatic titles were introduced for many wildlife and fishery activities and publicized with colorful brochures to encourage public use, participation, and support for national forest wildlife and fisheries. "Rise to the Future" was launched in 1987 to market fishing opportunities, communicate fish habitat improvement opportunities, and elevate fish habitat management awareness, both internally and with fishery cooperators. "Get Wild" achieved similar objectives for wildlife habitat improvement and use. "Every Species Counts" focused internal Forest Service and public interest on maintaining and improving threatened, endangered, and sensitive species habitats.
As public communication and participation and funding improved after 1986, the total acres of annual habitat improvement rose from 355,000 acres to nearly 450,000 acres per year in the early 1990's. WFUD's use rose from 32 million in 1986 to 36.3 million in 1993. The rate of increase in WFUD's was less rapid than that for total RVD use, but still nearly twice as great as national population growth.
Fisheries Management
The "Rise to the Future" program, initiated in 1987, provided for more effective fishery management, encouraged fishing on national forests, and ensured equal consideration of fisheries with other national forest resources. To implement this new emphasis, the number of national forest fish biologists was increased by 34 percent over 2 years (1986 to 1988). By 1995 there were 374, an average of three fishery biologists per national forest (USDA Forest Service 1990a, 1995a). Rise to the Future focused on System-wide use of BMP's, relied on cumulative effects analyses to identify the positive and negative effects of land use and management on fisheries, and resulted in improved aquatic inventory and classification methods and expanded inventory and classification work.
National forest resource managers pursued and strengthened partnerships with States, Federal agencies, tribal governments, conservation groups, and other interested public organizations, all of which expanded their participation and share in funding and implementing habitat improvements. Volunteers also participated in fish habitat improvement. One of the early Rise to the Future projects was a massive effort to restore Canyon Creek on Arizona's Tonto National Forest — an effort that involved working with ranchers on livestock control, riparian fencing, willow and cottonwood plantings, and many stream habitat structures built with large logs and bolts of wood. Several hundred volunteers and partners worked on this project. In 1987, on Idaho's Boise National Forest, the concerned participation of Gem State Fly Fishers and Idaho Salmon and Steelhead Unlimited members halted erosion along 200 feet of Johnson Creek, which was delivering sediment into the South Fork of the Salmon River's prime spawning and rearing habitat for summer Chinook salmon (USDA Forest Service 1988b).
In 1964 and 1965, large storms caused massive landslides that dumped approximately 240,000 tons of sediment into the South Fork of the Salmon River, causing catastrophic damage to Chinook salmon spawning and rearing habitat. By 1990, an average of 78 percent of the accumulated sediment storage (since 1965) over the entire river system had been reduced. There were even greater reductions in such key spawning areas as the Poverty Reach, where sediment deposits were reduced by 89 percent (Lee et al. 1993). Comparisons of the long-term trends in the number of redds (spawning nests) in the South Fork with those on the less-disturbed Middle Fork of the Salmon River and Johnson Creek, a major tributary of the South Fork, revealed that stresses from downriver sources were the probable dominant causes of the long-term decline in returning spawning salmon and redd counts in all three streams and the entire Salmon River system — regardless of landslide activities in the associated watersheds. (The Middle Fork is located largely within the Frank Church — River of No Return Wilderness and its watershed had not been roaded or logged; Johnson Creek's watershed had fewer roads and much less logging than the upper South Fork). All three streams showed similar long-term trends in the decline of redd counts between 1957 and 1991. Except for the catastrophic decline on the South Fork after 1964, they also had similar levels of redd counts in the latter years of the 1957 to 1991 study period. The Idaho Department of Fish and Game maintained records of the number of redds constructed each year for all three streams (Lee et al. 1993).
In 1988, efforts with the New Mexico Department of Game and Fish, New Mexico State University, and the Fish and Wildlife Service on New Mexico's Gila National Forest improved the endangered Gila trout's recovery process by introducing it into the waters of the Trail Canyon area. This cooperative effort nearly doubled the Big Thompson River's fish productivity by installing 4S habitat structures in seven stream sections and accelerating natural vegetation by planting willow shoots on streambanks (USDA Forest Service 1989c). In 1989, the Mississippi Department of Wildlife, Fisheries, and Parks; the Chickasaw Bass Club; and Lunkers Unlimited Bass Club installed fish cover and spawning gravel structures made of concrete blocks, tires, and treetops, which increased the catch of larger fish and doubled the catch per angler on Davis Lake (200 acres) and Brentes Lake (50 acres) on the Mississippi national forests (USDA Forest Service 1990b). The average annual level of fish habitat improvements during the first half of the 1990's rose to 23,000 acres per year and 10,000 structures — about double the average annual achievements in the 1980's of 12,000 acres per year and 5,000 structures (USDA Forest Service 1981-1986, 1987-1995).
Every Species Counts
"Every Species Counts" was introduced in 1990 to intensify the management of national forest habitats for threatened, endangered, and sensitive species by bringing the resources, energy, and commitment of the Forest Service, other Federal agencies, State resource departments, private organizations, and individuals together. This initiative implemented a 1989 task force plan to match the management effort for improving the recovery and conservation of threatened, endangered, and sensitive species with the urgency of the challenge. In that year, listed species with habitats on national forests rose to 171 — 30 percent of the total U.S. listed species. By then, regional foresters had designated more than 900 sensitive species that needed special management coordination to avoid their listing as threatened or endangered. This high proportion of listed and sensitive species with national forest habitats often reflects the better survival of such species in, or their retreat to, the undeveloped and less fragmented habitats found on many national forests. In 1994, the number of listed species with national forest habitats rose to 283 — 31 percent of the 919 U.S. listed species: 110 plants; 52 fishes; 40 snails, mussels, and crustaceans; 31 birds; 27 mammals; 14 reptiles and amphibians; and 9 insects. By 1993, regional foresters had designated more than 2,300 sensitive species (USDA Forest Service 1987-1995, 1993a).
Staffing for threatened, endangered, and sensitive species management increased enormously from 47 FTE's in 1986 to 590 FTE's in 1994 — more than 12 times the 1986 staffing. Funding increased similarly from $3 million in 1986 to nearly $39 million in 1994 (constant 1994 dollars) (USDA Forest Service 1994f). The average annual habitat improvement for listed and sensitive species rose from 35,000 acres per year in the mid-1980's to nearly 100,000 acres per year in the mid-1990's (USDA Forest Service 1981-1995). The number of structures installed to improve listed and sensitive species habitats rose from a few hundred per year in 1986 to more than 2,800 per year in 1994. The number of threatened and endangered species recovery plans rose from 80 in 1987 to more than 150 in 1993. Recovery strategies were developed for listed species where specific ESA recovery plans were not required.
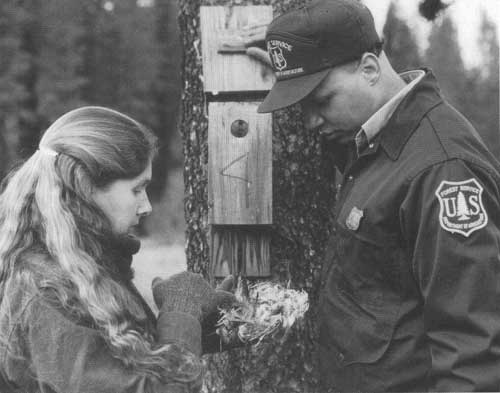
|
| Mt. Hood National Forest, Oregon, wildlife biologists examining feathers from a nestbox during a survey to determine which species used the nestbox. (USDA Forest Service Photo. Taken by Tom Iraci.) |
Protecting Endangered Species After Natural Disasters
The Puerto Rican parrot, found only on Puerto Rico's Caribbean National Forest, is the last native parrot in the United States and its territories. In 1972, this species had been reduced to a single population of 14 birds. Most of the parrot's old-growth tropical forest habitat had been destroyed by the island's development activities. Predators, low numbers, and lack of nesting sites hampered the reproduction of the remaining birds. Forest Service research scientists and Fish and Wildlife Service and Forest Service biologists have worked together to provide suitable parrot nesting sites and reduce predation and competition from the pearly eyed thrasher by modifying natural cavities and installing artificial nest structures. Cavities are closed during the summer months to prevent honeybee swarms from using them. Captive birds have been bred to produce young parrots that have been substituted for wild chicks in the nest (cross-fostering) to improve genetic diversity. In 1989, when this endangered species population had grown to 47 birds, it was suddenly and drastically reduced to 23 by Hurricane Hugo — which severely altered half of the parrots' prime habitat (USDA Forest Service 1993a, 1994a). Since Hugo, researchers and national forest managers and biologists have attempted to rehabilitate the species damaged habitat, and the number of wild birds has increased to the pre-hurricane level. Six wild breeding pairs have nested successfully. Half of the breeding population has used the improved or artificial nesting structures (USDA Forest Service 1993a).
Hurricane Hugo also damaged South Carolina's Francis Marion National Forest, where it devastated the habitat of the second largest population of the endangered red-cockaded woodpecker — the only population growing in numbers. In some colonies, hurricane winds snapped nearly 90 percent of the trees that held woodpecker cavities. In 1990, the year after the hurricane, about 70 percent of the total red-cockaded woodpecker population had disappeared. The Francis Marion immediately undertook a crash effort, using creative substitutes, to provide the birds with new nesting and roosting cavities. Techniques ranged from drilling completed cavities and start holes that the birds could enlarge to cavity size, to installing cedar blocks with predrilled cavities into holes cut into standing trees. In 1994, 66 percent of all red-cockaded woodpecker nests were in these artificial cavities. The number of adult birds increased from the post-hurricane level of 579 in 1990 to 775 in 1992 (USDA Forest Service 1993c, 1994a).
Habitat Management for Endangered Species Reintroduction and Recovery
In 1992, the Nebraska National Forest completed a survey to determine the presence of black-footed ferrets on national forest lands. Reintroducing them was assessed in an EIS. Although once found throughout the Great Plains of North America, the black-footed ferret by 1991 existed only in captivity and in one group that had been released to the wild in that same year. Black-footed ferret colonies depend on prairie dogs for 80 percent of their food supply and rely entirely on empty prairie dog burrows for shelter and to rear their young. The Nebraska National Forest evaluated four units suitable for ferret reintroduction and conducted a public forum on the reintroduction process. (USDA Forest Service 1993a, 1993c).
PACFISH Strategy for Endangered Salmon Emerges in the Pacific Northwest
In 1991, the American Fisheries Society assessed the viability of more than 400 Pacific salmon and steelhead stocks dependent upon spawning habitats in Washington, Oregon, California, and Idaho (Nehlsen et al. 1991). (A stock is defined as a group of fish that spawn on a particular river system or segment during a particular season and that do not interbreed to any substantial degree with any other group of fish.) This study reported that 24 percent of the stocks had become extinct; 23 percent were at high risk of extinction; 13 percent were at moderate risk; 12 percent were of special concern — not presently at risk, but probably in decline from known threats; and 27 percent secure — stable or increasing stocks not subject to any known threats. The report found that about 170 of the high risk, moderate risk, and special concern stocks were associated with national forest streams and lands. Of those, four stocks were listed as endangered. National forest managers had identified other stocks as sensitive.
The 76 stocks found on national forests and rated as high risk for extinction, but not federally listed, occurred in 51 stream systems on 16 national forests. The causes of these declines varied by species and location, but generally reflected some combination of hydroelectric development and operation, over-fishing, hatchery influences on disease and genetic fitness, and habitat conditions. In 1992, the importance of this issue to a wide diversity of interests led the Forest Service to develop a coordinated, comprehensive strategy for managing Pacific salmon and steelhead habitats on national forests throughout the Pacific Northwest and Alaska. National forest managers manage half of the freshwater anadromous fish spawning and rearing habitat in the lower 48 States and more than a quarter of such habitat in Alaska. For stocks threatened by factors other than habitat, the quality of national forest habitats would play an important role in moderating their rate of decline and provide time to resolve the primary problems associated with hydroelectric operations, hatcheries, and fish harvests (Pacific Salmon Work Group and Field Team 1992).
After 1992, as more salmon were federally listed as threatened or endangered, the Forest Service joined with BLM to develop the PACFISH strategy. Using available science, PACFISH took a proactive ecosystem approach to managing anadromous fish habitats in the Columbia and Snake River systems of eastern Oregon and Washington, Idaho, and parts of California. Riparian corridors along sensitive streams were managed under interim conservation guidelines while researchers identified ways to restore and sustain the ecological processes that gave rise to the once-thriving salmon habitats and populations (USDA Forest 1994e).
It is clear that threatened, endangered, and sensitive species management has become an important component in implementing an ecosystem approach to managing multiple uses on national forests. The conservation of species is central to sustaining ecosystems. Accommodation of multiple uses makes this an extremely complex task. With the current limitations of available ecosystem management science, resource management, and recovery strategies for threatened, endangered, and sensitive species, conservation almost always involves exploring still-unknown aspects of species, habitat, and ecological relationships. It also calls for creativity in discovering new ways to manage multiple uses while sustaining healthy air, land, water, and related biological resources and their unique expressions of biodiversity.

|
| District wildlife biologist examining a yellow-breasted chat captured by a mist net used to inventory neotropical migratory birds (mainly songbirds) on the Sam Houston National Forest, 1992. (USDA Forest Service Photo. Taken by Dale Bounds.) |
Get Wild
"Get Wild" was introduced in 1988, with the overall objective to protect and improve habitats for national forest wildlife and to attract the public's broad participation in projects benefitting game and nongame wildlife and wildlife-related national forest recreation opportunities. It expanded cooperative partnerships with Federal and State agencies, wildlife organizations, and other groups and individuals to help inventory and improve habitats, survey and monitor wildlife populations, provide education and instruction programs for forest users, and protect special habitats such as snags and riparian areas.
"Get Wild" was divided into 11 national special emphasis areas that focused cooperator interests on particular species or species groups (USDA Forest Service 1993d). "Eyes on Wildlife" focuses on projects to enhance wildlife viewing and appreciation. In 1990, for example, New Mexico's Cibola National Forest cooperated with the Western Foundation for Raptor Conservation and the Central Rio Grande Chapter of the Audubon Society to construct a 1.5-mile trail to improve public access to the Sandia Mountain Hawk Watching Area, where the public and wildlife biologists could view and record raptor migrations. The Western Foundation for Raptor Conservation provided a brochure describing the role of raptors in the ecosystem. In 1991, a self-guided bird tour was developed on northeastern Colorado's Pawnee National Grassland, an area annually visited by thousands of birding enthusiasts to observe the more than 200 bird species that pass through or nest on the grasslands. Cooperators, including the Greeley Chapter of the Audubon Society, the Colorado Audubon Council, and the Colorado Division of Wildlife, published a tour brochure covering 13 tour route stops and installed interpretive signs at each stop. By 1992, "Eyes on Wildlife" included 114 projects (USDA Forest Service 1991-1993).
"Taking Wing" focuses on waterfowl and wetland habitat projects in cooperation with other Federal agencies, State wildlife and fish agencies, and national, regional, and local conservation groups. Its objective is to improve some 12 million acres of waterfowl habitat found on national forests and grasslands in support of the North American Waterfowl Plan — a cooperative program between the U.S. and Canada to improve waterfowl habitats and prevent declines in waterfowl populations (Ducks Unlimited, no date). In 1989, Alaska's Chugach National Forest, in partnership with the Fish and Wildlife Service and the University of Minnesota, inventoried and described the habitat needs, nesting success, and population trends for trumpeter swans on Alaska's Copper River Delta. This was the first step in identifying management opportunities to reduce the downward trend in trumpeter swan numbers. In the same year, the Kadoka Lake project on South Dakota's Buffalo Gap National Grassland reconstructed a dam to restore a 230-acre lake — the second largest wetland on Federal lands in western South Dakota. Cooperators were the City of Kadoka; Jackson County; the Jackson County Conservation District; the South Dakota Department of Game, Fish, and Parks; and Ducks Unlimited, Inc. The restored lake was projected to produce 2,000 ducks and 250 geese annually and provide habitat for the endangered trumpeter swan. Pheasants and grouse have also benefitted from the improved upland habitat around the lake. (USDA Forest Service 1990b). In 1992, "Taking Wing" had 92 projects under way on the national forests (USDA Forest Service 1993d).
|
| Elk on summer range, Big Horn National Forest, Wyoming, 1993. (USDA Forest Service Photo.) |
The "Animal Inn" emphasis area, an education and information program, was initiated nationally in 1988 to communicate the importance of managing dead standing snags and fallen trees for wildlife habitat. Some 1,200 animal species need these habitats for their life cycles.
"Partners in Flight," a neotropical migratory bird initiative, was introduced in 1991 and by 1992 had 56 cooperative projects under way on national forests and other lands. Numerous State, Federal, and international agencies and more than 20 conservation groups cooperate with the Forest Service to assist in population management, habitat monitoring and improvement, training resource professionals, and providing public educational activities about neotropical migrant bird species nesting in North America and wintering in the Caribbean or Central and South America (USDA Forest Service 1993d). In 1991, for example, Colorado's White River National Forest, through the Forest Service's International Forestry branch, sponsored a biologist employed by the Mexican government in a 6-week program to exchange information about neotropical bird habitat and wildlife management in the United States and Mexico (USDA Forest Service 1992b). The objective is to help reverse the declines that have emerged in many migratory bird populations due, in part, to fragmentation of their breeding grounds in North America and loss of wintering habitat in their southern abodes. In 1992, New York State's Finger Lakes National Forest, in cooperation with Cornell University, established two permanent breeding bird survey plots as a part of 10-State network for monitoring neotropical migratory bird productivity. Six of International Forestry's sister forest programs with national forests and parks in Central and South America have been developed around managing neotropical migrant bird habitats (USDA Forest Service 1993c).
The "Ecosystem Management/Restoration and Special Habitats" theme emphasizes unique species groups and communities. In 1992, the Sitka Ranger District on Alaska's Tongas National Forest undertook thinning at various intensities to restore biological diversity and emulate more mature, unlogged forest conditions. They incorporated gaps, thickets, animal travel corridors, and varied tree spacings to provide year-round habitat for the Sitka black-tailed deer and many other wildlife species. Trees were widely spaced in riparian areas to provide large, woody debris to improve stream habitat. In 1992, almost 1,400 acres were so treated (USDA Forest Service 1993c).
Other theme initiatives focused on particular species. "Making Tracks" focused on projects to improve turkey habitat. Partnership projects for turkey included the designation and management of walk-in turkey hunting areas (80,000 acres proposed) to provide the public an opportunity to hunt turkeys in areas relatively undisturbed by vehicle traffic. South Dakota's Black Hills National Forest undertook turkey habitat improvements to increase burr oak mast production by reducing ponderosa pine competition, releasing larger oak trees, and installing guzzlers. In 1992, there were 127 projects. "Answer the Call" addressed quail habitat needs. "Dancers in the Forest" was the theme of an initiative for grouse and woodcock projects. "A Million Bucks" targeted deer habitat improvement.
"Full Curl" projects focused on habitat for wild Rocky Mountain and desert bighorn sheep. Through this initiative, Colorado's White River National Forest reintroduced bighorn sheep into their historic range, improved their winter range habitats, and improved the basis for their future management by studying existing herds to determine their habitat use and limiting factors. "Elk Country" focused on elk habitat. In Colorado, the San Juan National Forest used prescribed burns to improve elk forage production to reduce elk damage on private lands and maintain the existing elk population. Oregon's Malheur National Forest improved elk summer range habitat by closing more than 63 miles of road and obliterating 29 miles. (USDA Forest Service 1987-1995). Elk habitat projects numbered 144 in 1992.
The total area of habitat improved for wildlife, fisheries, and threatened and endangered species increased on an average of 100,000 acres per year during the early 1990's, with the "Get Wild" initiative producing a third of that increase. By 1995, more than 1,200 national forest wildlife and fishery biologists and 145 botanists, working with thousands of institutional partners and individual volunteers, were providing a creative link to land stewardship for the future. In addition to completing habitat improvement projects each year, they were involved in planning and reviewing thousands of timber sales, range allotment management plans, and mineral cases to ensure that these activities were carried out in ways compatible with wildlife and fishery objectives and conservation of rare plants (USDA Forest Service 1993c, 1995a).
The Growth of Partners in Habitat Management
The number of partners in national forest habitat improvement and management increased from 57 in 1986 and 867 in 1989 to more than 3,000 in 1993. This enormous growth in cooperative, voluntary participation came largely from the incentive provided by the Challenge Cost-Share program and the aggressive thematic initiatives. The traditional partnerships, including the forest cooperative agreements with 44 State fish and game departments and 49 other Federal agencies and conservation groups, increased similarly. The vast majority of new partnerships were with hundreds of sporting organizations, local governments, other State and local agencies, a variety of civic groups, many corporations, and scout troops — who collectively provided the services of thousands of people — and many individual volunteers. These cooperators completed thousands of habitat improvement projects on the national forests. The value of their assistance, materials, and services is summarized in table 11.
Table 11. Wildlife Challenge Cost-Share assistance
| Year | Appropriated Funds | Forest Service Cooperator Share |
Total |
| 1986 | $900,000 | $1,700,000 | $2,600,000 |
| 1987 | 1,700,000 | 3,100,000 | 4,800,000 |
| 1988 | 2,900,000 | 5,200,000 | 8,100,000 |
| 1989 | 6,900,000 | 10,200,000 | 17,100,000 |
| 1990 | 10,300,000 | 12,800,000 | 23,100,000 |
| 1991 | 11,100,000 | 16,900,000 | 28,000,000 |
| 1992 | 11,500,000 | 15,200,000 | 26,700,000 |
| 1993 | 14,300,000 | 19,800,000 | 34,100,000 |
| Total | $59,600,000 | $84,900,000 | $144,500,000 |
Source: USDA Forest Service 1993c. | |||
Cooperators contributed more than $1.42 to wildlife partnership initiatives for every Federal dollar of appropriated funds (USDA Forest Service 1987-1995).
1980 to 1995: A Period of Accelerating Transition and Transformation
in Managing Multiple Uses on National Forest System Lands
For national forest managers, the years between 1980 and 1995 were a period of continuing confrontation and challenge. Special interest groups and individuals continued to take issue with national forest management plans, decisions, and resource management projects through an unrelenting level of appeals and court suits focused heavily on timber management, but not neglecting issues in other resource areas. New resource challenges also emerged as the continuing buildup of forest biomass and related fuel hazards combined with serious drought raised national questions about forest health and the increased risk of catastrophic wildfires. Growing concerns for endangered, threatened, and sensitive species raised new questions about the maintenance of biodiversity and the sustainability of forest and rangeland ecosystems.
National forest managers, responding to these discomforting challenges and confrontations, sought wider and more open and orderly communication and participation with national forest interest groups and users. They also pursued more rigorous interdisciplinary integration of the management of multiple uses and resources and in the protection of the environment. The staffing and funding for wildlife and fisheries management and soil and watershed protection increased, while timber staffing and funding decreased as harvests sharply declined. Cooperative projects and partnerships in implementing wildlife, fisheries, recreation, and cultural heritage management projects saw an unprecedented increase.
In this general way, the transition and transformation of the traditional integrated approach in national forest management for multiple uses accelerated toward a broader and more holistic ecosystem approach. Here, the ecosystem approach and national forest management are mutually seen as the fitting of multiple uses into forest ecosystems according to their ability to support them and their compatibility with each other, in ways that will ensure the sustainability of the ecosystems as well as the multiple uses and benefits for future generations. Implicit in this approach is the understanding and context provided by existing state-of-the-art forest resource management and its underlying science and by the established societal goals and processes for resources management decisionmaking. Chapter 7 describes the 1990's adoption and early implementation of the ecosystem approach in managing multiple uses and multiple benefits on national forests.
References
Barlow, T.J., T. Orr Telford, and T. Steel. 1980. Giving Away the National Forests: An Analysis of Timber Sales Below Cost. Natural Resources Defense Council, Washington, DC.
Bell, Enoch, D. Cleaves, H. Croft, S. Hosati, E. Schuster, and D. Truesdale. 1995. Fire Economics Assessment Report. USDA Forest Service, Washington, DC. 67 pp.
Beuter, J.H. 1985. Federal Timber Sales. Congressional Research Service, Library of Congress, Washington, DC. 140 pp.
Bosworth, Dale, J. Twiss, G. Merrill, D. Barone, and B. Butler. 1990. "Effectiveness of Decisionmaking." Volume 7, Critique of Land Management Planning FS-458. USDA Forest Service, Washington, DC. 24 pp.
Bremen, Vicki A. 1995. Memorandum dated March 13, 1995, to Chief of the Forest Service. Update on Forest Service National Environmental Policy Act (NEPA) Litigation Statistics. USDA Office of General Counsel, Natural Resources Division, Washington, DC. 3 pp with tabular attachment.
Bryant, Art. 1996. Direct communication. Review notes dated April 4, 1996. USDA Forest Service Acting Director for Watersheds and Air Areas, Washington, DC.
Caldwell, Lynton K., C.F. Wilkinson, and M.A. Shannon. 1994. "Making Ecosystem Policy: Three Decades of Change." Journal of Forestry 92:4. Society of American Foresters, Bethesda, MD. Reprint. 4 pp.
Cawley, R. McGreggor. 1990. Radicalism, Politics, and Science on the Public Lands. Paper prepared for the 1990 American Society of Public Administration Convention, Los Angeles, CA. Department of Political Science, University of Wyoming, Laramie. 25 pp.
Clark, Pete. 1996. Direct communication dated March 27, 1996. USDA Forest Service, Range Management Area, Washington, DC.
Clawson, Marion. 1976. "The National Forests: A Great National Asset is Poorly Managed and Unproductive." Science 191:762-767.
Cordell, H. Ken, J.C. Bergstrom, L.A. Hartman, and Donald B.K. English. 1990. Analysis of the Outdoor Recreation and Wilderness Situation in the United States 1989-2040. USDA Forest Service Gen. Tech. Report RM-189. USDA Forest Service, Washington, DC. 113 pp.
Council of Economic Advisors. 1994. Economic Report of the President together with the Annual Report of the Council of Economic Advisors. U.S. Government Printing Office, Washington DC. 398 pp.
Domestic Policy Council Task Force on Outdoor Recreation Resources and Opportunities. 1988. Outdoor Recreation in a Nation of Communities: Action Plan for the American Outdoors. U.S. Government Printing Office, Washington, DC. 169 pp.
Ducks Unlimited. No date. Taking Wing: National Forest System Waterfowl Habitat Management Partnerships. Produced in coordination with the USDA Forest Service. Long Grove, IL. 8 pp. brochure.
Dunlop, George S. 1989. Memo to Dale Robertson, Chief of the Forest Service, dated April 27, 1989.
Emerson, Peter M. 1986. "Below Cost Sales: An Overview of the Issue." Below Cost Timber Sales Conference Proceedings. February 17-19, 1985. The Wilderness Society, Washington, D.C. 266 pp.
Federal Register. 1991. National Forest System Land and Resource Management Planning. Advance Notice of Proposed Rulemaking, 36 CFR 219. USDA Forest Service, Washington, DC. pp. 6508-6538.
Federal Register. 1995. National Forest System Land and Resource Management Planning. Proposed Rule. 36 CFR Parts 215, 217, and 219. USDA Forest Service, Washington, DC. pp. 18886-18932.
Fedkiw, John. 1986. Overview: National Forest System Road Program and Cost Performance: National, Regional and Local Levels 1976-1985 (unpublished report in author's files). USDA Office of Budget and Program Analysis, Washington, DC. 53 pp.
Flather, Curtis H., and T.W. Hoekstra. 1989. An Analysis of the Wildlife and Fish Situation in the United States: 1989-2040. Gen. Tech. Report RM-178. USDA Forest Service, Rocky Mountain Forest Experiment Station, Fort Collins, CO. 146 pp.
Forest Ecosystem Management Assessment Team (FEMAT). 1993. Forest Ecosystem Management. An ecological, economic, and social assessment. U.S. Departments of Agriculture, Commerce, the Interior, and the Environmental Protection Agency. Washington, DC. pp. I-1 to IX-41.
Forest Service. 1994a. Passport in Time 5:1. CEHP, Inc., Washington, DC.
Forest Service. 1994b. "National Forest System Special Recreation Areas." Tabulation dated October 14, 1994. Recreation, Heritage, and Wilderness Resources Area, Washington, DC. 2 pp.
Fowler, Richard F. 1996. Direct communication dated March 22, 1996. USDA Forest Service, Forest Pest Management Staff, Washington, DC.
General Accounting Office (GAO). 1984. Congress Needs Better Information on Forest Service's Below Cost Sales. RCED 84-86. Washington, DC. 46 pp.
Gippert, Michael J., and V.L. White. 1990. "Gateway to Compliance with NFMA, NEPA, and other Federal Environmental Laws." 1990 Forest Plan Implementation, Volume 10, Critique of Land Management Planning. FS-461. USDA Forest Service, Washington, DC. 69 pp.
Glasser, Stephen P. 1996. Direct communication in review notes dated 4/8/96. USDA Forest Service, Watershed and Air Management Area, Washington, DC.
Hoberg, George. 1993. From Logroll to Logjam: Structure, Strategy, and Influence in the Old-growth Forest Conflict. Paper presented to the Annual Meeting of the American Political Science Association, Sept. 2-5, 1993, Washington, DC. Department of Political Science, University of British Columbia, Vancouver. 33 pp.
Howell, Cheri A. 1996. Telephone communication, April 1, 1996. Acting Assistant Forest Supervisor, Humboldt National Forest, Biko, NV.
Humboldt-Toiyabe National Forests. 1996. Decision Reached in U.S. vs. Nye County. News release dated March 14, 1996. USDA Forest Service, Sparks, NV. 1 p.
Larsen, Gary, Larry Holden, Dave Kopaldo, John Leasure, Jerry Mason, Hal Salwasser, Susan Yonts Shepard, and W.E. Shands. 1990a. "Synthesis of the Critique of Land Management Planning." Volume 1, Critique of Land Management Planning. FS-452. USDA Forest Service, Washington, DC. 24 pp.
Larsen, Gary, Robert Lynn, Dave Kopaldo, and John Fedkiw. 1990b. "Analyses of an Emerging Supply Disruption." Vol. 9, Critique of Land Management Planning. FS-460. USDA Forest Service, Washington, DC. 44 pp.
Lee, Danny C., W.F. Megahan, and U.D. Mcintyre. 1993. Some Perspective on the Upriver-Downriver Issue in the Columbia Basin — A case study from Idaho's Salmon River. USDA Forest Service, Intermountain Research Station, Boise, ID. 11 pp. with charts (Unpublished report, subject to revision).
Leonard, George. 1989. Letter to Regional Foresters dated February 27, 1989. Transmitting a copy of the National Action Plan (with appendixes) for Improving Compliance with the National Environmental Policy Act. USDA Forest Service, Washington, DC.
Liggett, Chris, C. Hickman, R. Prausa, and N. Reyna. 1995. Timber Program Issues: Technical Examination of Policy Options. USDA Forest Service, Washington, DC. 301 pp.
Murphy, Dennis. 1994. Clearcut, Selection, and Total Harvest Acres by Fiscal Year. Timber Management Division, USDA Forest Service, Washington DC. 1 p.
Myers, Peter C. 1986. "Below Cost Timber Sales: An Overview of an Issue — Understanding Linkages." In: Conference Proceedings: Below Cost Timber Sales, edited by D.C. Le Master, B.R. Hamm, and J.C. Hendee. February 17-19, 1985, Spokane WA. Sponsored by the Wilderness Society, Washington State University Department of Forest and Range Management, and University of Idaho College of Forestry, Wildlife, and Range Sciences. p. 13-21.
National Park Service. 1994. River Mileage Classification for Components of the National Wild and Scenic River System. Division of Park Planning and Protection, Washington, DC. 16 pp.
Nehlsen, W., J.E. Williams, and J.A. Lichtowich. 1991. "Pacific Salmon at the Crossroads: Stocks at Risk from California, Oregon, Idaho, and Washington." Fisheries 16(2):4-21.
O'Neal, Sonny, G. Pozzuto, J. Weissling, C. Jemmett, B. Russell, J. Burns, D. Craig, S. Bailey, T. Hoffman, and P. Johnston. 1990. "Usefulness of Forest Service Plans." Volume 8, Critique of Land Management Planning. FS-459. USDA Forest Service, Washington, DC. 19 pp.
Pacific Salmon Work Group and Field Team. 1992. Background Report for the Development of the Forest Service Management Strategy for Pacific Salmon and Steelhead. Information Report. USDA Forest Service, Washington, DC. 41 pp.
Powell, Douglas S., J.L. Faulkner, D.R. Darr, Z. Zhu, and D.W. MacCleery. 1993. Forest Resources of the U.S., 1992. Gen. Tech. Report RM-214. USDA Forest Service, Rocky Mountain Forest and Range Experiment Station, Fort Collins, CO. 33 pp.
Repetto, Robert. 1985. Subsidized Timber Sales from National Forest lands in the U.S. World Resources Institute, Washington, DC.
Robertson, F. Dale. 1988. "A New Era for Oil and Gas Leasing on National Forests" In: USDA Forest Service Proposed Oil and Gas Regulations (36 CFR 228 E) Briefing Book issued February 1, 1989. USDA Forest Service, Washington, DC. 5 pp.
Robertson, F. Dale. 1994. "Ecosystem Management of National Forests and Grasslands." Letter dated June 4, 1992. USDA Forest Service, Washington, DC., 3 pp. plus attachments: 1. "Working Guidelines for Ecosystem Management" and 2. "Reduce Clearcutting on National Forests."
Russell, John W., C. Bye, J. Caplan, H.A. Pentack, O.D. Grossarth, M. Lunn, E. Schultz, R. Scott, and T. Steward. 1990. "Public Participation." Volume 5, Critique of Land Management Planning. FS-456. USDA Forest Service, Washington, DC. 23 pp.
Schamel, Kathleen. 1994. "PIT Traveler." Passport in Time 5:1. CEHP, Inc., Washington, DC.
Shands, William E., Alaric V. Sample, and Dennis C. Le Master. 1990. "National Forest Planning: Searching for a Common Vision." Volume 2, Critique of Land Management Planning. FS-453. A report prepared by the Conservation Foundation in cooperation with the Purdue University Department of Forestry and Natural Resources under Agreement 89-PA-039. USDA Forest Service, Washington, DC. 91 pp.
Stout, Brian E. 1995. Below-Cost Timber Sales. Written account prepared at the author's request. Lakeview, MN. 23 pp.
Thomas, Jack Ward. 1988. Status and Trends of U.S. Renewable Resources. Charts presented at the "Natural Resources for the 21st Century" under the sponsorship of the American Forestry Association. USDA Forest Service, Washington, DC.
Thomas, Jack Ward. 1994. "The Chief's Vision of Wilderness." Attachment to a letter from Gray F. Reynolds, Deputy Chief, National Forest System, to regional foresters and other wilderness managers and program leaders, dated August 31, 1994, on the subject: Wilderness announcements. USDA Forest Service, Washington, DC. 5 pp.
Thomas, Jack Ward. 1995. Forest Health: What Is It, What Are We Doing About it? Statement presented at the 60th North American Wildlife and Natural Resources Conference, Minneapolis, MN. 20 pp.
Ulrich, Alice H., 1990. U.S. Timber Production, Trade Consumption and Price Statistics 1960-88. USDA Forest Service, Washington DC. 80 pp.
Unger, David G. 1993. National Hierarchical Framework of Ecological Units. Directive to Regional Foresters, Station Directors, IITF, and Area Directors, dated November 5, 1993. USDA Forest Service, Washington, DC.
Unger, David G. 1995. Statement (with attachments) on the Forest Service Administrative Appeals Process, March 8, 1995, before the Subcommittee on Forests and Public Land Management Committee on Energy and Natural Resources, U.S. Senate. USDA Forest Service, Washington, DC. 7 pp.
U.S. Bureau of the Census. 1993a. Statistical Abstract of the United States 1993. 113th edition. U.S. Department of Commerce, Washington, DC. 100 pp.
U.S. Bureau of the Census. 1993b. Housing Starts. C20/93. U.S. Department of Commerce, Washington, DC.
U.S. Congress. 1992. An Act for FY 1992 Appropriations for the U.S. Department of the Interior and Related Agencies. Section 322, Forest Service Decision Making and Appeals Reform. Washington, DC.
U.S. Congress, Office of Technology Assessment. 1992. Forest Service Planning: Accommodating Uses, Producing Outputs, and Sustaining Ecosystems. OTA-F-505. Washington, DC. 206 pp.
U.S. Department of Agriculture. 1986-1994. Agricultural Statistics for the years 1986-1994. U.S. Government Printing Office, Washington, DC.
U.S. Departments of the Interior and Agriculture. 1981-1989. Annual Wilderness Report to Congress for the years 1980-1987. Washington, DC.
U.S. District Court, Las Vegas, NV. 1996. United States of America v. Nye Country, Nevada et al. Order on Motion for Summary Judgment RE: Federal Ownership and Management of National Forest Lands. March 4, 1996.
U.S. District Court, Seattle, WA. 1994. Seattle Audubon Society v. Lyons. Order on Motion for Summary Judgment RE: 1994 Forest Plan. December 21, 1994.
USDA Forest Service. 1980a. A Recommended Renewable Resources Program: 1980 Update. Washington DC. 540 pp. plus appendixes.
USDA Forest Service. 1980b. Report of the Forest Service for Fiscal Year 1979. Washington, DC.
USDA Forest Service. 1981a. An Assessment of the Forest and Rangeland Situation in the United States. Forest Resource Report No. 22. Washington, DC. 352 pp.
USDA Forest Service. 1981b. Report of the Forest Service for Fiscal Year 1980. Washington, DC.
USDA Forest Service. 1981-1987. Report of the Forest Service for Fiscal Years 1980 to 1986. Washington, DC.
USDA Forest Service. 1981-1995. Report of the Forest Service for Fiscal Years 1980 to 1994. Washington, DC.
USDA Forest Service. 1982a. Report of the Forest Service for Fiscal Year 1981. Washington, DC.
USDA Forest Service. 1982b. The Analyses of the Timber Situation in the United States, Forest Resource Report No. 23. Washington, DC. 499 pp.
USDA Forest Service. 1983. Report of the Forest Service for Fiscal Year 1982. Washington, DC.
USDA Forest Service. 1985. Report of the Forest Service for Fiscal Year 1984. Washington, DC.
USDA Forest Service. 1986. Report of the Forest Service for Fiscal Year 1985. Washington, DC.
USDA Forest Service. 1986-1990. Report of the Forest Service for Fiscal Years 1985 to 1990. Washington, DC.
USDA Forest Service. 1987a. An Enduring Resource of Wilderness: Management Principles. Washington, DC. 6 pp. brochure.
USDA Forest Service. 1987b. Report of the Forest Service for Fiscal Year 1986. Washington, DC.
USDA Forest Service. 1987-1995. Report of the Forest Service for Fiscal Years 1986 to 1994. Washington, DC.
USDA Forest Service. 1988a. Forest Health Through Silvicultural and Integrated Pest Management. E1-E17. Washington, DC.
USDA Forest Service. 1988b. Report of the Forest Service for Fiscal Year 1987. Washington, DC.
USDA Forest Service. 1988c. Rise to the Future: Fish Your National Forests Progress Report. Wildlife and Fisheries Division, Washington, DC. 20 pp.
USDA Forest Service. 1989a. Implementing Task Force Compliance in Resource Development Activities. March 14, 1989. Environmental Coordination Staff, Washington, DC. 2 pp. (Copy in author's files).
USDA Forest Service. 1989b. Proposed Oil and Gas Regulations. 36 CFR 228E Briefing Book.
USDA Forest Service. 1989c. Report of the Forest Service for Fiscal Year 1988. Washington, DC.
USDA Forest Service. 1990a. Make a Difference: Challenge Yourself with a Forest Service Career. Program Aid 1461. Washington, DC. 18 pp.
USDA Forest Service. 1990b. Report of the Forest Service for Fiscal Year 1989. Washington, DC.
USDA Forest Service. 1991. Report of the Forest Service for Fiscal Year 1990. Washington, DC.
USDA Forest Service. 1991-1993. Report of the Forest Service for Fiscal Years 1989 to 1992. Washington, DC.
USDA Forest Service. 1991-1995. Report of the Forest Service for Fiscal Years 1990 to 1994. Washington, DC.
USDA Forest Service. 1992a. Compilation prepared by Division of Timber Management, Washington, DC.
USDA Forest Service. 1992b. Report of the Forest Service for Fiscal Year 1991. Washington, DC.
USDA Forest Service. 1992c. "Review of and Comment on National Forest Plans and Project Decisions. Proposed Rules." Federal Register 57:59, March 26, 1992.
USDA Forest Service. 1993a. Every Species Counts: Conserving Biological Diversity. Program Aid 1994. Washington, DC. 8 pp.
USDA Forest Service. 1993b. Healthy Forests for America's Future: A Strategic Plan. MP 1513. Washington, DC.
USDA Forest Service. 1993c. Report of the Forest Service for Fiscal Year 1992. Washington, DC.
USDA Forest Service. 1993d. Sharing the Commitment: Partnerships for Wildlife, Fish, and Rare Plants. FS-542. Washington, DC. 16 pp.
USDA Forest Service. 1993e. Summary of timber data from national forest lands (as of 7/1/93). Files of Timber Management Division, Washington, DC. 4 pp.
USDA Forest Service. 1993f. Timber Sale Program Annual Report. National summary for FY 1993.
USDA Forest Service. 1993g. Viability Assignments and Management Considerations for Species Association with Late-Successional and Old-Growth forests in the Pacific Northwest. Report of the Scientific Analysis Team. Washington, DC. 50 pp.
USDA Forest Service. 1993h. Budget Explanatory Notes for Fiscal Year 1994 for Committee Appropriations. Washington, DC.
USDA Forest Service. 1994a. Diversity for the Future: Science and the Challenge for Saving Endangered Species. Washington, DC. 12 pp.
USDA Forest Service. 1994b. Western Forest Health Initiative. State and Private Forestry, Washington, DC. 66 pp.
USDA Forest Service. 1994c. Forest Service Chief Announces Changes for Wilderness in Celebration of the 30th Anniversary. News release dated November 10, 1994. Washington, DC. 2 pp.
USDA Forest Service. 1994d. The Forest Service Ethics and Course to the Future. FS-567. Washington, DC. 9 pp.
USDA Forest Service. 1994e. Report of the Forest Service for Fiscal Year 1993. Washington, DC.
USDA Forest Service. 1994f. Tabulation of Budget Authority, Full-time Employment, and Forest Service Program Line Items for Fiscal Years 1975 to 1994. Washington, DC.
USDA Forest Service. 1994g. National Strategic Plan for Air Resource Management. Washington, DC. 11 pp.
USDA Forest Service. 1995a. Distribution of Botanists and Biologists by Location. Tabulation prepared by the Wildlife and Fisheries Division, Washington, DC.
USDA Forest Service. 1995b. Course to the Future: Positioning Fire and Aviation Management. Washington, DC. 19 pp.
USDA Forest Service. 1995c. National Forest System Reforestation and Timber Stand Improvement Report for FY 1994. January 18, 1995. Transmitted to regional foresters and station directors from the Washington Office. Timber Management Division, Washington, DC.
USDA Forest Service. 1995d. Report of the Forest Service for Fiscal Year 1994. Washington, DC.
USDA Forest Service. 1995e. Tabulation of National Forest Plan Appeals Data 1989-1995. Prepared by the Ecosystem Management Staff, Washington, DC.
USDA Forest Service. 1995f. Timber Sale Program Annual Report for Fiscal Year 1994. National Summary. Washington, DC. 97 pp.
USDA Forest Service. 1995g. Tabulations of the Timber Management Division. Washington, DC.
USDA Forest Service. 1995h. Strategic Assessment of the Management in the Forest Service. Washington, DC. 31 pp. Unpublished report.
USDA Forest Service. 1996a. Western Health Initiative: Status Report For Fiscal Year 1996. Draft dated March 22, 1996. State and Private Forestry, Washington, DC. 24 pp.
USDA Forest Service. 1996b. Forest Service Noxious Weed Strategy. Draft dated March 4, 1996. Washington, DC. 10 pp.
USDA Forest Service Rocky Mountain Region. 1989. Wilderness Management Philosophy. Denver, CO. 32 pp.
USDA Forest Service Urban Forest Supervisors. 1994. Windows to the Future: Urban National Forests. Chief and Staff Briefing, October 12-14, 1994.
U.S. General Accounting Office. 1988a. Public Rangelands: Some Riparian Areas Restored But Widespread Improvement Will Be Slow. GAO/RCED 88-105 (B-230548) Washington, DC. 85 pp.
U.S. General Accounting Office. 1988b. Rangeland Management: More Emphasis Needed on Declining and Overstocked Grazing Allotments. GAO/RCED 88-8 (B-204997). Washington, DC. 71 pp.
U.S. General Accounting Office. 1989. Wilderness Preservation: Problems in Some National Forests Should Be Addressed. B236596, Washington, DC. 91 pp.
U.S. General Accounting Office. 1991. Wilderness Management: Accountability for Forest Service Funds Needs Improvement. B242584. Washington, DC. 18 pp.
U.S. Geological Survey. 1992. National Wild and Scenic River System (map). Reston, VA.
U.S. House of Representatives. 1994a. Department of the Interior and Related Agencies Appropriations Bill. Report 103-158. U.S. Congress, 103d, 1st session. Washington, DC.
U.S. House of Representatives. 1994b. Making Recommendations for the Department of the Interior and Related Agencies for FY 1994 and Other Purposes. Report 103-299. U.S. Congress, 103d, 1st session. Washington, DC.
U.S. Senate. 1994. Department of the Interior and Related Agencies. Appropriations Bill. Report 103-144. U.S. Congress, 103d, 1st session. Washington, DC.
Vento, Bruce P. 1989. Letter to F. Dale Robertson, Chief of the Forest Service, dated March 15, 1989. Washington, DC. 6 pp.
Waddell, Karen L., D.D. Oswald, and D.S. Powell. 1989. Forest Statistics of the United States 1987. Resource Bulletin PNW-RB-168. USDA Forest Service, Pacific Northwest Research Station, Portland, OR. 106 pp.
Warren, Debra D. 1995. Production Prices, Employment, and Trade in Northwest Forest Industries, Second Quarter 1994. Resource Bulletin PNW-RB 205. USDA Forest Service, Pacific Northwest Station, Portland, OR. 130 pp.
Whitmore, Jacob L. 1995. Discussion in September 1995 with Dr. Whitmore, Coordinator for the Research Natural Area Program. USDA Forest Service, Washington, DC.
Wilderness Society. 1986a. Issues to Raise in a Forest Plan Appeal: A Citizen Handbook. Washington, DC. 81 pp. plus appendixes.
Wilderness Society. 1986b. How to Appeal a Forest Plan: A Citizen Handbook. Washington, DC. 27 pp. plus appendixes.
Wilkinson, Charles F., and H.M. Anderson. 1986. "Below Cost Timber Sales: The Legal Structure." In: Below Cost Timber Sales Conference Proceedings. Feb 17-19, 1986. Spokane, WA. The Wilderness Society, Washington, DC. pp. 23-34.
Wilkinson, Charles F., and H.M. Anderson. 1987. Land and Resource Planning in the National Forests. Island Press, Washington, DC. 373 pp.
Wolf, R.E. 1984. State-by-State Estimates of Situations Where Timber Will Be Sold by the Forest Service at a Loss in Profit. Congressional Research Service, Library of Congress, Washington, DC. 23 pp. plus 3 attachments.
| <<< Previous | <<< Contents>>> | Next >>> |
|
FS-628/chap6.htm Last Updated: 20-May-2009 |