|
POSSIBILITIES OF SHELTERBELT PLANTING IN THE PLAINS REGION
|
|
Section 11.—CLIMATIC CHARACTERISTICS OF THE PLAINS REGION12
By C. G. BATES, senior silviculturist, Lake States Forest Experiment Station, Forest Service
12Due acknowledgment is made to the U. S. Weather Bureau not only for the general use of their data herein but for special help given by J. B. Kincer of the central office in the preparation of certain maps and to the section directors of all of the States involved for very fine cooperation in making unpublished material available for the compilations, credit for the compilations and maps made at the Lake States Forest Experiment Station belongs almost entirely to W. E. Barnes, junior forester, acting under the writer's direction.
CONTENTS
Wind directions and velocities
Forces controlling wind direction
Anticyclonic winds of winter
Summer winds and local storms
Influence of surface conditions on local convection
Shelterbelt orientation
Precipitation
Source
Annual amounts of precipitation
"Turn-over" moisture v. replenishment from the Gulf
Effect of topography, soil, vegetation, etc., on local precipitation
Variability in precipitation; droughts
Drought years
Cyclic variations and general changes in rainfall
Fluctuation of rainfall in regional subdivisions
Relative humidity and evaporation
Effective precipitation as limited by evaporation trends
Temperatures and their significance
Temperature variations
Mean maximum July temperatures
1934 drought temperatures
From the standpoint of practical importance, the items of greatest interest in the climate of the Plains are the persistent, rather high wind movement; the low precipitation in the northwest sector farthest removed from the Gulf supply; the high frequency of droughts in the section of southwest Kansas most directly in the path of southwest winds; and the extreme temperatures which occur everywhere when moisture is lacking at midsummer.
Except in affecting locally the wind movement, the ways in which shelterbelt planting or more extensive planting in blocks can affect climate appear to be somewhat remote, and possibly not as important as direct water-conservation measures. Each can play its part, however, in any well-rounded program for the amelioration of the climatic conditions of the Plains.
In treating the subject constructively, it is hardly sufficient to say that the climatic conditions of the Plains are such and such. It is necessary to develop a sufficient understanding of matters to indicate how far the local climatic factors can be changed by any "developments" which might be undertaken by man, such as the change from grassland to farming conditions which has already taken place, and the extensive tree-planting and water-conservation measures which are proposed for the future. Hence the various phases of the subject are discussed, not in the order of their immediate importance, but to develop logical cause-and-effect relationships. Little space is given in this discussion to the bare facts of climate, which may be read from the accompanying maps (figs. 23 to 35).
WIND DIRECTIONS AND VELOCITIES
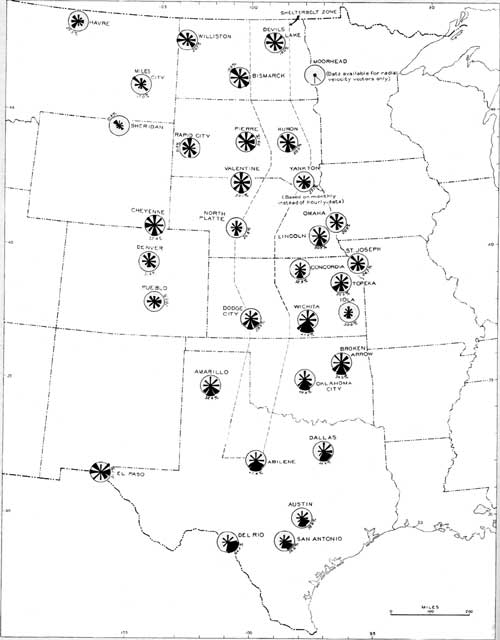
The well-known windiness of the Plains is probably due in a small measure to local factors causing wind (this may be a considerable factor during the summer period, when storms are largely bred locally), but more largely to the unbroken topography and lack of impediments on the surface, giving the wind a free sweep. The average wind velocity over most of the region13 is from 10 to 12 miles per hour, but is above 12 miles in eastern North Dakota and eastward to Lake Superior, in a small area around Valentine, Nebr., and over a large area on and adjacent to the Texas High Plains.
13These general statements are based on the map shown on p. 34, Atlas of American Agriculture II, B (Washington, i928).
These average velocities are in excess of those prevailing in most other sections of the United States, although an area bordering the Great Lakes and a considerable area in Nevada and southern Idaho show velocities of 10 miles per hour, or slightly more. Nearly one-third of the country has average velocities of 5 to 8 miles per hour, while a similarly large area averages 8 to 10.
The prevailing direction of the wind over most of the area is from the northwest in the winter and south or southeast in the summer. At no point in the region is the southwest wind an important factor as indicated by duration, yet over most of the area southwest winds occur at intervals and are usually very damaging because of their dryness and the heating which results therefrom. The rather frequent occurrence of such winds in South Dakota suggests a local origin, perhaps in the heavy, arid clay soils which prevail west of the Missouri River.
In the lower western Gulf region there is a large area extending to southeastern New Mexico and as far north as Wichita, Kans., in which, even during the winter, the winds continue prevailingly from the south (figs. 23 and 24).14 While this condition affects only the southern extremity of the shelterbelt zone, it is worth keeping in mind that the effect of northern blasts is felt only intermittently and that, when these do occur, the change from the usually mild winter conditions is very marked and often severely damaging to trees and other living things.
14Beginning in 1918, various Weather Bureau first-order stations have successively taken up the compilation of the wind-direction and velocity data on an hourly basis, tabulating under one of the eight directions, which happens to prevail during each hour, the whole number of miles of wind in that hour. Although the periods for which such information is available are not uniform throughout, this is not thought to be important if the record for at least 10 years is employed.
|
| FIGURE 23.—Wind directions and velocities for the 3 summer months. Proportion of time from each direction shown in width of wedgelike petals of each "wind rose" and average velocity by the length of the wedge; the radius of circle denotes 10 miles per hour. (click on image for a PDF version) |
|
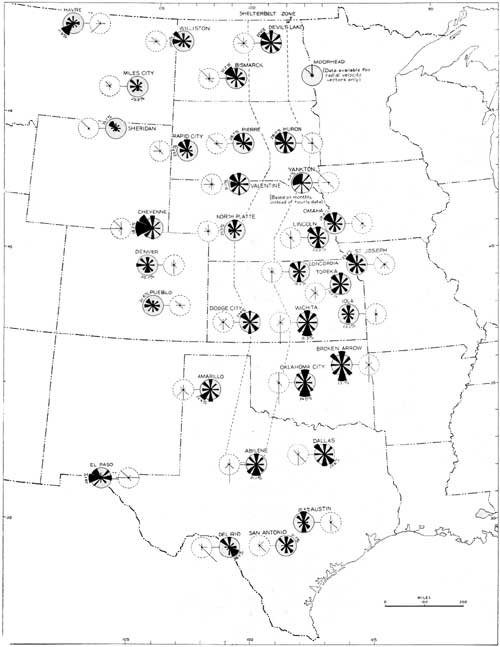
| FIGURE 24.—Wind directions and velocities for the 6 months November to April, and total movement for the year from each direction. Proportionate time and velocity from each direction for winter period shown by width and length, respectively, of wedgelike sectors of "roses," radius of circle denoting 10 miles per hour. Total movement for the year from each direction shown by length of radial lines in secondary "roses," radius of circle representing 20,000 miles. (click on image for a PDF version) |
FORCES CONTROLLING WIND DIRECTION
In the central United States, the winter winds are the prevailing westerlies; i. e., a general west-to-east air movement characteristic of most of the North Temperate Zone, together with a southerly movement from the cooler land area to the warmer waters of the Caribbean region, apparently strongly influenced by the proximity of the warm Gulf Stream in the southeast quadrant. During this season, however, the regular southeasterly movement is frequently interrupted by the passage of "cyclonic storms" or low-pressure areas which, with the westerlies, move in from the north Pacific region, dip somewhat to the south, then move out of the United States in a northeasterly direction. Again, the center of low pressure may move across the central portion of the Plains, or well to the south.
Frequently these whirling masses of air, forming a large vortex with low atmospheric pressure, move across the United States with great regularity, drawing the air to them from all directions. Occasionally the centers of low pressure are diverted here and there, so that the regular movement is seriously disturbed.
When such low-pressure areas move across the northern United States, they bring well toward the northern border, warm moist air from the Gulf, which, coming in contact with colder and drier air drawn from Arctic regions, is elevated, and its moisture largely precipitated.
Even with this frequent disturbance and opportunity for mixing and elevation of warm, moist air currents, the winter precipitation of the western basin area remains surprisingly low, but is a somewhat more important factor in the total precipitation of the southern section than of the northern. Low precipitation at this season results from a smaller capacity of the atmosphere to evaporate and pick up moisture from the Gulf region, and also from the less steady and persistent air movement from the Gulf to the land during the winter. Describing it in another way, the dry air from the west and north at this season intrudes itself much more strongly upon the entire scene.
ANTICYCLONIC WINDS OF WINTER
For this reason, while cyclonic storms frequently interrupt the westerlies for several days at a time, one of the outstanding features of the winter season is the strength of these westerlies in the wake of the passage of a low-pressure area. It is not uncommon, in the low-precipitation zone near the base of the Rockies, to see the scant snow which has fallen, carried away by these so-called anticyclonic winds without having opportunity to moisten the soil at all. Following this, if high velocities persist, comes complete drying of the soil, dust storms, and serious soil erosion, these phenomena being more common as winter advances into spring without the expected spring precipitation.
One can see here that the preservation of soil moisture at that period, when the winter forces—not generally conducive to precipitation—are having their last "whirl", may represent an important and crucial point in the entire moisture regime. Certainly it is apparent that in those seasons when the winter forces of dryness hold sway unduly late, the immediate effect upon soils and fall-sown crops is not only crucial but in many instances fatal. Assuming that protection can be afforded which will materially reduce the drying power of the augmented westerlies during the winter, it would seem that the retention, in the western zone, of soil moisture to be evaporated later, will make spring rains more beneficial.
Believing that this is a critical point, if only from the standpoint of the certain, direct, localized benefit from protection, it is recommended that special stress should be laid on shelterbelt orientation to protect the soil from these early season winds quite as much as from the obviously desiccating hot south winds of summer.
SUMMER WINDS AND LOCAL STORMS
Wind directions during the summer are, in the main, much more moderate in velocity than those of winter.
The commanding force determining direction of wind during the summer months (the months June to August are segregated in our calculations because in the northern region only these months show a definite reversal of the conditions which prevail most of the year) is the higher temperature and lower pressure which prevail over the continent as compared with the oceanic areas on all sides.
Air enters the entire Mississippi Basin from a southerly or southeasterly direction at this season, spreading fanlike to the northwest, north, and northeast. So far as the western sector is concerned, the westward drift is plainly due to the fact that the lowest pressure generally persists at this period over the region of the Great Basin.
At this season, it may be said that the entire continental area is setting up its local convectional currents. These, set up as a result of local inequalities of heating—to a slight extent small cyclonic swirls—take the place of the larger cyclonic movements, which either fail entirely to develop over the Pacific, or, coming inland by aid of the weakened westerlies, encounter so many disturbances over the land that their identity is lost. These local convections, while largely responsible for precipitation or the lack of it, have little effect on the prevailing wind. At the same time, some of the most violent and destructive winds of short duration are commonly connected with the actual storm periods. To illustrate, on the Plains thunderstorms may begin to develop before midafternoon, the cloud formations increasing in size until late afternoon, and very often moving eastward perceptibly. Their "breaking" late in the afternoon is almost invariably accompanied by a squall from the west, which persists, perhaps only for a few minutes, until the rain is well under way or the center of disturbance has passed and spent itself without rain.
INFLUENCE OF SURFACE CONDITIONS ON LOCAL CONVECTION
The movement of the wind toward areas of low pressure cannot, of course, be stopped or even checked by any condition on the surface. If man were to erect barriers, or windbreaks, which completely stopped wind movement close to the ground, and if other conditions remained the same (which of course they would not), it could only result in the movement occurring at a slightly higher level. On the other hand, one might say that the development of low-pressure areas is dependent upon many conditions, some of which have been and will be modified by man's actions, although possibly the effect of such modification is imponderable in comparison with the major forces which have their origin in the existing, yet variable, composition of the entire solar system.
SHELTERBELT ORIENTATION
From the standpoint of shelterbelt orientation, with prevailing winds "quartering", it is often difficult to state whether the axis may best be in one direction or another. But because east winds are themselves generally harmless, and both north and south winds are frequently quite damaging, there is a tendency everywhere, except possibly in North Dakota, to ignore west winds despite their frequent occurrence during storms, and as "anticyclones", and to believe that shelterbelts having their axes east-west can accomplish the greater degree of protection. Whether this is an entirely correct assumption remains to be shown by a more detailed analysis of wind values and of their effect on local evaporation than is possible at this time.
PRECIPITATION
SOURCE
The entire Plains region, being cut off from Pacific moisture by the mountains on the west, and enclosed on the north by a cold area in which relatively little evaporation can occur no matter how extensive the lakes and ice fields, is dependent to a large degree on moisture from the Gulf region to replace that which has been lost. It is largely this dependence upon one source and upon winds from one direction which is responsible for the small quantities received in the most distant northern and western portions of the Plains, for great variability in the precipitation in the southwest part of the area, and for the frequent occurrence of droughty periods. It is also this factor, together with the southerly course taken by some cyclonic storms during the winter, which accounts for the extremely low winter precipitation in the North, with the ratio of winter moisture to the annual amount tending to increase southward.
The high Rockies, which, together with the coastal mountains, draw from the westerly winds essentially all moisture which has been evaporated over the Pacific, stand as a barrier against entry of much rain from that direction, and winds coming down from the mountains to the western Plains are usually dry, warmed by their descent and likely to be very desiccating.
Winds from the North, no matter how great the moisture available in the Arctic regions, can carry only an amount of moisture limited by their temperature, and when this temperature is below freezing the absolute moisture which they carry is trifling.15 Arctic air in running south into a drier region is not likely to add to its moisture as rapidly as its temperature increases. Upon becoming involved with much warmer and moister air from the South in the cyclonic "mixing bowl", some of the moisture of Arctic air may be precipitated, but it is insignificant in comparison with the amount that may be brought from a warmer oceanic area.
15For example, theoretically complete saturation at 0° F. has become only 21 percent relative humidity if, in moving southward, the air current has become warmed to 32° without change in moisture content. If the current saturated at 0° meets and mixes with a current saturated at 40°, the mixture will be saturated at about 20°. The prevailing opinion now appears to be that the warm air is more likely to flow up over the cold air and that precipitation results from elevation and cooling of the former more largely than as a result of mixing.
East winds, in the Plains region, are usually felt for a short time just before a storm and it is common knowledge that they always feel cold and moist. Insofar as such winds are truly from the land areas farther east (and the Great Lakes) which are much better watered than the Plains, east winds may be returning a portion of the moisture which has previously been carried out of the Plains region by the drying west winds. Actually, however, the wind seldom blows long from the East, and even when it does it represents, in part at least, the air from the South which has already become involved in the counterclockwise swirl of the cyclone.
Thus, for new supplies of moisture, the Plains region is dependent very largely on winds from the Gulf, and the more distant portion of the region is dependent upon the chance that, long before the winds from the Gulf have reached it, they will have encountered disturbing conditions causing most of the moisture to be precipitated. Hence the rather steady decrease in amount of precipitation from the Gulf outward, particularly in a northwesterly direction.
The high western rim of the Plains, i. e., the Rockies, receive much more moisture than adjacent Plains areas, and this is almost wholly from the Gulf, the cooling of air currents as they rise over the mountains being sufficient to cause much of it. The mountain ranges adjacent to the Plains benefit greatly from the southwestern low which is responsible for a summer rainy season which begins, usually July 10 to 15, at about the same time that the rainfall of the northern Plains drops off markedly. This "rainy season" is hardly noticeable beyond southern Wyoming and is most sharply defined in southern Colorado, New Mexico, and Arizona.
In short then, the winds from the Gulf, normally give to the western part of the Plains at midsummer a little better chance than they would have if only dry south winds were driven over this section, as sometimes occurs. The Gulf winds are fairly well laden with moisture; but, with the Plains very hot, there is generally no inducement to precipitate such moisture until the air currents strike the high and much cooler mountain ranges.
There is some slight compensation for this in the fact that the excess rainfall in the mountains flows through the Plains giving the driest portions the only permanent streams which they possess, with the marked exceptions of the Cimarron and Republican Rivers. A great deal of this water is used for irrigation, in Nebraska and Kansas, for example. The question deserves careful study, whether at least the flood water from some of the more southerly streams could not be more fully stored and utilized in the Plains for improving agricultural conditions.
ANNUAL AMOUNTS OF PRECIPITATION
The average or "normal" amounts of precipitation referred to in this discussion, unless otherwise specified, are the averages for the period of approximately 40 years, from 1895 to 1934, inclusive. The purpose in adopting this period was to include, as nearly as possible, a complete "cycle" from the end of the last great depression of precipitation in the Plains region to the end of the current depression. However, 40 years is a fair basis for comparing different parts of the region and is about the longest that can be employed for any large number of stations. Even for this period it is necessary to extrapolate parts of the records, which has been done, for stations with less than 40-year records (but in no case less than 15), by comparing such stations during their period of record with 2 or 3 stations surrounding them, and assuming that the same ratio existed between these stations and the incomplete one during the period when the latter had no record.
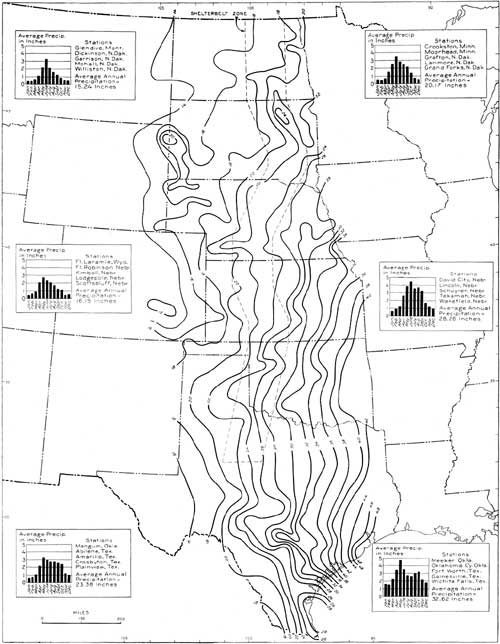
The average annual precipitation of 55 to 60 inches in the central portion of the Gulf "arch" decreases up the Mississippi Valley to about 33 inches in southwestern Wisconsin and does not increase with closer approach to the Great Lakes (fig. 25). A rainfall very much less on the west shore of the Gulf of Mexico, amounting to only about 26 inches at the mouth of the Rio Grande, increases slightly to the northward owing to a fairly high plateau south of the Colorado River, but, continuing further along the 98th meridian, remains at about 30 inches until northern Oklahoma is reached, then decreases with fair regularity to 18 inches at the Canadian border. The lower Rio Grande Valley and the plains of northern Mexico east of the central plateau are regions no better watered than many parts of our own Plains. On the 100th meridian the annual rainfall is only 20 inches at the Rio Grande, increases slightly over the Edwards Plateau of lower Texas, then decreases rather regularly to less than 16 inches at the Canadian border. The smallest amounts, generally around 14 inches, are found on the smooth but very gently rising plains between the 100th meridian and the foot of the Rockies, with an extreme low of about 12 inches recorded at Pueblo, Colo., in the Arkansas Valley just at the base of the mountains.
|
| FIGURE 25.—Average annual precipitation in inches for the 40-year period 1895-1934, together with typical monthly distribution charts for various parts of the region. (click on image for a PDF version) |
"TURN-OVER" MOISTURE V. REPLENISHMENT FROM THE GULF
If we are to have a proper understanding of the moisture-supply problems of the Plains, the importance of "turn-over" moisture must be realized. This idea has been developed elaborately by Zon.16
16ZON, RAPHAEL. THE RELATION OF FORESTS IN THE ATLANTIC PLAIN TO THE HUMIDITY OF THE CENTRAL STATES AND PRAIRIE REGION. Soc. Amer. Foresters Proc. 8 (2): 139-153. 1913. Also pub, in Science (a. s.) 38: 63-75. 1913.
If the wind blew persistently off the Gulf of Mexico to the north and northwest, and if all of the moisture carried from the Gulf and the Caribbean were precipitated along the first 100 miles of the Gulf coast, a very considerable area would have very heavy rain. Of this amount a large proportion, probably two-thirds, would flow back to the Gulf because, with moist Gulf winds always blowing, the evaporating power of the air is or would be very low indeed. There would thus be only about one-third of the total which, being picked up at times when the air was not saturated, might be reprecipitated later or carried farther inland, where it could water a similar 100-mile zone much less abundantly than the first zone was watered. It is probable, from the facts known, that very little would flow from the second zone back to the Gulf, and, the atmosphere being drier than in the coastal belt, the evaporation of this moisture after it fell would be much more complete and prompt.
This is what is implied by "turn-over moisture", and the process plays a very important part in watering an interior region. The coastal conditions are, of course, not exactly as stated, although there is a cooled belt in the central Gulf sector which receives a 60-inch precipitation and returns a very large part of it to the sea. There are, however, no sharply demarked zones and, fortunately, there is no sharp elevation along the Gulf coast to cause a strong concentration of precipitation there, else the interior would receive much less than it does. While large quantities are dropped near the Gulf simply because very little disturbance is required to cause precipitation, it is nevertheless true that much of the original moisture is carried farther inland, and at times, without doubt, to the outermost limits of the Plains region. The point to which it is directly carried at any time depends, primarily, upon the latitude through which cyclonic storms pass.
Stated briefly, the Gulf moisture is carried, directly or indirectly, to all parts of the Mississippi Basin, to the crest of the Rockies, and to the Arctic regions. There is a fairly steady northward movement and very little return from the extreme northern areas to lower latitudes because of the impossibility of rapid evaporation at low temperatures. There is also, during the winter, a more or less general and steady movement of vapor from west to east, but there is also, for brief periods, considerable return from eastern sections of the Basin to the drier west. When it is observed that the entire average return to the oceans through the Mississippi, Hudson Bay, and St. Lawrence drainages, does not exceed 7 inches per annum, while the average precipitation of this entire area is evidently in excess of 30 inches, it becomes evident that for large continental areas as much as three-fourths or four-fifths of the total precipitation must be turn-over or reevaporated moisture.17 Brückner18 estimated this at 78 percent of the total for continental areas as a whole.
17It is impossible to estimate this closely for any particular area on the basis of the return to the sea through streams. For example, most of the shelterbelt zone yields only 1 to 2 inches per annum in this form, but the southern region yields a steady flow of atmospheric moisture to the north, and the northern region loses a great deal to the east, so that both sections must have "replenishment" in a larger measure than is indicated by stream flow.
18BRÜCKNER, E. KLIMASCHWANKUNGEN SEIT 1700. 324 pp., illus. Wien and Olmütz, 1890.
While, then, it may in any instance be very difficult to determine where evaporated moisture will go, or from what direction a given area may receive moisture, it is evident that any possible increase in the atmospheric-moisture supply held within the Plains region cannot fail to be reflected by an increase, in some slight degree, at least, of precipitation in or near the region. Primarily, a change in this direction can be accomplished only by preventing the return to the sea of that portion of the rainfall which now reaches the streams, but a slight change in the time or season of precipitation may be effected by any factor which tends to delay evaporation of moisture from the soil.
EFFECT OF TOPOGRAPHY, SOIL, VEGETATION, ETC., ON LOCAL PRECIPITATION
Increase in precipitation is noted wherever there is any appreciable elevation, as on the High Plains of the Texas Panhandle, where, at an elevation of about 3,000 feet, there is an increase of 5 to 6 inches annually above what might be expected on an even plain. In the Black Hills of South Dakota, elevations slightly above 5,000 feet induce an excess of nearly 8 inches (the long-term records do not show so much as this, but there have been observations which show that nearly 25 inches fall on the western rim of the Black Hills); and even an added elevation of scarcely more than 200 feet between the Republican and Platte Rivers in Nebraska gives an increase of about 3 inches per annum. Another irregularity is the excess in the upper James River Valley in South Dakota, which may be induced by the Missouri Escarpment, having an elevation of 200 to 300 feet near the boundary between North Dakota and South Dakota, and lying immediately west of the valley where the increase is recorded.
If these effects of elevation are pronounced, the shortage of moisture falling in, or close to, some of the larger valleys is also notable and is significant in indicating that the areas of highest evaporation do not necessarily receive the benefits thereof. The Plains, where dissected by the valleys of the large eastward-flowing streams, in a notable number of instances receive more rainfall than the valley stations in the same longitude.
It is probably the wide and shallow Cheyenne River Valley, draining from the Black Hills to the Missouri River in a direction slightly north of east, and the extension of extremely flat land in the same direction east of the Missouri, which accounts for the droughty conditions through central South Dakota. An excess of precipitation in the upper James River Valley, as just mentioned, may to a slight extent "rob" the territory farther west. The observation stations in this area are so scattered that the effect may be more localized in the Cheyenne Valley than the precipitation and drought maps would suggest.
The diversion or "pulling" eastward of the isohyetal lines across the Platte Valley is fairly evident almost to Grand Island on the east. West of North Platte it apparently becomes combined with an eastward pull exercised by the sand hills which lie north of the Platte and which may have an influence similar to that of a valley, as will be apparent when the cause of any such influence is described.
The Arkansas River, more definitely set between short-grass plains throughout western Kansas, shows a similar pull on the lines, with the most marked effect at the west boundary of the State, but noticeable to the vicinity of Wichita. Again, in the Great Bend section of this river, the depression is thrown to one side in the decidedly sandy, subirrigated flats which center in Pratt County.
The Canadian River apparently has a similar effect from the Texas line eastward. In a line from Arnett to Kingfisher, however, the depression is distinctly north of the Canadian Valley, and it is notable that a considerable part of this territory is the sandy shin oak land. Probably this is a combined effect of the Canadian, North Canadian, and Cimarron Rivers which, east of Arnett, are all within a distance of 50 miles.
The Red River shows no marked tendency. Where it passes through the High Plains of the Texas Panhandle in rather narrow canyons, the precipitation is plainly "pulled" westward by the elevation of the short-grass plains, much more strongly than by any contrary pull of the conditions along the narrow valley or valleys.
Thus, if it be conceded that the records are now long and detailed enough to prove such a point, it is apparent that certain conditions of the "hard" plains tend to make them better watered (i. e., receiving greater precipitation) than the valleys or tall-grass sandy land in the same longitudes, in both of which the vegetation draws upon deep moisture and which, therefore, are likely during drought periods to be transpiring moisture to the atmosphere much longer than the short-grass land.
Several explanations of this phenomenon are possible:
1. The first inclination will be to ascribe the higher precipitation of the hard plains areas to their altitude. This, together with lower summer temperatures, may be the most reasonable explanation in the ease of the Texas high plains, which rise abruptly enough and to a sufficient height above the land to the east and south, to have a noticeable effect. It is hardly the explanation where the plains between stream valleys are essentially flat and scarcely more than 100 feet higher than the valley bottoms.
2. The harder lands, by reason of their capacity to hold more water in the surface layers of the soil, evaporate and transpire it more quickly after rains than do the "soft" or sandy lands. They thereby produce a quicker local turn-over of the moisture. We might, to use a concrete illustration, say that the moisture supply of a given area of hard land is evaporated and reprecipitated in the same locality 5 times per year as against 4 times for a locality in which the moisture sinks deeper into the soil and is brought up and evaporated more slowly through the aid of plants. Finnell19 estimates that on heavy soils in this region, as represented by experiments at Goodwell, Okia., only 19.8 percent of total rainfall on the average gets into the subsoil available for plant use, while 64 percent evaporates very quickly following both effective rains and those which wet only the surface.
19FINNELL, H. H. THE UTILIZATION OF MOISTURE ON THE HEAVY SOILS OF THE SOUTHERN GREAT PLAINS. Okla. Agr. Expt. Sta. Bull. 190, 24 pp. 1929.
While it is believed that this quick evaporation from the hard lands of the Plains is an important factor in increasing the total precipitation, it is well to point out that the chance of reevaporated moisture failing in the exact locality from which it was derived is remote indeed. Such importance as this factor possesses is, probably, covered in the following paragraphs.
3. If elevation and quicker turn-over are factors in the situation, there is still another worthy of consideration. River valleys which are subirrigated, or artificially irrigated, and to a lesser extent sandy areas in which the rainfall alone wets the soil to a considerable depth, through the more constant activity of vegetation, in reasonably calm weather tend to keep the air immediately above them cooled, relatively to the short-grass plains on either side and the frequently bare, eroding slopes of the valleys. Thus there tends to be a down-draft of air, at least during the day, which is in no sense conducive to precipitation in the valleys. The air thus cooled and more or less laden with moisture in the valleys is pushed out on either side, where it is again warmed on the more bare valley walls, and on to the already dry plain, where a warm ascending current is being developed under the heat of the sun. Thus, with any focus for such a formation, such as a slight promontory or a bare area with very rapid radiation, we might expect rain, clouds to develop over the plain areas, though the moisture of the air was being derived largely from moister valleys or tall grass areas nearby. It is a well-known fact that thunderstorms, often of the most violent character, develop on sultry days; that is, on days when there is no definite wind movement and when, therefore, local convectional currents may develop without interference in a locally heated focus where the rapid ascent of the moist air definitely begins.
If the plain between valleys is assumed to rise to a definite ridge, we would expect the focus for ascending air currents to be here, because such a ridge would naturally have the scantiest vegetation and would radiate heat most rapidly during the day. A focus might, almost as well, develop over a dried-up lake bed or any other distinctly bare area, the elevation of the ground having little to do with the matter. It is not the elevation of mountain peaks which makes them foci for convectional currents, but their bare rock surfaces.
Apparently, then, an area which dissipates its moisture most rapidly and subjects itself to the greatest extremes of heat and aridity may actually receive heavier rainfall than an adjoining area which retains and uses its moisture more conservatively. This apparently, is a severe blow to the theory that shelterbelt planting may increase local rainfall. The opposite effect seems a possibility. The importance of the theory is sufficient to justify a careful examination at this point, while the natural facts are clearly in mind.
If, for example, there is planting of trees along a valley or on a sandy plain where it is known there is sufficient subsoil moisture to maintain the trees in an active condition even during dry weather, it is possible that the rate of transpiration in the valley, and the total contribution of a given area of valley land to the moisture of the atmosphere, might be slightly increased, especially at a time when early season crops have matured and fields are largely bare. No material increase from such a planting is, however, to be expected if the trees, through checking wind, tend appreciably to reduce the rate of evaporation from the fields adjoining them. Therefore it is not seen that the trees can make of the valley area a much greater source of moisture than it would otherwise be.
As an alternative proposition, let it be supposed that planting be more largely concentrated on the hard ground of the Plains. Some of the rainfall received here commonly runs off and a large part of that which goes into the ground is held close to the surface and is quickly evaporated without benefiting vegetation, but it may be assumed that the areas planted to trees, through better rainfall reception and through reduction of direct evaporation, will obtain and store enough water to carry the trees through any ordinary dry season in an active condition. What then will happen? During dry periods the tree-covered areas will add a small amount of moisture to the air about them. It is not believed that small bodies of trees will directly have any important net effect on air temperatures in their immediate vicinity. While, on a calm day, they may appreciably cool the air which makes contact with them, it is also undeniable that air stagnation on their leeward sides tends to produce higher midday temperatures. This contrast may, in itself, tend to set up convection in a small way, a desirable thing, particularly in puncturing the blanket of hot air which frequently lies over the Plains until temperature differences become so great as to cause an upheaval. Such regular circulation, by mixing the air strata, may have a much greater effect on ground temperatures than the cooling effect of the trees.
However, it is fairly evident that both this minor and ineffective mixing, and the mechanical barriers to circulation along the ground may tend to reduce the flow toward effective foci of convection and reduce the chances for thunderstorms. In any event, these are likely to be at some distance from the planted area.
Since even a fallow field is moister than unbroken shortgrass sod after a short period of drying, it would seem that something similar to this is what may already have happened as a result of extensive cultivation in the Plains region—the creation of many cool, moist spots alternating too frequently with dry sod areas. This will be further discussed in connection with cyclic variations in precipitation.
VARIABILITY IN PRECIPITATION; DROUGHTS
While the average amount of precipitation received in various parts of the Plains reflects distance from the Gulf source and to some extent the effect of elevation, it is only when the fluctuations in amount are considered that the source of most of the moisture difficulties and the immediate cause of the droughts can be understood. While many measures of the variability in precipitation might be employed20 the measure here taken is the number of occurrences, in the 40-year period just ended, of droughts of a length of 4 months, longer and shorter periods being given values in geometric proportion. In any such group of months, each must show less than 60 percent of the normal monthly precipitation for that station, based on the average for the same 40-year period. Emphasis is thus placed on the variation, and not on the absolute amount of rainfall.
20A purely mathematical basis for measuring variability, such as the standard deviation in the amount for individual months, seasons, or years, probably has some advantages over any such arbitrary method as here employed. For a number of stations representative of the extremes of variability in this region the standard deviations in monthly and yearly precipitation have been computed, together with an index of variability (l) obtained by dividing the sum of the standard deviations for the 12 months by the total annual precipitation. This, it is evident, gives a weighted average for the entire year, in which the unit for calculation is still the month. The great variation in winter precipitation in most places is reduced in significance by the small amount occurring in winter, which is as it should be if proper emphasis is to be placed on the effect of variations during the growing season. Except for a few stations in the western Gulf regions which have had one or more exceptionally long droughts and hence are given a high rating in terms of 4-month droughts, there is a satisfactory correlation between the results of the two methods. The method of segregating the periods which have precipitation below the fixed standard, however, has the decided advantage of giving value to the length and continuity of droughts, which the statistical method does not recognize in any degree.
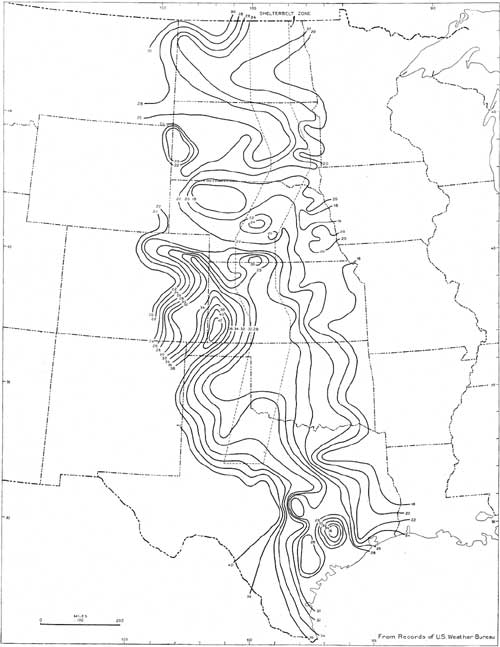
The most striking features of the map (fig. 26) showing this frequency are that (1) the lowest number of droughts is not found on the Gulf coast, but somewhat inland; (2) a low number of 18, along the eastern border of the area treated, occurs northward in the general vicinity of the 94th meridian from lower western Louisiana to northeastern Kansas, increasing northward to about 20; (3) the number increases rapidly westward along the Gulf coast, as soon as one passes out of the zone in which a south wind may be expected to bring moisture directly from the Gulf. The high number for Brenham, Tex., 37, is found by the direct mathematical method not to be significant, being rendered abnormal by a single drought of 15 months' duration in 1924-25. Corpus Christi likewise shows a distorted number due to one drought of 17 months, but at this position the actual variability is quite high. It is interesting to observe that where the normal precipitation is 36 inches per annum, as in the lower Colorado and Brazos Valleys, there may be as many as 25 drought periods in 40 years, and at Austin, Tex. (34 inches annual), the number 32 seems to have high significance. It is thus evident that local topography is probably very important and that portions of this area are watered only when there are southeast winds directly from the Gulf. If the wind holds from a more westerly origin, precipitation is likely to fail. It is desired to emphasize this point, because it exemplifies a condition which prevails throughout the western part of the Plains; namely, that winds which originate west of the Gulf of Mexico bring nothing but dryness.
|
| FIGURE 26.—Number of 4-months droughts in the 40 years 1895-1934, or their equivalent in effect, computed in geometric proportion in their length. (click on image for a PDF version) |
In the central portion of the Texas-Mexican border it is seen that a nearly maximum number of 40 drought periods has occurred, even this region of low precipitation being quite dependent on easterly or southeasterly winds from the Gulf. Further west, El Paso, with 42 drought periods in 40 years, represents a low point in an essentially enclosed desertlike basin.
The next focus for variability in precipitation is southwestern Kansas.21 Noting that the High Plains of Texas have a lower drought frequency than might be expected in their longitude and position, and also that the frequency is low in all of the mountain area and even in the lesser elevations of northeastern New Mexico, the droughty spot in southwest Kansas is not difficult to explain. The comparatively low normal precipitation of this area contiguous to the Arkansas Valley helps in an understanding of its occurrence. Evidently, it is so shut off by higher land to the south, and even to the southeast, by the extension of the High Plains, that it receives precipitation only under the most favorable conditions. If, rarely, a south or southwesterly wind might be moisture bearing, such moisture would be precipitated on either the High Plains to the south or the New Mexico mountains farther west, also, an open lane is provided for desert winds from the Pecos Valley to reach this area. This focus is so marked and so important to much land to the north as to suggest the need and desirability for extensive water impoundment in the upper reaches of the Cimarron and North Canadian Rivers.
21While Ulysses, Kans., is the high point as regards the arbitrary measure of drought frequency used, its index of variability, 0.808, is not as high as that of several points along the Arkansas valley to the west—the peak of 0.855 being reached near La Junta, Colo. In general aspects, however, the mathematical basis of measurement confirms the arbitrary measure chosen and shows dry "prongs" to the north. east and northwest of Ulysses.
From this center,22 droughty alleys are to be noted extending to the north-northeast as far as southern Nebraska, and also to the northwest over the hard plains to Akron and Fort Morgan, Colo.
22This is notably the area in which severe drought persisted longest in the spring of 1935.
Between these two dry alleys is an area in northwest Kansas which is scarcely higher than the surrounding territory but noticeably dissected by the headwaters of several streams. Here the rougher topography seems to have some ability to induce precipitation locally and occasionally to end a drought period. Where dependent on only 1 or 2 stations, such a local showing may be, however, due to some fortuitous circumstance in the record.
It has been noted that the large area of sand hills in Nebraska (20,000 square miles) does not seem to attract any unusual precipitation by reason of its roughness, but on the contrary, in its southwestern sector at least, appears to have a tendency similar to that of a valley. The fact that scattered records for the sand-hill region imply a lower drought frequency23 than any area in the Plains in this longitude indicates that this region is capable in a large measure of "creating" its own moisture supply by conserving it. That disappointing phenomenon of the Plains proper, the local thunderstorm which appears but does not materialize, is far less frequently known in this area, where nature created a natural reservoir and man has not been able to drain it. That super-heating from sandy surfaces during the hours of sunlight may assist in producing effective local convection cannot be denied. This may be judged better after noting the temperature conditions of the sand-hills.
23Hay Springs, near the northwestern edge of the sand hills, has a lower index of variability (0.593) than any station along the eastern edge of the area considered in this study.
There is noted again in South Dakota the intrusion into the central portion of the State of the droughty conditions which are also expressed in the low annual rainfall. Here, apparently, exist conditions which are almost the exact antithesis of those of the sand hills. In the heavy soils and rolling topography of South Dakota west of the Missouri River, run-off bears a very high ratio to precipitation. This is most true of the White River Badlands, but hardly less so of the bare bluffs of the wide Cheyenne Valley. The failure of moisture to penetrate deeply the clay soils is mainly responsible for the quick dissipation of the rainfall received. Excessive heating in dry weather results. Further, when only moderately moist winds reach this very flat section, there is no topographic relief to assist in precipitating the moisture. From the position of this dry belt, it would seem to be related in some way to the heavy precipitation of the Black Hills, which mountain mass is responsible for convectional storms. An explanation of such an effect upon the adjacent Plains region cannot be offered when one considers that the moisture-bearing winds do not come from the west.
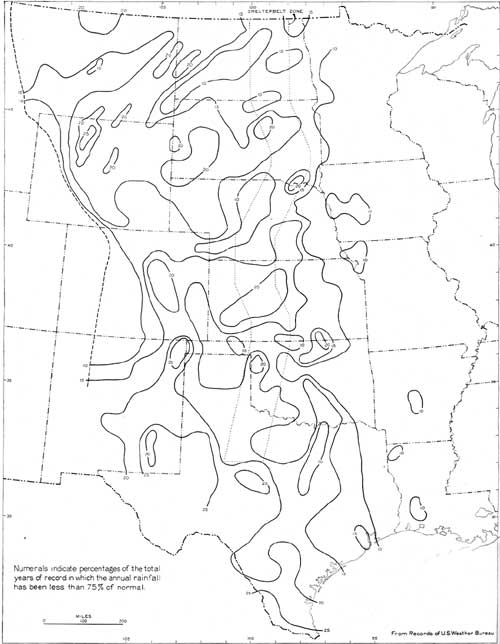
DROUGHT YEARS
Another basis for considering variability of precipitation or frequency of droughts is by use of the annual total amounts. Since a low moisture condition for an entire year is more serious in its practical effects than one of only 4 months, it is probable that a rainfall of less than 75 percent of normal may mean about the same thing as less than 60 percent for the shorter period. The showing made on this basis (fig. 27), however, is only in very rough agreement with the showing on the basis of 4-month droughts, the effects being less definitely localized, probably because of the use of fewer stations in this year-long calculation. Points which are again emphasized are: High drought frequency in the southwestern part of the Plains region, this area being separated from the Kansas area by one of greater uniformity of precipitation in the Panhandle of Oklahoma and in extreme southwestern Kansas; very favorable conditions in the eastern portion of the Nebraska sand-hill area and to the northeast and southwest of it; fairly high drought frequency east of the Black Hills of South Dakota; important favorable areas extending across North Dakota and also between the Missouri and Yellowstone Rivers in Montana. All of these points are suggestive of great possibilities for localizing the danger spots for agriculture as well as for tree planting, especially as longer weather records are obtained and the methods of analysis are carefully studied as to their practical meaning.
For other maps based upon still different approaches to the matter of drought, but usually bringing out the same more important characteristics of the region, the reader is referred to pages 8 and 40 of the Atlas of American Agriculture, II, A, 1922.
|
| FIGURE 27.—Drought frequency as shown by percentage of full calendar years having less than 75 percent of normal precipitation. (click on image for a PDF version) |
CYCLIC VARIATIONS AND GENERAL CHANGES IN RAINFALL
While the preceding discussion has been concerned with the changes in precipitation from year to year, or with a comparison of corresponding months in different years, it is well known that there are wet and dry cycles, or successive periods of considerable duration in which the rainfall may be almost continuously superabundant or deficient by comparison with the longest averages. It is the occurrence of protracted droughts which, periodically, raises a serious question as to the feasibility of agriculture in the western Plains region.
On no question is there greater divergence of professional opinion than on that of the causes of these wide variations. The lay mind can grasp and understand the theory of Humphrey's that, since the polar ice is gradually melting and receding and the polar climate becoming warmer, there may result less circulation of the atmosphere between the polar and tropical regions. But it is not so easy to grasp why in the course of such a change there should be violent, relatively temporary fluctuations. The thought that the intensity of the sun's heat might vary, through fairly regular sun-spot cycles, by as much as 2 or 3 percent, has given rise to hope that other variations in the climate of the earth might be understood, but Brückner24 has pointed out that in Europe either wet or dry cycles may coincide with the periods when the heat of the sun has been most intense. Elsewhere, considerable doubt has been expressed as to whether variations in rainfall are, properly speaking, periodic at all.
24Loc. cit. (see footnote 18, p. 88)
Brückner, who examined all possible sources of information in Europe, some of which anticipated by centuries the accurate recording of meteorological phenomena, but which also included a few rainfall records starting about 1700, showed that there has been a fairly regular sequence of rainfall cycles averaging about 35 years in length from trough to trough or peak to peak. The individual lengths vary considerably, however, and there are minor cycles within the major changes which may, at times, make it difficult to recognize a major peak or trough, especially where the evidence is not of a very exact character.
Of the long records in Europe readily available that for Padua, Italy,25 which has been kept at the university since 1725, is probably a fair sample. Padua, in latitude 45° north, corresponding to that of central South Dakota, is on the low Venetian plain at the head of the Adriatic Sea, surrounded by mountains forming a semicircle to the north. Presumably it is at times cut off from moisture from the Mediterranean by the mountains of the main peninsula of Italy. Also, beyond the Mediterranean lie the deserts of Africa and, without doubt, winds from the south sometimes fail to gather sufficient moisture to offset the desert influences. There are, because of topography, various spots almost on the shores of the Mediterranean which at times are very arid, and any impression should be dispelled that the Mediterranean region as a whole receives regular and abundant rainfall.
25For the year-to-year record, see Monthly Weather Review, October 1923, p. 515, and July 1934, p. 250.
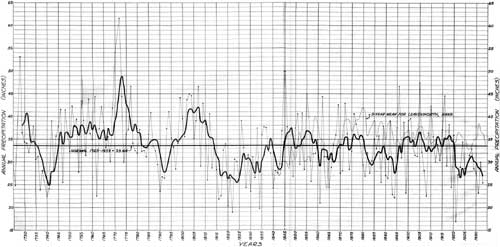
The record for Padua, as represented in figure 28, is of interest in showing, during the 209 years, five complete rainfall cycles with an average length of 35 years, and during the entire period a gradual decrease in the amplitude of the extremes. At the same time, the average amount has declined, so that the 209-year mean of 33.58 inches has been attained in only 44 years since 1812. Considering 35-year progressive means (since that is a period in which both high and low extremes may generally be reached), and dating by means of the eighteenth year in any group of 35 years, the progressive means reached a high point of 38.24 inches in 1761, which has not been approached even remotely since that time. The extreme low of 29.89 inches as a 35-year average centers upon 1827, and since then the highest average attained has been 34.34 inches in 1861. The last year for which such an average may be computed, 1916, shows the position as 31.75 inches.
|
| FIGURE 28.—Two-hundred-and-nine-year precipitation record for Padua, Italy, based on 5-year means, including 4 years preceding the date entered; similar curve for Leavenworth, Kans., superimposed. Dots indicate current precipitation (Padua). (click on image for a PDF version) |
Since 1921, which was also the approximate beginning of the current drought in the northern Plains region, a surprising number of dry years have occurred, only 1924 being above normal.
Although it would be too much to expect that conditions which caused a shortage of precipitation for one year or a series of years, in our Mississippi Basin, should be felt around the world or even throughout the North Temperate Zone, there are times at which a remarkable parallelism exists between this record for a European station and the record for Leavenworth, Kans. This must bring a realization that the causes which produce the wide swings in precipitation are in no sense local, although it does occasionally happen that a restricted locality may for several years at a time be subjected to greater extremes than other localities nearby. An occurrence of this kind must be ascribed entirely to "chance" variations. The study of standard deviations shows the possibilities of abnormality in any individual record to be very great.
The longest records available in the United States which are sufficiently close to the Plains region to reflect even remotely the conditions which are encountered in the region under discussion are those for St. Paul and Minneapolis, Minn., beginning in 1837; for Leavenworth, Kans., beginning in 1836; and for Manhattan, Kans., beginning in 1858. A partial early record for Fort Scott, Kans., 1843-52, is of value only in showing that the all-time low of 15.94 inches for Leavenworth in 1843 represents either an error in recording or an extremely local condition, for Fort Scott, approximately 100 miles farther south, had in that year 3 inches more than its average of 41 inches.
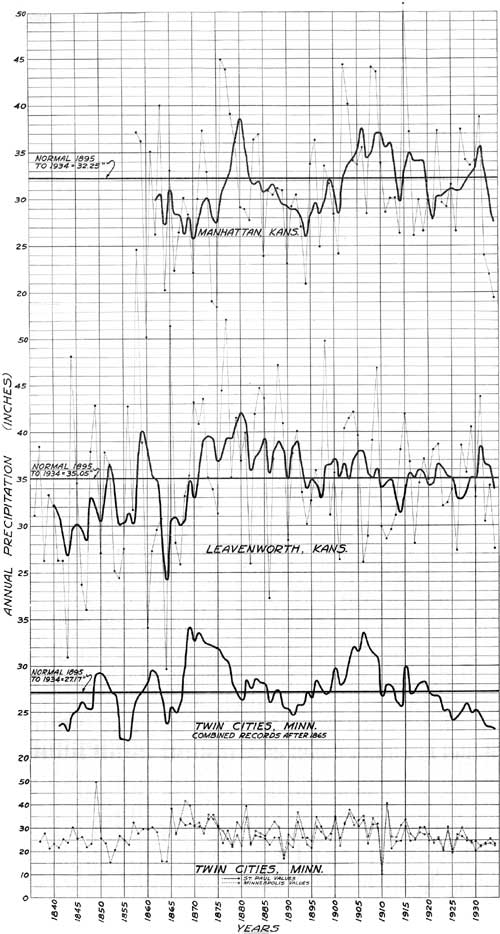
The earliest portions of these American records may be subject to question because of the vicissitudes under which they were made, in Army camps, and also because the equipment available for catching precipitation was not so satisfactory at that time as now, and less was understood as to the conditions necessary to obtain full catches in gages of any kind. Since the errors of precipitation records in a great majority of cases arise from failure to catch or hold in the gage the full amount which falls, and since this applies particularly to snowfall, examination has been made of the Twin Cities (St. Paul and Minneapolis) record, comparing the first 20 years with the last 20 (fig. 29). The mean annual amounts for these two periods happen to be almost exactly the same, slightly over 25 inches per annum. Of the respective amounts, 18.7 percent was recorded during the snowfall months of November to March in the earlier period, and 24.4 percent during the corresponding months of the past 20 years. This cannot be taken as proof that there was failure fully to record snowfall in the early days, but is strongly suggestive of such a tendency. If the figures were accepted at face value, assuming that there had been no actual change in the seasonal distribution, the early annual amounts would have to be increased by about 1.75 inches to make up the apparent deficit in snow measurement.
|
| FIGURE 29.—Long-term rainfall records at stations near shelterbelt zone. Heavy lines indicate 5-year averages plotted on fifth year; light lines and dots indicate year-to-year precipitation. From records of United States Weather Bureau. (click on image for a PDF version) |
Using the single record which was available before 1866 and the combined records for St. Paul and Minneapolis since that time (which tends to level out discrepancies between the two points, in one case a difference of 10 inches in the annual totals), it is found that the 98-year average through 1934 is 27.21 inches, 0.04 inches more than the normal of 1895-1934. It was 27.41 ± 0.59 inches during the first 49 years, and during the last 49 years 27.01 ± 0.49 inches. In statistical terms, such a decrease is not in any sense significant. In fact, if there were added to the average for the first period practically the entire amount of the error of measurement described above as a possibility, or if, for example, the first average were considered to be 29 inches against the more recent average of 27.01 inches, the difference between the two periods would still not be significant. Altogether, it must be said that in this record there is not the slightest proof of a permanent tendency either up or down.
We may recognize in this entire record, droughts or troughs of precipitation culminating in 1843, 1856, 1864, 1880, 1891, 1914, and 1934 or later, on the basis of the 5-year means, which is possibly as short a period as can have much significance in creating a deficiency, at least from the standpoint of tree growth. Of these seven depressions, 1856, 1891, and 1934 are probably to be considered the ends of long cycles.
On the basis of 35-year averages, the high point of the entire record, 28.78 inches, centers upon the year 1882, and the lowest average, 26.93 inches, is for the first 35 years, centering upon 1854. This is slightly lower than the average for the period which comes up to 1934. Since the record in 1837 began upon a very low scale, it seems altogether probable that a century ago there was being experienced a drought of greater severity than any since known, although here, again, it is necessary to keep in mind the possible deficiency of the early measurements. Such a deep depression would correspond to the low in the Padua record centering on the year 1827.
The record for Leavenworth (fig. 29) is in some respects very different from that for the Twin Cities. The principal differences are the much greater depression at Leavenworth (5-year means) than at the Twin Cities in 1854, and the great build-up to 1880, when the Twin City precipitation was suffering a considerable decline. Likewise, the high of 1869 in the Twin Cities is represented by a minor peak at Leavenworth somewhat below the general average.
The only striking point of similarity in the two records is the gradual build-up from the beginning to about 1860, after which both records show many more years above the normal line than below. This phenomenon is more striking in the Leavenworth record than in that for the Twin Cities however which has given rise to the belief held by many that the precipitation for the southern portion of the Great Plains is definitely increasing.
But, if the two halves of this period be compared, as was done before, it is found that there has been practically no difference, and certainly no significant difference, in the average amounts of precipitation. The period 1836-85 shows an average of 34.38±0.89 inches, the period from 1886 to 1934, 35.18±0.57 inches.
The 35-year moving means started at an extreme low of 32.23 inches for the period centering upon 1853 and rose, with only slight recessions, to peaks of 36.52 inches in 1873, 37.38 in 1882, and 37.73 in 1887. Since the last date the recession has been almost as steady, and since 1900 the average has at no time been above 36 inches. It was 34.95 inches for the last 35 years of record, Thus the all-time high, on this basis, came just 5 years after the corresponding high point in the Twin City record, while on the basis of 5-year means the times are 1880 and 1869, respectively.
The comparison of the record for Leavenworth with that for Manhattan, Kans., 100 miles west and more nearly approaching arid conditions, shows much the same timing of droughts and wet periods, although Manhattan experienced a series of quite dry years, 1917 to 1921, in which conditions at Leavenworth were practically normal. Even the slight differences in the 5-year means for these two stations, and the much more marked differences in trends of the successive years, serves to show how completely unreliable for the drawing of any general conclusions the record of a single station must be.
The first 37 years of the Manhattan record (fig. 29), including the low year 1894, averaged about 2 inches less per annum than the second period of 40 years, which is a fairly complete cycle. Again, however, the difference between these two periods is not sufficient to be certainly indicative of a trend in one direction. If the division is made so as to include 49 years in the second period to correspond with the Twin Cities and Leavenworth, the average is only 0.94 inch higher in the last period.
FLUCTUATION OF RAINFALL IN REGIONAL SUBDIVISIONS
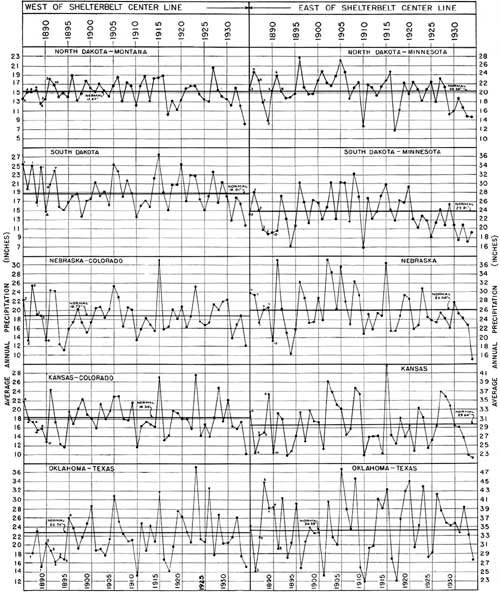
In order to eliminate discrepancies which are certain to occur in the record of any single station, to obtain a fair basis for comparing the severity of the present drought with the preceding major depression, and to illustrate the fact that frequently one small section of the Plains region is affected by much more severe drought than other portions, group averages for 5 latitudinal zones east and 5 west of the shelterbelt zone have been computed for the past 50 years. It was at first hoped to include about 10 stations in each group, but in some groups it was found impossible to obtain so many without covering too great a range of longitudes. Consequently, the smallest group contains only 4 stations, the others from 7 to 10. In each group, except the western portion of the Oklahoma-Texas area, the records for some of the stations begin as early as 1885, but the full complement of stations does not become available until 1890-92. Consequently it must be understood that the beginning of each record is not accurate, being built up on the later established ratio of precipitation at a few stations to that of the entire group, a ratio by no means constant from year to year.
Figure 30 shows the annual averages in each group, which are considerably less variable than annual amounts for single stations. In order to develop facts which are shown only by the moving means for 5- and 10-year periods, a summary is offered in the paragraphs below. It should be borne in mind that in referring to the means for 5 and for 10 years, there always is implied the period leading up to and including the year mentioned. The normals referred to are averages for the period 1895-1934 as used through out this report.
Eastern North Dakota and Minnesota.—Normal for 8 stations, 20.38 inches; highest, 27.02 inches, 1905. Current low, 14.72 inches; lower in 1917 (11.57 inches), 1910, and 1889. Last 5 years, 16.26 inches; has not approached this depth previously. Last 10 years, 18.14 inches; lowest. Since 1917 the averages have all been below normal except 10 years to 1928.
Western North Dakota and Montana.—Normal for 10 stations, 15.27 inches; highest, 20.66 inches, 1927. Current low, 8.12 inches; previous low, 10.27 inches in 1917. Last 5 years, 12.52 inches; previous low was 12.91 inches to 1921. Last 10 years, 13.98 inches; lower to 1926, 13.93 inches. Since 1919 only four of the 10-year averages have been up to normal.
Eastern South Dakota and Minnesota.—Normal for 10 stations, 23.91 inches; highest, 32.06 inches, 1908. Current low, 17.12 inches (1933). Lower in 1914 and 1894. Last 5 years, 19.11 inches. Previous low was 20.38 inches to 1891. Last 10 years, 20.58 inches. Previous low was 21.61 inches to 1895. All averages 1925 and later below normal.
Western South Dakota and Wyoming.—Normal for 7 stations, 18.91 inches; highest, 27.50 inches, 1915. Current how, 11.82 inches. Previous low was 13.70 inches in 1910. Last 5 years, 15.49 inches. Previous low was 16.38 inches to 1913. Nearly as low in 1898. Last 10 years, 17.28 inches. Equalled for 10 years ended 1902. Only since 1932 have 10-year means been below normal.
Eastern Nebraska.—Normal for 10 stations, 26.04 inches; highest, 37.21 inches, 1902. Current low, 15.02 inches. Previous low, 16.33 inches in 1894. Last 5 years, 22.91 inches. Previous low, 23.61 inches to 1914. Last 10 years, 23.34 inches. Previous low, 24.56 inches to 1901. All 10-year means since 1925 have been below normal.
Western Nebraska and Colorado.—Normal for 9 stations, 18.73 inches; highest, 25.28 inches, 1905. Current low, 12.10 inches. Lower in 1894. Last 5 years, 16.80 inches. Lower to 1914 and 1897-90. Last 10 years, 18.14 inches. 18.15 inches to 1919. Eight years between 1895 and 1903 showed 10-year averages lower than these. Did not drop below normal in present movement until 1933.
Eastern Kansas.—Normal for 10 stations, 29.64 inches; highest, 42.95 inches, 1915. Current low, 22.35 inches. Previous lows, 22.76 inches 1910, 22.82 inches 1893. Last 5 years, 26.11 inches. Lower to 1914. Last 10 years, 29.24 inches. Not significant because of high 1927-29. Averages were much lower to 1895, 1919, and 1925, with many others lower than 29.29 inches.
|
| FIGURE 30.—Precipitation in 10 divisions of the Plains region during the last 50 years; averages for groups of stations. Numbers opposite points indicate number of stations reporting, until full number in each division is reached; early data adjusted as explained in text. From records of United States Weather Bureau. (click on image for a PDF version) |
The long records for Manhattan (included in these averages) and Leavenworth do not entirely agree with this composite record, but the differences are not important. The Manhattan record shows the current conditions (5-year averages) exceeded by droughts of 1864 and 1875. At Leavenworth the conditions were worse in 1843, 1854, and 1864, but the extreme severity of the 1843 drought seems questionable or very local in character when the Fort Scott record is compared.
Western Kansas and Colorado.—Normal for 10 stations, 18.34 inches; highest, 27.54 inches, 1923. 1915 and 1891 also good. Current low, 10.05 inches. Previous low, 11.60 inches in 1894. Last 5 years, 16.27 inches. Lower to 1914 and 1896. Last 10 years, 17.25 inches. Lower to 1919, 1917, and 1894-98. Only the last 2 years of recent drought have 10-year means below normal.
Eastern Texas—Oklahoma.—Normal for 8 stations, 34.83 inches; highest, 47.69 inches, 1905. Current low, 27.67 inches. Lower in 1917, 1910, 1909, 1901, 1896, and 1886. Last 5 years, 33.95 inches. Lower, 31.47 inches, to 1897 and 30.28 inches to 1913. Last 10 years, 35.11 inches. Only one 10-year mean since 1920 has been below normal. The lowest values are 32.17 to 1918 and 32.40 inches to 1902, but on 10-year basis this region practically has no droughts.
Western Texas-Oklahoma.—Normal for 4 stations, 22.74 inches; highest, 37.18 inches, 1923. Current low, 15.13 inches. Lowest, 13.08 inches, in 1910. Also lower 1917. Last 5 years, 20.16 inches. Lower 1912 and 1891-96, lowest, 17.54 inches, to 1893. Last 10 years, 21.87 inches. Lower 8 periods to 1903, also 1910-12, 1916-19. Nine out of last 12 averages are above normal.
Widely separated stations show somewhat the same cyclic trends in precipitation but varying in degree, and, even in regions not widely separated, the years in which extremes of a movement are reached may vary considerably. Such discrepancies appear even when moving means or cumulative amounts for a period of years are employed, so that graphs for neighboring areas are often dissimilar in their timing and amplitude. In short, even in drought periods or periods of excess, local variations, wholly unaccountable, play a large part in shaping the records.
Nearly every section of the Plains regions has experienced drier years than 1934 and drier 5- and 10-year periods than that ended in 1934.
The early portions of the Twin Cities and Leavenworth records, taken in conjunction with the Padua record, indicate the possibility of drought conditions about 1825-40 much worse than anything shown since settlement of the Plains. Explorers about this time might have had better reason than we realize for describing the Plains as the "Great American Desert."
While there has been no significant change in the mean amounts of precipitation in areas adjacent to the Plains in the second as compared with the first half of the past century, this does not prove that a slight change in one direction or the other may not be under way. The fact, however, that the apparent change is in opposite directions, downward in the north and upward in the southern portion of the area studied, again detracts from the significance of any change whatever.
If there has been any change which is significant and apparent in all the long records consulted in this connection, it is a decrease in amplitude of the variations from year to year and from period to period. If this is not sufficiently apparent from figures 29 and 30, it is readily proved by the smaller standard deviations and probable errors in the later periods of the two 100-year records which have been presented. Thus in the case of the Twin Cities record, the amplitude, as shown by standard deviations, was about 20 percent greater in the first period, and in the case of the Leavenworth record about 57 percent greater. A similar, rather steady decline can be shown by 50-year periods through the entire length of the Padua record.
There is a possibility that such a change as this, toward a more even distribution of precipitation in point of time, may be related to changed conditions on the earth's surface, although no such contention can be conclusively proved because there is no manner in which possible changes in cosmic conditions can be eliminated from consideration. However, the following possible reasons for a steadying of the rainfall of the Plains region are offered for whatever they may be worth—possibly only to suggest a line of investigation by which some more certain proof of the importance of surface conditions may be obtained.
1. The importance of moisture turn-over within any continental area has already been stressed. From this standpoint, quick evaporation of any moisture which falls is a factor tending to increase the total rainfall. Thus it is obvious that for the Plains region as a whole, if all rainfall ran back to the sea, or if all of it were held in the soil, or in ponds or lakes without evaporation, the precipitation would shortly be down to possibly one-fourth of what it now is, and certain areas more or less shut off from Gulf winds probably would receive little or none.
2. At the same time, it is evident that quick evaporation must serve to emphasize the differences between wet and dry periods. No argument is needed to show that, if a given part of a region does not conserve or retain any of its moisture, and if replenishment from the Gulf source is temporarily witheld, there is little possibility even of local thunder-showers.
3. It is believed that the fine soils of the flat Plains region were, in their native state, peculiarly susceptible to quick loss of a very large part of the rain which fell upon them. Even with normal or more than normal amounts of rainfall, storage in the soil during the winter and spring did not penetrate beyond a depth of 2 or 3 feet, and with the advent of the growing season this stored supply was quickly used up by the short-grass cover which typically had completed its growth cycle by June. Thunder-showers of the hot summer months would rarely wet the soil more than a few inches and would be rapidly dissipated back to the atmosphere. If excessive amounts fell in such showers, absorption into the soil was slow, resulting in a good deal of run-off which might be quickly lost from the region, or which went into small ponds on the plain. These, typically, dried up quickly and were dry during much the greater part of the warm season.
4. Cultivation of an increasing acreage during the last half of the nineteenth century, with a final large increase during the World War period, modified these conditions considerably. It may be granted that the raising of grain crops on the land fully utilizes all moisture which could be accumulated, yet under cultivation there was considerably more opportunity for accumulation than in the unbroken prairie soils under sod. In ordinary farming practice, there is better opportunity for absorption and also better protection from direct drying of the soil, both while the crop is growing and after it is harvested. The stubble is a considerable aid to moisture retention throughout the long period when some accumulation is possible. Fall plowing also permits good absorption and good protection merely by roughening the surface, as compared with a smooth, short grass cover. Invariably a field which is being used will show in the fall, winter, or early spring, moisture penetration to greater depth than a sod area of the same soil. Moreover, in any farming region there is invariably a percentage of the land fallowed each year unintentionally or with the direct purpose of storing moisture. In short, there is at all times a considerably higher level of storage moisture under agriculture than under natural Plains conditions. Probably the growing of winter wheat is less conducive to storage than the usual line of summer crops and, in fact, it is possible that with a living crop on the land through the winter there is less storage than there would be otherwise at this season. It is possible that winter wheat in the South has increased the rate of winter turn-over of moisture and since, at that season, winds are much less persistently from the south than is the case in summer, this turn-over may have resulted mainly in a local increase in precipitation. So far as this is the case, it does not imply a shortage of moisture at other seasons. Some such difference as this may explain a present apparent difference between the northern and southern portions of the Plains region.
5. In short, then, although this is purely inference from known facts and cannot be proved as regards the meteorological results, it appears that cultivation of the land means a greater degree of conservation of the moisture supply through longer retention in the soil, less total turn-over and consequently fewer turn-overs in any given period, and decreased total rainfall—but, because of more moisture held in reserve, less liability to great extremes of drought and abundance.
That a similar change in the character of the precipitation graph is apparent in one European record,26 which has been discussed, does not imply that the same set of changes have affected this record, nor that the settlement of North America has exerted an influence on European conditions during the past century. In the case of Padua, three distinct modifications of the surrounding territory had occurred by about 1900 which might have affected the local atmospheric moisture supply, although not necessarily all in the same direction. These were: Improvement of the Nile irrigation system from 1861 to a recent date, which has kept the acreage irrigated more uniform despite variations in the regimen of the Nile; reforestation in the Karst region to the east, beginning in 1842, which by 1909 had greatly improved the cover conditions on more than 400,000 acres; and drainage of about 600,000 acres in the River Po region prior to 1900, doubtless augmented by some drainage in other parts of the Venetian plain. It is, of course, a different story from the settlement of the Plains in the United States.
26Brückner suggests a tendency for the world precipitation to go to somewhat greater extremes toward the end of the period included in his studies, but this tendency was in large measure due to the introduction in the nineteenth century of records of stations in North America, where the periodic variation of rainfall is wider than in most of continental Europe.
Insofar as these appearances of an effect of agricultural development in slightly stabilizing the rainfall of the Plains may be accepted as at all logical or likely, they suggest the possibility of further stabilization and avoidance of moisture extremes through further and more intensive agricultural development, through successful storage, both in the soil and in ponds and lakes, of some proportion of the rainfall which, under existing conditions, is entirely lost to the region through run-off, and through the planting of trees. The ability of forested areas to absorb and to store temporarily in the soil almost unlimited quantities of rain, as well as to protect some adjacent areas from rapid evaporation is beyond dispute.
RELATIVE HUMIDITY AND EVAPORATION
The map (fig. 31) Shows the mean relative humidity for the Plains region throughout the year, together with the more important records available for warm-season, in inches, from the free-water surface of a pan. This map was prepared from data recorded by various agencies, as indicated. It relates to the 15-year period 1917-31, except as noted in small figures within station symbols.
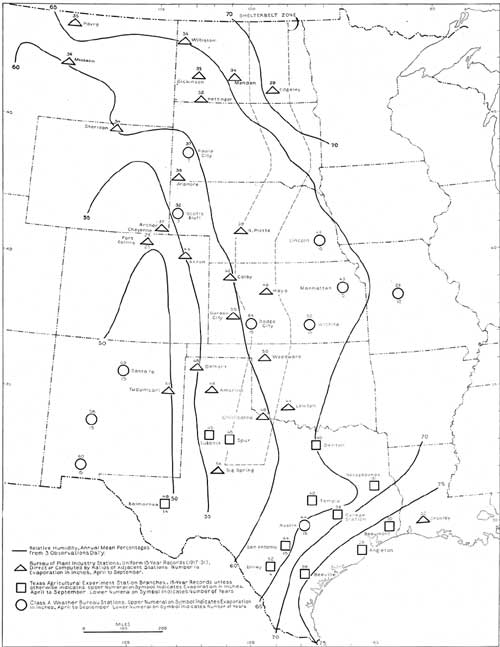
|
| FIGURE 31.—Mean relative humidity (percent) and amount of warm-season evaporation of individual stations (inches). (click on image for a PDF version) |
The outstanding feature of the lines indicating equal relative humidities is their general parallelism with the Rocky Mountain Range. Although each line dips back to the south within the mountain area because of the low temperatures prevailing there, in any latitude the lowest relative humidity is found at the base of the mountains, and an increasing degree of moistness is attained quite regularly to the eastward. This fact is, of course, intimately related to that dryness of the westerly winds which has already been noted, and which is a factor of such importance in causing the loss of the moisture which finds its way to the western edge of the Plains.
Rate of evaporation reflects temperature, relative humidity of the atmosphere, and the prevailing rate of wind movement. Thus, while the relative humidity as calculated is based on the capacity of the atmosphere for moisture at the prevailing temperature, it does not follow that with the same relative humidity the unsatisfied capacity, sometimes described as the vapor deficit, remains the same for different temperatures. Indeed, with a mean summer temperature in the South of about 85° F., and in the North of 65° F., the capacity of the atmosphere for additional moisture at any given relative humidity is about twice as great in the South as in the North. Notwithstanding this fact, in such a case as that of Austin, Tex., or of Williston, N. Dak., both on the line of 65-percent relative humidity, such a relation does not hold in the actual evaporation figures; here the relatively high evaporation in the North is due at least in part to greater wind movement, which for the 3 summer months averages 7.8 miles per hour at Williston as compared with 7.3 miles per hour at Austin. When the driest west winds occur at Williston moreover, the greatest velocities are recorded. But it must be remembered that the evaporation figures here considered apply to the warm season only.
A much greater difference between northern and southern latitudes is observed when the entire year is considered, for in the north the winter evaporation is practically nil, while in the south it continues at an important rate. Thus, for Austin, the average for 17 years27 shows only 68 percent of the evaporation occurring from April to September. Spur and Balmorhea, Tex., with 66 to 70 inches total free-water evaporation annually, show about the same percentage in the same months. Lubbock, with greater altitude and lower temperatures, has 72 percent of its total in the summer. The same percentage has been assumed for Big Spring, with only a summer record, making it slightly higher in annual total than Dilley, where the summer percentage is only 68. The annual allowance for Big Spring is probably not enough, considering that it is apparently warmer in the winter than Lubbock. The 4 years 1929-32 at Dilley were below average, so that its annual total should doubtless be about 80 inches also.
27Data quoted in this paragraph are from Tex. Agr. Expt. Sta. Bull. 484, Rate of water Evaporation in Texas, 1933, in which complete records for 20 stations are given. Records of stations credited on the map as State branch stations are taken from this source, mostly for the 15-year period 1917-31.
While evaporation through the winter has rarely been measured in the north, and is not feasible where pans are employed, a single year's record (1934) from the Forest Service evaporimeter at Denbigh, N. Dak., showed 87 percent of the total occurring in the months April to September. We need, then, allow a total evaporation for Williston of only 39 inches per annum, at which figure a true comparison is afforded with the annual average of 65 inches at Austin, Tex.
EFFECTIVE PRECIPITATION AS LIMITED BY EVAPORATION TRENDS
The preceding discussion of humidity and evaporation values merely serves to emphasize the great difference in effectiveness of precipitation in different parts of the region, based upon the much greater tendency toward quick loss of moisture from the soil under the high temperatures of the south and the greater absolute dryness of the west.
Within the narrow longitudinal range of the shelterbelt zone, it has been observed that on favorable, not too heavy soils a normal annual precipitation of 15 inches at the Canadian border seems to be about as effective in fostering tree growth as 22 inches annually in the latitude of the southern boundary of Oklahoma. This does not in any case imply an absolute limit to tree growth, but only a limit to what may be considered effective growth as regards height, density, and vigor. Moreover, tree growth is not limited by precipitation in irrigated valleys or those in which the water table is naturally maintained at a high level; this is also true of some very favorable sandy soils west of the zone limits.
Obviously, the normal precipitation, considered either alone or as its effectiveness is modified by evaporation, cannot be a satisfactory measure of the suitability of a locality for sustained crop yield or for tree growth, without taking into consideration also the frequency and degree of variations from the normal level. It is for this reason that considerable space has been given to a discussion of the frequent short droughts and of the longer changes in precipitation. But when all has been said and done with the present available physical facts, it is still fanciful to expect that the basis is available for saying that at one point crops will succeed and trees will survive through the longer climatic cycles, while at another point either or both will succumb. There is no means of measuring the persistence of human endeavor except through long experience, and in the borderland there is as yet no accurate means for determining, except by observation after the occurrence, whether trees have the capacity to survive a certain combination of physical conditions.
In consequence of the large number of variables involved, any attempt to solve the problem of the "limit of feasible agriculture and tree growth" by formula in lieu of observation or experience is obviously fraught with dangers and weakness. The results may have general value but can rarely be expected to fit the individual or very local situation. Moreover, in the words of Russell28:
A climatic boundary is not a precise line * * *. It is an attempt to approximate central position within a zone of change. In regions of great hypsometric (altitudinal) contrast, such zones will often be quite narrow and climatic boundaries * * * fairly precise, but in a flat country such is not the case.
28RUSSELL, R. J. DRY CLIMATES OF THE UNITED STATES. I. CLIMATIC MAP; II. FREQUENCY OF DRY AND DESERT YEARS 1901-1920. Calif. Univ. Pubs., Geogr. 5: 1-41, 245-274, illus. 1932.
Both Russell and Thornthwaite29 have attempted to classify various sections of the United States on the basis of precipitation-evaporation balances and frequency of dry years. Russell's work is confined to arid and semiarid regions. In his general map (1931) a line has been drawn on the basis of climatic records correlated with soil and vegetation conditions practically corresponding to the boundary between the shelterbelt zone and the short-grass Plains. This is defined as the eastern limit of the cold-steppe region from North Dakota to southern Kansas and of the warm-steppe region south of that latitude, both having climates characterized by precipitation shortage during the winter. Although the definition of different climates is based upon a relationship between rainfall and temperature, with a consideration of the seasonal distribution of rainfall, it is not necessary to go into the matter more fully here.
29THORNTHWAITE, C. W. THE CLIMATES OF NORTH AMERICA ACCORDING TO A NEW CLASSIFICATION. Geogr. Rev. 21 (4): 633-655, illus. 1931. Dr. Thornthwaite has personally aided in the present study.
Russell's second work involves a consideration of essentially the same data, but instead of defining climatic zones by means of the average precipitation and temperature for a period of about 20 years for each station, he has considered each year on its own showing. The line, to the west of which more than 10 out of 20 years have shown a dry or steppe climate, does not correspond exactly to line for mean values, west of which the same type of conditions prevail. Some slight difference is to be expected in the results of the two methods of calculation and, in this case, it is not at all important. Consequently, there has been reproduced in figure 32 the line A on which, during the period 1901-20, just half of the years had steppe climatic conditions.
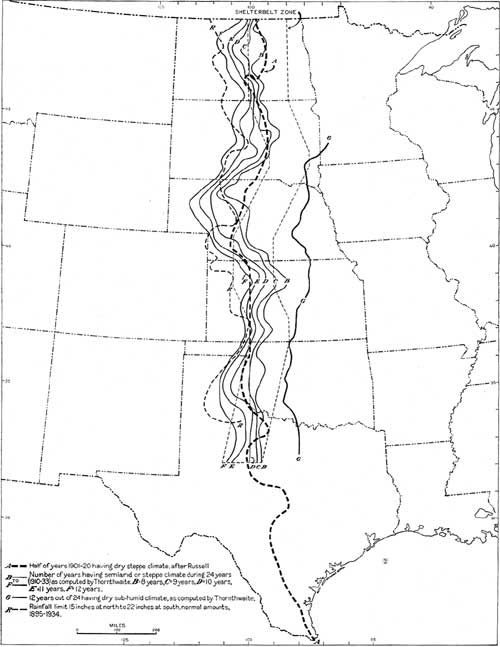
|
| FIGURE 32.—Lines of equal moisture efficiency by various standards. (click on image for a PDF version) |
The method employed by Thornthwaite to determine the degree of aridity of climates and of individual years in the records of a large number of stations is also based upon a formula employing precipitation and temperature, after calculating from a number of precipitation, evaporation, and temperature records the functional variation of evaporation with temperature.
The result of computations from his formula is the setting up of precipitation-evaporation quotients for months, and indices for years by addition of the quotients. The arbitrary divisions of climates selected by Thornthwaite are given the following numerical limits in terms of the final index values:
Humid forest 64 to 127. Subhumid grassland 32 to 63. (Below 48, dry subhumid short-grass) Semiarid steppe 16 to 31. Arid desert Less than 16.
It was found desirable to distinguish between climatic zones on the basis of the character of the seasonal distribution of moisture, but since the entire region with which we are concerned is considered to be relatively deficient in precipitation at all seasons, it is not necessary to make any such distinction in the data to be considered. However, a division between the temperature efficiency of the northern and southern Plains regions is made in northern Kansas.
The data as prepared by Professor Thornthwaite specifically for this report and brought up through 1933 in order to include the recent dry years, together with Russell's critical line and the empirical precipitation limit (corrected only for temperature as indicated by latitude) are shown together for purposes of direct comparison in figure 32.
Five of Thornthwaite's lines, representing respectively from 8 to 12 years of semiarid climate, or 33 to 50 percent of the years from 1910 to 1933, are shown because it is felt that either the higher or lower of these values might be misleading if taken to define closely the limits of what may be called effective tree growth. By means of any of these lines, however it is possible to obtain the location of what, under this classification, are considered to be equally effective moisture conditions at different latitudes—differing, of course, from north to south in length and warmth of the growing season. If the F line, west of which the average conditions must be considered distinctly semiarid, be employed for comparison with the directly obtained rainfall limit, the outstanding difference in location and trends are: (l) The former does not start so far west in North Dakota but elsewhere maintains about the same position; (2) in South Dakota the F line does not bow so far east in the center of the State (the B line, it will be noted, shows this flexure to the east much more strongly); (3) in Nebraska it bows much farther to the west under the influence of comparatively low temperatures on the high plain west of the sand hills; (4) the F line eliminates more of northwestern Kansas but practically the same area at the southern edge; (5) it does not make as wide a sweep to the west on the High Plains of Texas. The differences in Nebraska and northern Kansas are probably all in favor of the F line, which is to say that this method of computation brings out clearly the advantages of slight variability in the precipitation in and adjacent to the Nebraska sand hills and the converse, very high variability in northwestern Kansas.
To some extent, the differences between the two lines may be due to the F line representing only the last 24 years of precipitation record, while the other represents 40 years and introduces relatively somewhat higher precipitation values in the North.
This is of course also true in comparing the A line with any of the others. On the whole, although giving different results, all of these lines are valuable, and principally so as they bring out rather marked differences within comparatively narrow latitudinal ranges. For the extreme latitudinal range of 15° to 16°, any such method may easily be greatly in error, at least with regard to the possibilities for any particular type of vegetation. As a matter of fact, the same types of vegetation do not exist in the North and the South.
TEMPERATURES AND THEIR SIGNIFICANCE30
30Since records which go hack to 1875 indicate a rather general rise in temperatures almost steadily from the earliest to most recent years, all quantitative data used in this discussion are averages for the period 1904-33, unless otherwise stated. This period gives a sufficient number of records for the necessary mapping and comparison of localities.
Temperature factors are here mainly of interest in their relation to the moisture supply. The annual mean temperature varies quite regularly from about 70° F. in lower Texas to 36°-38° at the Canadian border. The northern Plains near the northeast limit of the shelterbelt zone have the lowest midwinter average and minimum temperatures prevailing in any part of the United States, the latter reaching -10° for January. The southern Plains, especially near the mouth of the Rio Grande, have July average maximum temperatures above 100°, exceeded only a few degrees by those occurring in the desert areas of California and Arizona. The area in which the 95° maxima occur regularly in July extends nearly to the south-central boundary of Kansas, 90° well into southern Nebraska, and 85° reaches to northeastern South Dakota and southwestern North Dakota. Only a small area at the north end of the zone has July maxima normally below 80°.
TEMPERATURE VARIATIONS
WARM AND COLD WAVES
Among the most striking features of the Plains is the frequency of sharp changes in temperature in the spring and fall. While bareness and rapid radiation are factors, it is probably the speed with which warm or cold winds can traverse the area that gives rise to these frequent drops or rises in short periods. The average number of cold waves per year is slightly less than the number of warm waves, but the difference is not great enough to warrant separating them. Except for a few points along the base of the Rockies especially liable to Chinook effects, the most frequent changes (nearly 12 per year) of 45° or more occur in the center of the treeless Plains area and, perhaps significantly, close to the Nebraska sand hills, where quick radiation may permit either rapid rises or sudden cooling. The number of stations referred to in preparing the map of temperature changes (fig. 33) is not sufficient to bring out many local variations which might have some bearing on tree and orchard planting.
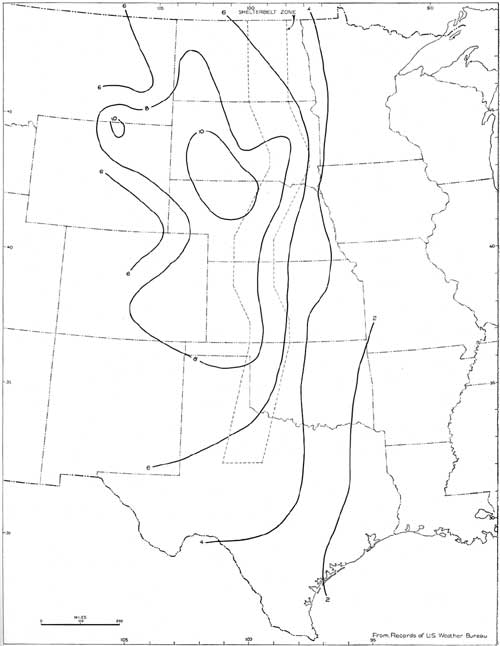
|
| FIGURE 33.—Average annual number of temperature changes exceeding 45° F. within 24 hours, 1898-1933. (click on image for a PDF version) |
Judging from the average maximum daily ranges, as tabulated by monthly periods for a considerable number of stations in the northern portion of the shelterbelt zone, the spring and fall periods are about equally liable to marked changes in temperature, with the midsummer period least changeable and the end of the year also fairly free from wide fluctuations. In North Dakota only June and July are much below average, with May, August, and September decidedly changeable, a fact indicating the shortness of the safe growing season. In South Dakota, June, July, and August are fairly safe, and the most critical months are April and October. In Texas the first 4 months of the year are most variable, with March leading, but there is a slight increase from a low period of variability in August to the end of the year.
From these facts, it is seen that the sharp temperature changes of the portion of the Plains in which our interest mainly lies are rather distinct from those felt at the eastern base of the Rockies resulting from "Chinook" winds. These warm winds are probably most frequent from January to March at most points, and frequently occur when the general temperatures have been quite low and the ground is frozen.
ANNUAL MEAN TEMPERATURES
Mean temperatures of about 65° F. for the entire year prevail across Texas at about the latitude of southern New Mexico (fig. 34). The direction of all of the lines up to about 48° showing a tendency to reach higher latitudes to the east suggests the effect of the Gulf or tropical warmth in the central Mississippi Valley and of a cooling effect of the mountains on the west. The effect of proximity to the Gulf is not only to modify extremes of temperature but generally to raise the temperature.
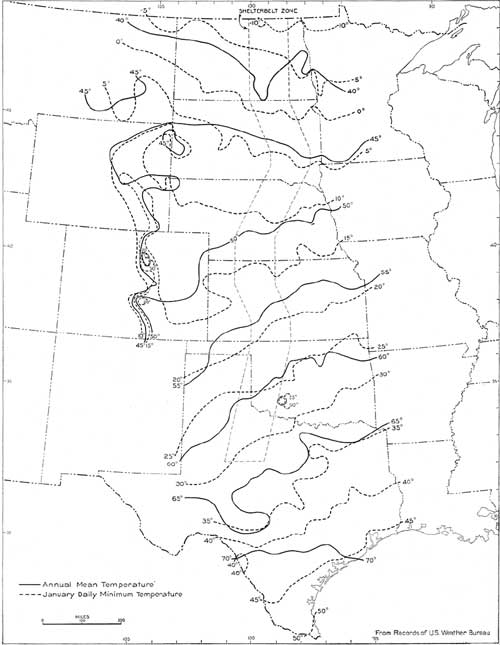
|
| FIGURE 34.—Annual mean temperature and January mean daily minima, 1904-33, or shorter records adjusted in the period. (click on image for a PDF version) |
North of about the 40th parallel the situation is changed. At the east end all northern temperature lines tend to be pushed south by the cooling effect of the Great Lakes, which absorb much of the energy of the sun and express it in the form of evaporation. During the winter the winds from much farther north generally have a strong sweep to the east, and their effect is less felt near the mountains, or is partly obliterated by warm descending winds from the mountains.
MEAN MINIMUM TEMPERATURES (JANUARY)
The means of the January daily minima are of more interest in connection with a general climatic study than in connection with this discussion, since the temperatures during the coldest month of the year, even in the mildest portion of the region, are not conducive to a high rate of evaporation or important losses of moisture.
The isotherms of low temperature take about the same directions as the mean temperatures for the year, those farthest north having the steepest dip to the southeast. The general parallelism which exists between the isotherm of January minima and of mean annual temperatures indicates clearly that the latter are most strongly influenced by winter conditions and only slightly by the variable highs of summer. The "port of entry" for the most extreme cold is seen to be in northeast North Dakota and adjacent Minnesota the north end of the Red River Valley of the North being prevailingly the coldest place in the United States during the winter.
The 15° isotherm, after dipping well to the southwest, strikes near the base of the Rockies in southern Colorado and extends to the north at least as far as Casper, Wyo. This illustrates the previous statement as to a winter-moderating effect from the mountains, felt at their eastern base, a situation exactly contrary to most popular conceptions. This is by no means due to warmth in the mountains, but to increasing pressure on the air, which is pushed down the eastern slope under the prevailing westerly winds.
The mean temperatures in January average about 15° higher than the average of the daily minima, the range varying slightly from place to place.
MEAN SUMMER TEMPERATURES
In order not to be misled as to the origin of summer heat which is sometimes thought to be wafted northward by the winds prevailing at that season, it is well to mention the mean temperatures of summer and of July before discussing the maxima. July is the hottest month throughout the Plains, with August normally 1° to 2° cooler and June from 5° to 8° cooler.
A map of mean summer temperatures for the period 1895-191431 shows only a small, narrow band along the lower Rio Grande having an average as high as 85° F. The entire Gulf coast region, however, has temperatures above 80°, the width of this band being considerably greater in Texas and Louisiana than eastward, where elevations are encountered not far from the Gulf. It is generally true that even slight elevations give lower temperatures than are dictated by the latitude.
31See Atlas of American Agriculture II, B (Washington, 1928). The averages for this period are likely to be somewhat lower than those for the period employed in the accompanying maps, since there has been a slight general increase in temperatures in recent years.
Centrally, the isotherm of 75° F. keeps a rather uniform distance from the Gulf (at about the latitude of St. Joseph and Terre Haute), but bows sharply southward along the eastern base of the Rockies and western base of the Appalachians.
Individual maps of mean temperatures for June, July, and August32 show similar characteristics, and in no case is there a hint of lower mean temperatures along the coast than slightly farther inland. From these facts and what will be shown in the following paragraphs, it may be inferred that, despite some lag in the warming of the waters of the Gulf, the air blown inland day and night at this season (when the winds are quite persistently from the south) is not appreciably cooling, although its temperature is probably much less variable, at different times, than the air over the land. There is, on the other hand, in the lower Rio Grande section of Texas and in the lowlands near the east coast of adjacent Mexico,33 an area from which some dry, hot air may be carried northward by winds. It is apparent, however, that the temperatures of summer days must be largely generated locally.
32Loc. cit. (footnote 31). These isotherms are too far apart to show whether slightly cooler temperatures occur along the coast.
33HENRY, A. J. HERNANDEE ON THE TEMPERATURE OF MEXICO, Monthly Weather Rev. 51: 497-509, illus. 1923. [Abstract.]
MEAN MAXIMUM JULY TEMPERATURES
In the mean maximum temperatures of midsummer are found the most significant relations to the dryness of the Plains, since several months of warm weather have, when this season is reached, largely dissipated the reserves of moisture accumulated during the winter. With precipitation falling off markedly after June, a greater degree of drought generally prevails in August than in July, despite the fact that temperatures are then very slightly lower. The maxima of July have therefore been selected for special study. Isotherms for this phase of temperature distribution are shown in figure 35.
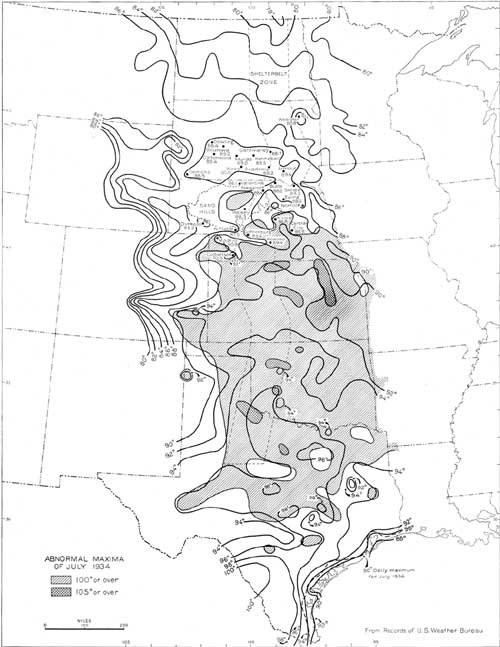
|
| FIGURE 35.—Average maximum temperatures of July for the 30 years 1904-33, or shorter records adjusted to the period, and drought maxima of July 1934. (click on image for a PDF version) |
Along that portion of the westerly Gulf coast which is mapped, the proximity of the water keeps the daily maxima down to 90° F. or slightly less, not more than 6° to 8° above the mean temperature of the period. Thence for a considerable distance inland the temperatures increase, despite higher latitude. On the 94th meridian, the increase is about 75° in daily maxima northward from the coast before any decrease due to latitude appears. The increase is somewhat greater, about 9°, northwestward from the locality of Galveston before there is any decrease.
Except for the area along the Rio Grande, whose high mean temperature has already been noted and whose maxima reach 100° F., the highest maximum temperatures are recorded in the Colorado and Brazos River Valleys of Texas, where a few points normally reach 98.5° for the average day in July. This warm zone is quite obviously cut off from the even warmer zone of the Rio Grande by the slight elevation of the plateau which lies between (maximum 94° or less), so that it seems extremely improbable that the heat developed at one point is really carried any appreciable distance northward.
The 96° isotherm, after making a long detour nearly to the southeast corner of New Mexico, swings back eastward and northward to southwestern Oklahoma, then returns southward entirely on the west side of the Gulf.
The 94° isotherm extends from southeastern New Mexico nearly north to southern Kansas, thence southward and eastward probably as far as Alabama before looping back more or less parallel with the coast line to the mouth of the Rio Grande.
The marked projection northward, in the vicinity of the 100th meridian, of all lines for this midsummer period, representing both mean and maximum temperatures, is rather clearly due to the increasing dryness inland and to the west, which means that a smaller proportion of the sun's heat is expended in evaporating the moisture which has reached the ground. That similar temperature conditions may, however, be produced with more abundant rainfall, by low elevation and restricted circulation of air in valleys, is shown by the fact that a similar projection of the isotherms for summer mean temperatures develops in the Mississippi Valley east of the Ozarks. On the west edge of the Plains, higher elevations and the coolness of the Rockies plainly limits the temperature of the poorly watered lower lands adjacent.
The 92° isotherm is found to reach an extreme latitude almost corresponding to the southern boundary of Nebraska, near its center. The 90° and 88° isotherms crowd in closely at this longitude. There is, apparently, an influence here causing cooling somewhat more sharply than the latitudinal ascent. The fact is of sufficient importance in relation to the subject of Plains tree planting to merit closer examination. The sand hills are recognized as being a natural reservoir for moisture, which the Plains in their natural condition are not but which they might become, to some extent, by careful conservation of moisture and protection through tree planting. The sand hills, through the deep-rooted vegetation, steadily return a certain amount of water to the atmosphere when the surrounding Plains are essentially dry and their vegetation practically dead.
Coolness of the midsummer nights in the sand hills is well known and is supposed to result in part from the fact that partial reflection of the sun's heat and rapid radiation of that which is absorbed, limited largely to the surface soil layer, leaves less heat to be radiated at night. With this prima facie evidence of quicker radiation, it might be expected that midday temperatures would be higher than elsewhere in corresponding latitudes and the maxima perhaps reached earlier in the day.
The average gradient (negative) of the July maximum temperatures is approximately 1° F. for each degree of latitude, from 35° north to 49° north. Near the 100th meridian, however, a decrease of 4° occurs (between the 92° and 88° isotherms) in 2° of latitude. From this point north there is no essential drop in temperature for the next 3° of latitude, and in fact the highest temperatures of the entire area occur in the northern part, as indicated by individual station readings. Here is a latitudinal inversion of temperatures which must be the result of radically different surface conditions.
Through the center of the Nebraska area, which is apparently cooled by the sand-hill influence, there is an alley defined by the 88° isotherm in which temperatures somewhat above 88° F. prevail. This is the highest, roughest portion of the sand hills, an important receiving area in the vast reservoir, but one in which, because of the depth of the water table (frequently as much as 100 feet below the tops of the dunes), there can be relatively little dissemination of the stored moisture. The alley is thus kept open to the northeast, forming a junction with the hotter territory of South Dakota in that part of Nebraska in which heavy clay soils occur and which includes also a considerable portion of the Elkhorn Valley, above Norfolk, in which there is seepage from the sand-hill section. It is apparently through this alley, if at all, that South Dakota may be said to "receive heat from Nebraska", borne in upon southwest winds. In fact, one can almost visualize the alley as a continuation of the belt of high drought frequency extending from southwestern Kansas (figs. 26 and 27).
The remainder of the sand-hill section is vastly different, not only because it is not in the path of particularly dry southwestern winds but also because it has better moisture conditions. The northwest portion, although high in elevation, contains numerous lakes and considerable areas with high water tables. The area to the east and southeast is one in which most of the accumulated water of the sand-hill section appears in streams, moistening extensive fertile valleys of the Loup River system.
The high-temperature area of South Dakota, west of the Missouri River, is plainly the concomitant of the true Badlands topography on the upper reaches of the White and Cheyenne Rivers and the only slightly less bare soils which prevail on the bluffs throughout the length of these wide and deep valleys. Since the soil throughout is prevailingly one of heavy clay, even the rolling lands between the valleys express an arid condition during a considerable part of the year.
The relatively high temperatures occurring in the North Platte Valley of western Nebraska and eastern Wyoming are again expressive of the effects of bare soils occurring in a rapidly eroding area commonly designated as "Badlands." It is interesting to observe that the irrigation of this valley floor is entirely insufficient to overcome the intense heat of the bare areas which surround it.
The Nebraska sand-hill planting, centered at Halsey, is in the path of the dry southwest winds which plow their way through to South Dakota. Unfortunately, because of the height of the dunes in this section, the trees have a minimum moisture supply and can exert only a minimum effect on local temperatures. If areas at both the northern and southern edges of the sand hills, where ground water is much closer to the surface, could be similarly developed, possibly a slightly greater effect could be produced. The plan which has been put forward in connection with the shelterbelt project, to develop numerous relatively small areas in the sand hills, has everything to recommend it, provided these tracts are located where they will be served by abundant moisture supplies, as in the case of the canyons of the southeast sector.
Shelterbelt planting in this same important path can have an effect insofar as it makes use of water which would otherwise be lost to the region through run-off. Thus, northern and northwestern Kansas, although particularly difficult for upland tree planting because of the extreme heat conditions and drought frequency which have here been described, is a considerably dissected region and offers innumerable opportunities for planting along gulches and, with very minor engineering works, for storage of water in the soil. Such country as that in which the recent Republican River flood occurred could be vastly improved by water-conservation and planting work.
1934 DROUGHT TEMPERATURES
Under ordinary drought conditions plants fail to grow, and may die, solely on account of the gradual exhaustion of moisture within reach of their roots. When at midsummer, however, rain is long withheld and the ground surface becomes so dry that there can be no general evaporation, the solar energy received is almost wholly expended in raising the temperature of the soil and thence of the air in contact with it. This heating may rise to such a pitch that plants are directly killed by the high temperature even when their roots are able to obtain some moisture. In 1 or 2 days of excessive heat crops may be killed, and even the leaves of trees may shrivel.
The exceedingly high temperatures of the Plains region which often occur in dry summers are hardly to be thought of as "coming from the south" to any appreciable extent. There was an almost unbroken hot spell from June 20 to August 18, 1934. In July maximum temperatures in excess of 100° F. were felt daily as far north as central Nebraska, and at various points in Kansas, Oklahoma, and the Ozark section the average daily maxima for the month were 105° or more. These special conditions are shown by the hatched areas on the map (fig. 35). A strong tendency for the greatest heat to be observed farther east than normal was probably the result of unusual moisture deficiency in Missouri and even in some areas east of the Mississippi River.
As usual, the area of these excessive temperatures is found to be entirely separate from the hot area on the Rio Grande, which was scarcely as warm as the normal. The 90° isotherm along the Gulf coast was practically normal in position, but 95° temperatures crowded closer to the coast than usual, despite higher-than-average wind velocity from the Gulf. In some cases the velocity of the south wind was nearly doubled. The wind direction at several Texas stations had less of an easterly origin than usual, although exceptions occurred. Perhaps the most important change from normal was a greater dryness of the air as it entered the southern Plains region.
The greatest excesses over normal July maxima, 13°, were felt in northern Kansas, where temperatures of 105° F. were registered. Near the Canadian line the excesses were of about 5°.
Aside from the general extension northward of the excessive temperatures, which are rarely encountered except in desert regions, the outstanding feature of the 1934 record was the occurrence in the center of the Nebraska sand-hill area of temperatures in excess of anything recorded elsewhere in Nebraska. This confirms the theory derived from the normal July maxima, namely, that the high dunes of this sector have little or no opportunity to evaporate their deeply stored ground water through the draft of vegetation. Consequently real drought conditions can occur here much more markedly than in the surrounding seepage zones.
It is evident from the examination of 1934 conditions that daily maximum temperatures are controlled very closely by the degree of dryness attained locally, and not by the bringing in of heat as such, from the south or elsewhere.
On the other hand, there is a relationship between drought on the Plains and the normal heat and dryness of the Rio Grande area and perhaps other desert-like areas to the southwest which, although somewhat indirect, cannot be entirely overlooked. When, because of general air-pressure conditions which are abnormal for the season, summer winds do not swing northward and westward from the Gulf but rather blow from relatively arid regions of the south or southwest, their temperature and extreme dryness at the outset have something to do with extending the area of arid conditions. High temperatures arise in their path when they have sapped the lands to the north and northeast of such upper soil moisture as they possessed.
In physical terms, the principals of drought alleviation herein set forth and explained may be summarized thus: (1) The significance of hot winds in summer lies much more in their capacity to increase evaporation than to increase directly the temperature of the locality; (2) and in consequence of the above, it is certain that the storage of moisture, either in the soil or in reservoirs, through the agency of tree planting and of auxiliary works which insure the collection and storage of run-off water, will help to mitigate other distressing phenomena of droughts.
| <<< Previous | <<< Contents>>> | Next >>> |
|
shelterbelt/sec11.htm Last Updated: 08-Jul-2011 |