|
NATIONAL PARK SERVICE
Visual Preferences of Travelers Along the Blue Ridge Parkway |

|
CHAPTER TWO:
VISUAL AND MANAGEMENT PREFERENCES OF SIGHTSEERS
William E. Hammitt
University of Tennessee
Knoxville, Tennessee
Driving for pleasure, sightseeing, and hiking are popular recreational pursuits that depend greatly on perceptions of the visual environment. Many of the benefits that recreationists receive from engaging in these and similar outdoor activities are directly related to how the visual environment is viewed, managed, and presented to the visitors (Hammitt, 1980; Mercer, 1975; Moeller et al., 1974).
In this chapter we analyze the perceptions of Blue Ridge Parkway visitors at vista scenes. The major purpose is to identify landscape themes or prototypes that visitors prefer to view. From this analysis a visual preference typology is developed for vistas of the parkway. A second purpose of the chapter is to discuss parkway visitor feelings toward vegetation management alternatives at parkway vistas and roadsides. The levels and types of vegetation management and their alternatives are examined.
Conceptual Approach
While viewing a scene, people are both looking at and assessing, though subconsciously, its visual content (Appleton, 1975; Arnheim, 1969; S. Kaplan, 1973). Not only do people analyze the content of natural landscapes, but they also have preferences concerning the visual content and information contained within the scenes. That is, visual preference for certain environments or landscapes depends largely on the visual resources perceived in that environment and the associated information being processed (Hammitt, 1983).
Developing the concept further, it is believed that the visitors' visual preferences for landscape scenes can be analyzed for the preferred visual content of the landscapes. Recent contributions in the area of measuring environmental perception and visual preference (Arthur and Boster, 1976) allow for the examination of visual resources and their management. Landscape elements (Shafer et al., 1969; Zube, 1976; Daniel and Boster, 1976; Arthur, 1977; Buhyoff and Wellman, 1980) and themes and content constructs (Wohlwill, 1968; R. Kaplan, 1973, 1975; S. Kaplan, 1979; Wohlwill and Harris, 1980; Hammitt, 1980) can be determined. This chapter focuses on identifying landscape themes that are visually preferred.
Also basic to the conceptual framework of this analysis is the belief that people are primarily "visual" processors of environmental information. The perception of natural environments is a complex process, involving all of our senses, our past experiences, and images in memory. However, it is vision that people depend on most for relating to the environment, particularly sightseeing environments like the Blue Ridge Parkway. Sight is of crucial importance and probably influences human response to environments more directly and with greater salience than the other senses (Welsh, 1966; Arnheim, 1969; Campbell, 1974). Even when the other senses are involved in processing environmental information, they are usually associated with a visual image, either called up from memory or existing in the physical environment.
Based on the theories that humans are primarily visual processors of environmental information, that the visual content of landscape themes is a primary determinant of visual preference for vistas, and that the visual content of vista landscapes can be altered through vegetation management practices, a visual preference survey was selected as an appropriate approach for studying the perceptions of Blue Ridge Parkway tourists. In addition, since the perceptions of major interest concerned pull-off vista scenes, photographs were determined to be a logical means for abstracting what tourists prefer during their visits to the parkway. Ratings of photographs have been determined through other studies to be equivalent to on-site perceptions, and an acceptable medium for evaluating visual preferences for landscapes (Boster and Daniel, 1972; Shafer and Richards, 1974).
Preference Analysis Procedures
Vista Preferences
Visual preference ratings (1 through 5) of individual photographs were averaged to compute a mean preference rating for each landscape scene. The mean rating values were used to rank the scenes from most to least preferred. Then, to identify underlying landscape themes, the photos' ratings were factor analyzed. The factor analysis procedure was simply a computerized means of reducing the large data set of photos to small groups of scenes that demonstrated a shared commonality in content. Principal Factoring with Interaction and Orthogonal Varimax Rotation from SPSS (Nie et al., 1975) was used for the factoring. Standard criteria used in selecting factors (groupings of similar vista scenes) were: factor loadings had to be >0.40 for a photo to be included in a factor; only factors with eigenvalues >1.0 were extracted; and the reliability coefficient (Cronbach's alpha) of factors had to be near 0.60 or greater for them to be retained (Nunnally, 1967). Once factors were determined, a factor mean was determined for each grouping of scenes. The factor means were used as a basis for interpreting the visual preferences of parkway visitors for the major vista landscapes and for determining a visual preference typology of parkway vistas.
Vegetation Management Preferences
Visual preference ratings (1 through 5) were obtained for similar pairs of photographs of vista and roadside scenes that illustrated different levels and types of vegetation management. Mean ratings of pairs of scenes in the comparison sets were tested, using T-tests, for differences in preference for the vegetation management alternatives. Visitor support for the various vegetation maintenance alternatives was also investigated. A six-point Likert type rating scale was used for recording level of support for the maintenance alternatives.
Preference for Vista Overlooks
Most and Least Preferred Scenes
Although it is impossible here to consider the preference ratings of all 96 photos surveyed, it is possible to report the ratings of the most and least preferred scenes for each of the three geographic sections of the parkway.
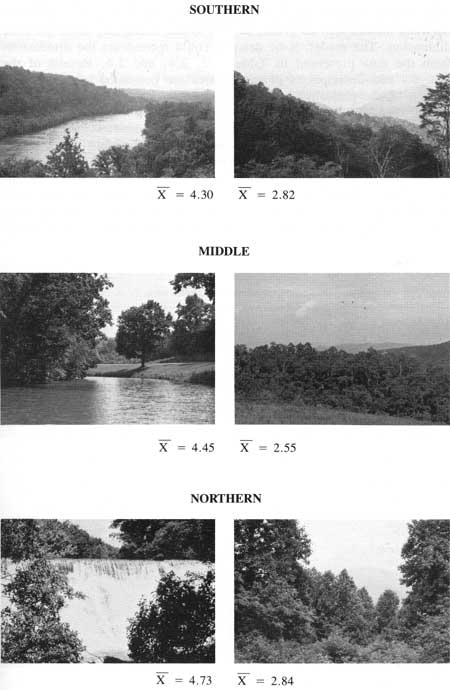
Mean preference ratings for the vista overlooks indicate visitors do have a range of preference for the various vistas along the parkway. The range of lowest and highest ratings, the range differential, and the overall mean rating for each section are reported in Table 2.1. The values indicate a general range in preference from a low of about 2.70 to a high of about 4.50. Thus, the preference values are skewed toward the upper end of the scale, indicating visitors liked the least preferred vistas "somewhat" and the most preferred vistas "quite a bit" to "very much." However, we found less difference in preference ratings for the three parkway sections than expected. It was anticipated that the higher peaks and the more remote mountainous scenery of the southern section would be more preferred than vistas of the middle and northern sections. This was not the situation, as vistas in the southern section received ratings equal to or even lower than the other two sections.
|
| Figure 2.1. The most and least preferred vista scenes in the souther, middle, and northern sections of the Blue Ridge Parkway. The mean preference rating of each photo is included directly below it, where 1 = liked not at all and 5 = liked very much. |
Table 2.1. Mean range of visual preference ratings for vista scenes in the southern, middle, and northern sections of the Blue Ridge Parkway.1
| Section | Range |
Range Differential |
Mean Difference | ||
| Lowest | — | Highest | |||
| Southern | 2.82 | — | 4.30 | 1.48 | 3.55 |
| Middle | 2.55 | — | 4.47 | 1.92 | 3.54 |
| Northern | 2.84 | — | 4.73 | 1.89 | 3.56 |
1Range and other values based on a 1 through 5 preference rating scale, where: 1 = liked not at all, 2 = a little, 3 = somewhat, 4 = quite a bit, 5 = liked very much. | |||||
A comparative examination of the most and least preferred scenes reveals an obvious difference in vista landscape preference (Figure 2.1). Vista scenes most preferred along the parkway are those that include a water landscape. Fast-moving water scenes in the northern section received the highest ratings, while slow-moving river or pond scenes in the middle section were the most liked vista landscapes. Only one water landscape, a river scene, was included in the southern section photo set, but it was rated as the most preferred vista in that section. Vistas of water landscapes were consistently preferred by visitors, with the five water landscape photos in the northern section being rated as the top five preferred vistas. At the other extreme, the least preferred vistas were those in which the foreground and middleground woody vegetation has grown up to partially block the view of visitors. Again, this pattern was consistent across all three of the parkway sections.
Identifying Landscape Dimensions
To reduce the data set of 96 scenes to a manageable unit, the scenes were factor-analyzed into common landscape themes by parkway section. Based on the preference ratings for the vista scenes, the factor analysis procedure groups similarly rated photos and assists in the identification of landscape patterns or themes. It is much more practical to search for underlying patterns among the vista landscapes, for only in limited situations can one design or manage a landscape on an individual scene basis.
The factor analysis resulted in four landscape dimensions in each of the parkway sections. Each dimension was assigned a name, based on the general theme that characterized it. Because it is impractical to include all the photos comprising each dimension, a brief description of the vista themes will be given, as well as one exemplary scene for each dimension. The reader, if he desires, could reconstruct the dimensions from the data presented in Tables 2.2, 2.4, and 2.6. Results of the analysis and descriptions of the themes are presented by geographic section of the parkway.
Southern Section
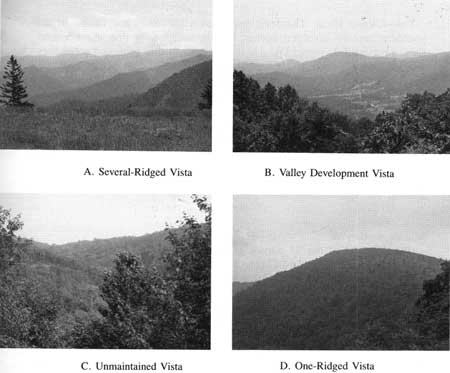
For the southern section, 21 of the 32 photos factored into the four dimensions identified (Table 2.2). Three of the dimensions had coherent scenes that were tightly grouped, with reliability values of 0.87 or higher. The fourth dimension, which contained scenes of developments in mountain valleys, was far less reliable (0.59). The four dimensions or vista themes were labeled, in order of visitor preference, as Several-Ridged Vista; Valley Development Vista; Unmaintained Vista; and One-Ridged Vista. Figure 2.2 contains a representative scene from each dimension.
Several-Ridged Vista. The seven photographs in this dimension are characterized by an open view of a series of mountainous ridges, usually three or more in depth. The vista landscapes contain a panoramic view with considerable depth of field. The series of mountainous peaks and valleys provide a number of mini-landscapes for the visitor to visually explore. All the scenes were heavily forested, with no evidence of human development. Other than the one water scene (Figure 2.1), which visitors rated high, the several-ridged mountain scenes were consistently among the most preferred vistas in the southern section (see photo means in Table 2.2).
Table 2.2. Factor Analysis Results for southern section vistas (N = 197).
| Vista Dimension And Photo No. |
Factor Loading |
Photo Mean |
Factor Mean |
Factor Alpha Value |
| SEVERAL-RIDGED | ||||
| 3 | 0.7161 | 4.02 | ||
| 23 | 0.7123 | 4.11 | ||
| 31 | 0.6994 | 4.21 | ||
| 2 | 0.6906 | 4.16 | 3.96 | 0.88 |
| 32 | 0.6005 | 3.71 | ||
| 12 | 0.5899 | 3.84 | ||
| 28 | 0.5604 | 3.68 | ||
| VALLEY DEVELOPMENT | ||||
| 14 | 0.6562 | 3.50 | ||
| 4 | 0.5291 | 4.05 | 3.57 | 0.59 |
| 22 | 0.4737 | 3.15 | ||
| UNMAINTAINED | ||||
| 13 | 0.7264 | 3.54 | ||
| 29 | 0.7251 | 3.19 | ||
| 16 | 0.6769 | 2.84 | ||
| 21 | 0.6580 | 3.18 | 3.36 | 0.89 |
| 18 | 0.6228 | 3.81 | ||
| 9 | 0.5915 | 3.45 | ||
| 24 | 0.5264 | 3.52 | ||
| ONE-RIDGED | ||||
| 8 | 0.7690 | 2.83 | ||
| 19 | 0.6817 | 3.26 | ||
| 11 | 0.6488 | 3.23 | 3.19 | 0.88 |
| 15 | 0.5750 | 3.45 | ||
|
| Figure 2.2. Example of one characteristic scene from each of the four dimensions of southern section vistas, Blue Ridge Parkway. |
Valley Development Vista. Characteristic of this dimension were scenes of mountainous valleys that contained farm or rural community development (Figure 2.2, photo B). Two of the scenes were of distant developments, while the third was of a farm homestead in the middleground of the scene. Visitors varied in their preference for the developed scenes, as this dimension was not very reliable.
Unmaintained Vista. Scenes in this dimension are characterized by a view of one to two background mountain ridges in which the vista is partially blocked by foreground trees and shrubs. In most of the seven scenes, the foreground trees have grown up to block the view as the vista vegetation has matured, or the shrubs had not been cleared immediately adjacent to the pull-off vista. It appears visitors do not mind some vegetation in the foreground as long as the background view is not blocked. However, there is a definite trend toward lower preference as the foreground trees increase.
One-Ridged Vista. The least preferred vista landscape theme in the southern section involved scenes that included only one mountainous ridge (Figure 2.2, photo D). All four scenes in this grouping were very similar—open views of a rounded mountain ridge that occupied three-fourths of the vista. When compared to the scenes in the Several-Ridged Vista dimension, the One-Ridged Vista scenes offer far less opportunity for visual involvement.
Mean values for the four dimensions ranged from a high of 3.96 for the Several-Ridged Vista to a low of 3.19 for the One-Ridged Vista. When compared, the means proved to be significantly different (Table 2.3). In terms of practical significance, the dimensions also appear thematically different and help identify distinct aspects of the southern section for vista-management purposes.
Middle Section
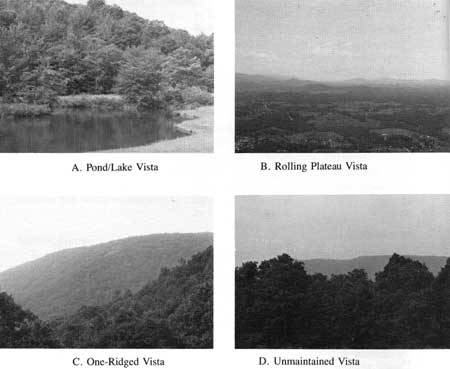
Twenty-eight of the 32 photos of the middle section factored into the four dimensions identified (Table 2.4). However, two of the dimensions accounted for 22 of the scenes and 809 of the variance. All four of the dimensions had acceptable reliability coefficients, ranging from 0.90 to 0.69. The four landscape dimensions were named: Pond/Lake Vista, Rolling Plateau Vista, One-Ridged Vista, and Unmaintained Vista.
Pond/Lake Vista. This dimension contains four vistas that include a pond or lake waterscape surrounded by trees as the dominant view (Figure 2.3, photo A). Three of the scenes appear as pond or small lake waterscapes in the middleground, and all have mean preference ratings above 4.0. The one distant view of a reservoir scene received a lower rating of 3.57. Also, based on the factor analysis values, the three pond scenes are much more characteristic of this dimension.
Table 2.3. Comparison of preference means for the four vista dimensions in the southern section.
| Vista Dimension | Mean | t-value1 | Significance |
| Several-Ridged | 3.96 | 5.80 | |
| Valley Development | 3.57 | 0.001 | |
| Unmaintained | 3.36 | -3.86 | 0.001 |
| One-Ridged | 3.19 | 2.83 | 0.005 |
1Based on proximate pairs of dimensions. | |||
Table 2.4. Factor analysis results for middle section vistas (N = 212).
| Vista Dimension And Photo No. | Factor Loading |
Photo Mean | Factor Mean | Factor Alpha Value |
| POND/LAKE | ||||
| 6 | 0.6653 | 4.16 | ||
| 11 | 0.6608 | 4.45 | ||
| 32 | 0.6505 | 4.30 | 4.12 | 0.75 |
| 14 | 0.4732 | 3.57 | ||
| ROLLING PLATEAU | ||||
| 27 | 0.8042 | 3.89 | ||
| 22 | 0.7427 | 4.16 | ||
| 17 | 0.7424 | 3.99 | ||
| 25 | 0.7380 | 3.94 | ||
| 23 | 0.7377 | 3.35 | ||
| 4 | 0.6822 | 3.95 | ||
| 1 | 0.6144 | 3.66 | 3.75 | 0.90 |
| 26 | 0.6227 | 3.90 | ||
| 9 | 0.5940 | 4.12 | ||
| 20 | 0.5357 | 3.12 | ||
| 15 | 0.5185 | 3.62 | ||
| 12 | 0.5181 | 3.46 | ||
| ONE-RIDGED | ||||
| 31 | 0.6055 | 3.57 | 3.68 | 0.69 |
| 28 | 0.5727 | 3.80 | ||
| UNMAINTAINED | ||||
| 8 | 0.7563 | 2.57 | ||
| 13 | 0.6829 | 2.78 | ||
| 3 | 0.6768 | 2.75 | ||
| 2 | 0.6210 | 3.19 | ||
| 19 | 0.5988 | 2.97 | ||
| 7 | 0.5978 | 3.54 | 2.99 | 0.88 |
| 16 | 0.5521 | 2.76 | ||
| 18 | 0.5391 | 3.21 | ||
| 29 | 0.5357 | 3.19 | ||
| 21 | 0.4710 | 2.96 | ||
Rolling Plateau Vista. The 12 scenes making up this dimension are characterized by rolling, broad plateau valleys that include a mosaic of farm, pastureland, and hardwood forest (Figure 2.3, photo B). The amount of pasture and farmland in the scenes varied from approximately 60% to less than 10%. Those photos containing 50% or more pasture areas were rated high in preference, with mean ratings of 3.8 to 4.1. These landscapes offer more opportunity for visual involvement and readability, as fields and forests add greater coherence, legibility, textural diversity, and complexity to the scenes.
|
| Figure 2.3. Example of one characteristic scene from each of the four dimensions of middle section vistas, Blue Ridge Parkway. |
One-Ridged Vista. Scenes in this dimension are almost identical to those in the One-Ridged dimension of the southern section, being dominated by a single, rounded ridge with little variation in relief.
Unmaintained Vista. The least preferred of any vista dimensions (X — 2.99) in all three sections was the unmaintained vista, where tree vegetation has matured to the point that the view was partially blocked (Figure 2.3, photo D). In most of the scenes, one-half to three-fourths of the vista landscape was blocked from view. Foreground and middleground trees are a more serious problem in the middle section than the southern section, for the lower elevation and relief of the middle section allows the trees to block more of the vista. At several of the vistas, considerable clearing of vegetation in the foreground and middleground will be necessary to return the overlook vistas to their original condition or to a condition preferred by parkway visitors.
The mean preference values for the four dimensions in the middle section (Table 2.5) indicate a greater range in preference values than that for the southern section. The Pond/Lake scenes received a high of 4.12, while the Unmaintained dimension was rated 2.99. However, the Rolling Plateau (X = 3.75) and the One-Ridged (X = 3.68) Vistas were not rated significantly different. Both were liked fairly well.
Table 2.5. Comparison of preference means for the four vista dimensions in the middle section.
| Vista Dimension | Mean | t-value1 | Significance |
| Pond/Lake | 4.12 | ||
| Rolling Plateau | 3.75 | -6.14 | 0.001 |
| One Ridged | 3.68 | 0 76 | 0.448 |
| Unmaintained | 2.99 | -11.31 | 0.001 |
1Based on proximate pairs of dimensions. | |||
Northern Section
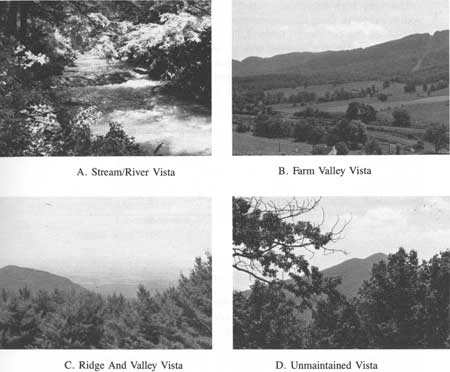
All but four of the 3 northern section photos factored into the four vista dimensions identified (Table 2.6). One factor, dominated by scenes of the open ridged and valley landscape, contained 15 of the photos and accounted for 65% of the variance. The reliability coefficients of the four dimensions ranged from 0.94 to 0.68. Labels assigned to the dimension were: Stream/River Vista, Farm Valley Vista, Ridge and Valley Vista, and Unmaintained Vista.
Table 2.6. Factor analysis results for northern section vistas (N = 171).
| Vista Dimension and Photo No. |
Factor Loading | Photo Mean |
Factor Mean | Factor Alpha Value |
| STREAM/RIVER | ||||
| 18 | 0.6772 | 4.56 | ||
| 4 | 0.6583 | 4.68 | ||
| 10 | 0.5301 | 4.73 | 4.61 | 0.68 |
| 2 | 0.4402 | 4.47 | ||
| FARM VALLEY | ||||
| 26 | 0.7243 | 3.64 | ||
| 5 | 0.5348 | 3.70 | 3.60 | 0.75 |
| 29 | 0.4990 | 3.44 | ||
| RIDGE AND VALLEY | ||||
| 3 | 0.8000 | 3.75 | ||
| 21 | 0.7943 | 3.10 | ||
| 14 | 0.7773 | 3.77 | ||
| 19 | 0.7534 | 3.36 | ||
| 9 | 0.7435 | 3.54 | ||
| 15 | 0.7307 | 3.39 | ||
| 11 | 0.7208 | 3.26 | ||
| 13 | 0.7027 | 3.32 | 3.46 | 0.94 |
| 16 | 0.6939 | 3.39 | ||
| 6 | 0.6854 | 3.30 | ||
| 1 | 0.6596 | 3.44 | ||
| 8 | 0.6585 | 3.09 | ||
| 12 | 0.6051 | 3.75 | ||
| 22 | 0.5562 | 3.69 | ||
| 30 | 0.4982 | 3.81 | ||
| UNMAINTAINED | ||||
| 23 | 0.7848 | 3.01 | ||
| 20 | 0.7372 | 2.84 | ||
| 25 | 0.7124 | 3.26 | ||
| 28 | 0.7051 | 3.21 | 3.21 | 0.87 |
| 32 | 0.5966 | 3.53 | ||
| 7 | 0.5716 | 3.39 | ||
Stream/River Vista. The four scenes comprising this vista type show rapidly moving water in forested settings (Figure 2.4, photo A). Two photos are of fast-moving streams or rivers having white water, one photo is a waterfall, and the other photo is a river in which the current is visible. These four scenes of rapidly moving water were the most highly preferred vistas among the 96 photos rated in the three parkway sections. The four individual photo preference means ranged from 4.73 to 4.47. The water scenes of this section seem to differ most from those of the middle section by having rapidly moving white water rather than still water, pond-like settings, and more forested surroundings.
|
| Figure 2.4. Example of one characteristic scene from each of the four dimensions of the northernsection vistas, Blue Ridge Parkway. |
Farm Valley Vista. Views of broad, open valleys in which farm fields dominate the scene are characteristic of this dimension (Figure 2.4, photo B). The scenes are somewhat similar to the pastoral scenes of the Rolling Plateau Vista in the middle section, except that the Farm Valley scenes are much more dominated by grassy fields and open valleys. Forests comprise less than 50% of each of the scenes. Visual preferences for the Farm Valley and the Rolling Plateau Vistas were similar, being 3.60 and 3.75, respectively.
Ridge and Valley Vista. Scenes of the Ridge and Valley Vista are characteristic of the ridge and valley physiography, consisting of low elevational, parallel ridges intersected with broad agricultural valleys (Figure 2.4, photo C). Two general groups of scenes are included in the dimension, one containing seven photos with valley development and another of eight photos where the broad valleys remain forested. Even in the valley-development scenes, the valleys appear in the middle to far background of the vistas and comprise usually less than 20% of the landscape in both groups of photos. The visual preference mean was 3.46.
Unmaintained Vista. As in the middle section, vistas that are becoming blocked by unmaintained vegetation are the least preferred by parkway visitors. The six photos in this dimension are essentially identical to those in the Unmaintained Vista of the middle section. However, the preference mean did not drop as low as it did in the middle section (3.21 vs. 2.99) primarily because of fewer scenes with immediate foreground vegetation blocking the view. Vistas with foreground tree and shrub vegetation that block the view are rated lower than vistas containing middleground vegetation.
The very high preference rating of the Stream/River Vista led to the widest range in vista dimension means being in the northern geographic section of the parkway (Table 2.7). The means ranged from a high of 4.61 for the rapidly moving water scenes to a low of 3.21 for the unmaintained scenes. All proximate pairs of the dimension means were significantly different at the 0.05 probability level.
Table 2.7. Comparison of preference means for the four vista dimensions in the northern section.
| Vista Dimension | Mean | t-value1 | Significance |
| Stream/River | 4.61 | ||
| Farm Valley | 3 60 | -16.03 | 0.001 |
| Ridge and Valley | 3.46 | -2.18 | 0.031 |
| Unmaintained | 3.21 | 4.18 | 0.001 |
1Based on proximate pairs of dimensions. | |||
A Vista Preference Typology
When one examines the visual content of the landscape themes composing the 12 vista dimensions, some similarities and overlap are noted among the dimensions. Water, ridge and valley scenes with pastoral development, one-ridged mountain, and unmaintained vistas are common to two or more of the sections. Furthermore, when the 12 vista dimensions are ranked from high to low on the basis of visual preference, the dimensions naturally fall into larger groupings that have surprisingly common themes (Table 2.8).
Table 2.8. A visual preference of vista landscapes as pull-off overlooks along the Blue Ridge Parkway.
| Means | Vista Dimensions | Typology | |
| HIGH PREFERENCE | |||
| 4.61 | Stream/River | WATER VISTAS | |
| 4.12 | Pond/Lake | ||
| 3.96 | Several-Ridged | MULTI-RIDGED VISTAS | |
| 3.75 | Rolling Plateau | PASTORAL VISTAS | |
| 3.68 | One-Ridged | ||
| 3.60 | Farm Valley | ||
| 3.57 | Valley Development | ||
| 3.46 | Ridge & Valley | ||
| 3.36 | Unmaintained | UNMAINTAINED VISTAS | |
| 3.21 | Unmaintained | ||
| 3.19 | One-Ridged | ||
| 2.99 | Unmaintained | ||
| LOW PREFERENCE | |||
Only the One-Ridged dimension does not follow the identified pattern. This pattern of commonality among the vista landscapes, based on preference ratings, provides a Vista Preference Typology for the Blue Ridge Parkway. Based on our data, visitors to the parkway prefer to see mountainous vistas of:
Most Preferred
Rapidly Moving Water
Stationary Water
Mountains with Several Ridges
Pastoral Development
Mountains with One Ridge
Unmaintained Vegetation
Least Preferred
This typology of vista preference can assist recreation planners and managers in the allocation of resources toward overlook development and maintenance. During the design stages of a scenic parkway project, the emphasis should be devoted to locating preferred vista landscapes. Water is a major attraction for many outdoor recreational activities, and sightseeing appears to be no exception. Perhaps of greater importance than the identification of preferred vistas is the finding that unmaintained vistas rank low in preference. The unmaintained vistas are a vegetation management problem, one that can be improved if open views are created at these overlooks. Various types and levels of vegetation management can be practiced at overlooks. The following section discusses the visitor preferences of some vegetation management alter natives on the Blue Ridge Parkway.
Vegetation Management Preferences
In addition to investigating vegetation management at overlook vistas, the visitors' preferences for different levels of roadside maintenance (i.e., grass mowing) were investigated. Comparative sets of photos that demonstrated a "control" scene and altered scenes with different levels of vegetation management were rated for preference. First, we will report visitor preferences concerning the clearing of woody vegetation at overlook vistas and then their preferences for grass mowing on parkway roadsides.
Vista Vegetation Comparisons
The mean preference ratings for the control and altered scenes of each comparative photo set are presented in Table 2.9. The photo pairs have been grouped according to patterns of visitor preference response, for interpretive purposes. Again, because of the impracticality of printing all photo sets, only characteristic examples are provided. However, a sample questionnaire of the 1983 survey is available in Appendix B, and the reader is referred to it for a more detailed interpretation.
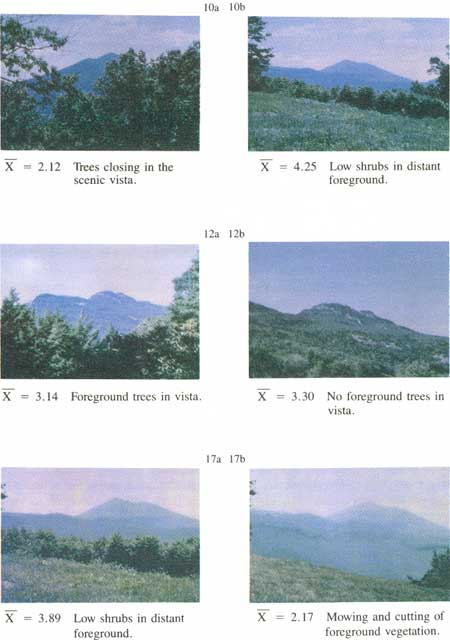
The ratings in Table 2.9 indicate that the clearing of dense vegetation from the foreground of vistas generated the greatest difference (increase) in preference ratings. Photographs 10a and 10b contain vistas where 60 to 80% of the view is blocked (Figure 2.5, photos 10a and 10b). Removal of an appropriate amount, but not all, of the trees to reopen the vistas greatly increased visitor preference. The low preference for the unmaintained vistas agrees with the results from the vista overlook preference study just reported. The importance of foreground vegetation as a determinant of vista preference also agrees with the findings of Wellman et al. in Chapter 5.
The second grouping of photos in Table 2.9 consisted of five vista scenes in which the view was only partially blocked, approximately 20 to 50% (Figure 2.5, photos 12a and 12b). None of these scenes received a statistically significant increase in preference when the vegetation was cleared or partially cleared. However, four of the five photo pairs showed slight increases in preference for the treated photos. Visitors appear to be willing to tolerate a portion of the vista being blocked by vegetation.
The last three photo pairs in Table 2.9 indicate a higher preference mean for the control photos. In all three pairs, the control photos consisted of a scene where low foreground shrubs or trees block less than 20% of the view (Figure 2.5, photos 17a and 17b). Also, the treatments were selective in what vegetation was removed, and only a portion of the vegetation in two of the three photos was removed. Removal of hardwoods to emphasize conifers, the use of controlled burning to manage shrubs, or the complete removal of foreground shrubs was not a preferred management practice in these scenes where existing vegetation blocked little of the vista.
Table 2.9. Mean preference ratings for control and vegetation treatment photo pairs of vista scenes for the Blue Ridge Parkway.
| PHOTO PAIR | PHOTO PAIR MEANS1 |
MEAN DIFFERENCE | SIGNIFICANCE | |
| Control | Treatment | |||
| 16a — 16b | 1.95 | 4.51 | 2.55 | 0.001 |
| 10a — 10b | 2.12 | 4.25 | 2.15 | 0.001 |
| 11a — 11b | 3.37 | 3.68 | 0.31 | 0.054 |
| 18a — 18b | 3.39 | 3.14 | 0.25 | 0.095 |
| 13a — 13b | 2.89 | 3.12 | 0.25 | 0.184 |
| 12a — 12b | 3.14 | 3.30 | 0.16 | 0.339 |
| 15a — 15b | 2.86 | 3.02 | 0.16 | 0.303 |
| 14a — 14b | 3.97 | 2.61 | 1.36 | 0.001 |
| 5a — 5b | 3.65 | 2.46 | 1.19 | 0.001 |
| 17a — 17b | 3.89 | 2.17 | 1.18 | 0.001 |
1Means are based on a visual preference rating scale, where 1 = liked not at all and 5 = liked very much. | ||||
Although the number of vista photo pairs tested is limited, the data tend to indicate that vegetation management at unmaintained vistas where trees block a major portion of the view can greatly increase the visual preference for these scenes. However, visitors are willing to tolerate a certain degree of vegetation in a vista, as long as the view is less than 30 to 40% blocked. In fact, visitors tend to prefer some low foreground vegetation in a vista and may have little preference for selective management of hardwood vs. conifer species. However, further research is needed to verify these tentative findings.
Roadside Vegetation Comparisons
The preference ratings for the roadside mowing scenes are arranged into two groupings in Table 2.10: those scenes where the control photos were most preferred and those where the treatments were most preferred. As we will learn from inspecting the photos, they also fall into either group based on visual content or theme.
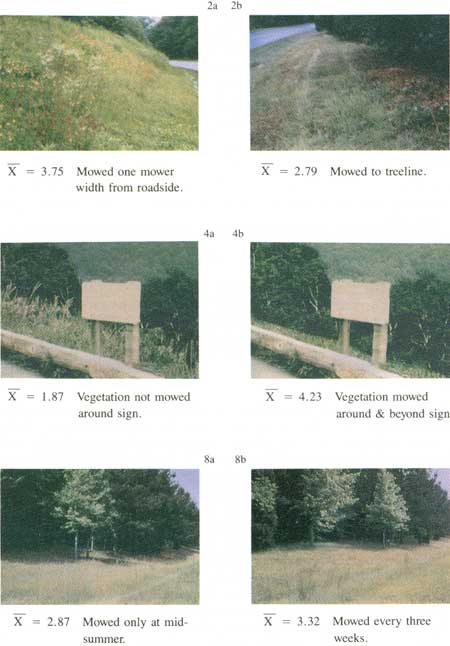
The first five photo pairs in Table 2.10 show a significantly higher preference for roadside scenes where the vegetation is mowed only one mower width (approximately 7 feet) from the pavement (Figure 2.6, photo 2a). Mowing beyond the guardrail or completely to the treeline was less preferred in all these photos (see photo pairs, 1983 survey in Appendix B). A confounding variable in the control scenes is the presence of summer wildflowers, which no doubt increased preference for the control scenes. However, to encourage summer wildflowers along the roadside is to prohibit widescale mowing on a regularly scheduled basis.
|
| Figure 2.5. Example of characteristic photograph pairs from Table 2.9, illustrating different levels of vegetation treatment at Blue Ridge Parkway pull-off vistas. Photos "a" are the controls, "b" the treatments. |
Table 2.10. Mean preference ratings for control and vegetation treatment photo pairs of roadside scenes, Blue Ridge Parkway.
| PHOTO PAIR | PHOTO PAIR MEANS1 |
MEAN DIFFERENCE | SIGNIFICANCE | ||
| Control | Treatment | ||||
| 1a — 1b | 4.02 | <--- | 2.30 | 1.72 | 0.001 |
| 7b—7a2 | 3.87 | <--- | 2.68 | 1.19 | 0.001 |
| 2a — 2b | 3.75 | <--- | 2.79 | 0.95 | 0.001 |
| 9a — 9b | 3.45 | <--- | 2.81 | 0.64 | 0.001 |
| 6a — 6b | 3.57 | <--- | 3.09 | 0.47 | 0.007 |
| 4a — 4b | 1.87 | ---> | 4.23 | 2.36 | 0.001 |
| 8a — 8b | 2.87 | ---> | 3.32 | 0.45 | 0.003 |
| 3a — 3b | 2.73 | ---> | 3.02 | 0.29 | 0.094 |
1Means are based on a visual preference rating scale, where 1 = liked
not at all and 5 = liked very much.
2The positions of the control and treatment photos were reversed in the questionnaire. | |||||
The last three photo sets in Table 2.10 consist of scenes that appear more manipulated, or less natural, than the first five scenes. Only grasses were present in the photos. The roadside interpretive sign and the grassy, lawn-type situation (Figure 2.6, photos 4 and 8) were more preferred if managed more intensively. However, even mowing completely to the treeline in these situations may not be a preferred practice (photo 3, Appendix B). As with the vistas, visitors may have a threshold beyond which too much or too little vegetation management is an unpreferred state, and the threshold may be specifically related to the form of vegetation present. Wohlwill and Harris (1980) found evidence for a similar situation concerning the "fittingness" of man-made features in natural recreation settings. A man-made feature (i.e., interpretive sign) may be more in harmony with the environmental setting if the surrounding vegetation is managed more intensely than normal.
It is acknowledged that other studies (Anderson, 1981; Hodgson and Thayer, 1980) have shown that "labels" associated with photos (i.e., reservoir vs. natural lake) can influence preference ratings for visual scenes. The captions under our photo pairs may have had a similar influence. However, our captions were different from the labels of previous studies in that they denoted levels of management rather than the bipolar nature of natural vs. manipulated. The intention of our captions was to cue visitors to the level of vegetation management practiced in each pair of photos. In several photo pairs, sensitive words, such as mowed, were used for both the control and treatment photos.
|
| Figure 2.6. Example of characteristic photograph pairs from Table 2.10, illustrating different levels of vegetation treatment at Blue Ridge Parkway roadsides. Photos "a" are the controls, "b" the treatments. |
Vegetation Maintenance Alternatives
In addition to the photo preference ratings for the vegetation management practices, visitors were asked to indicate their level of support for various levels of vegetation maintenance at vistas and roadsides. Three statements described levels of vista maintenance, while nine items were devoted to roadside vegetation maintenance. The items were developed to complement the management alternatives included in the photo comparisons and captions just discussed (Table 2.11); however, the statements were not associated with photographs.
A six-point Likert rating scale, where 1 = strongly support and 6 = definitely don't support, was used to record the visitors' level of support. For presentation here the six-point support scale was condensed to a three-level scale. "Strongly support" and "support" were combined, forming "support." "Probably support" and "probably don't support" formed an "indefinite" category. "Don't support and "definitely don't support" were combined into a "non-support" category. The percentage of visitor support by these three categories is reported in Table 2.11.
Little difference occurs in terms of "support" among the three main tenance options for vistas. Approximately 40% of the visitors support the options of: annual clearing of vegetation, clearing every five to seven years, or clearing just often enough to maintain two-thirds of the view open (Table 2.11). Closer observation of the six original response levels indicates that 25% did "strongly support" annual cutting to maintain a completely open view. There was some difference in the "non-support" category, with fewer (14%) of the visitors not supporting the option of clearing foreground vegetation on a five to seven year basis. Overall, there seems to be no definite preference for any particular vista option. This may be because none of the practices involves the clearing of a vista that is more than one-third blocked by vegetation. In the vista photo-pairs, more than one-third of the vista had to be blocked before visitors reacted in a significant way.
In terms of maintenance options for roadsides, the grass-mowing practices supported most were: only one mower width from roadside (46%) and mowing only when necessary to maintain driver safety and help prevent grass fires (37%). However, the latter option had an equal number of people who did not support the practice. Those practices least supported were mowing weekly (74%) and mowing from the road's edge to the treeline (44%). Nearly three-quarters of the respondents said they "definitely don't support" the weekly mowing of roadsides, and nearly one-half gave the same response for mowing to the treeline. Visitors were quite "indefinite" about mowing from the road's edge to the ditch or swale. This indecisiveness may be related to not knowing how far the ditch or swale may be from the roadside. Of the 39% that was "indefinite," nearly 25% said they probably supported the practice.
Table 2.11. Level of visitor support for vegetation maintenance alternatives at pull-off vistas and roadsides, Blue Ridge Parkway.
| MAINTENANCE OPTION |
LEVEL OF SUPPORT (%) |
Don't Know | ||
| Support | Indefinite | Non-support | ||
| Shrubs and trees at pull off vistas should be cut or trimmed: | ||||
| annually to maintain a completely clear view | 41 | 25 | 28 | 6 |
| every 5 to 7 years, be fore the shrubs in the foreground block much of the distant view | 42 | 35 | 14 | 9 |
| just often enough so that no more than 1/3 of the view is blocked | 40 | 31 | 23 | 6 |
| The roadside grass should be mowed: | ||||
| weekly, like a lawn | 7 | 15 | 74 | 4 |
| every two weeks, when 3 to 6 inches tall | 31 | 28 | 36 | 5 |
| once per month, when at least 10 inches tall | 32 | 34 | 27 | 7 |
| once in the Fall after the wildflowers are through blooming | 41 | 23 | 27 | 9 |
| only one mower width (7 ft) from the edge of the road surface | 46 | 28 | 21 | 5 |
| two mower widths (14 ft) from the road's edge | 19 | 38 | 33 | 10 |
| from the road's edge to the ditch or swale | 24 | 39 | 20 | 17 |
| from the road's edge to the treeline | 23 | 26 | 44 | 7 |
| as little as possible, only when necessary to maintain driver safety and help prevent grass fires | 37 | 23 | 36 | 4 |
Support for the roadside maintenance options is in close agreement with the preference ratings of the roadside vegetation treatments in the photographic pairs. Mowing one mower width from the roadside, until the fall when wildflowers finish blooming, is the preferred maintenance option of the majority of our respondents. Mowing on a frequent basis and mowing all the way to the treeline were not supported by the visitors.
Summary and Implications
Although the entire Blue Ridge Parkway is a heavily used scenic resource, it does contain certain elements that are more preferred than others by the visiting public. The Blue Ridge Parkway, like any visual landscape, is also a dynamic resource, changing over time with the growth and successional development of native vegetation. As a result, the scenic overlooks and roadsides of the parkway must be monitored and managed continually to maintain the scenic benefits so desired by the public. The purposes of our study were to do exactly these: to assess visitor preferences for parkway pull-off vistas and to evaluate options for managing the vegetation at vistas and roadsides along the parkway.
In surveying visitor preferences for the many vista landscapes along the parkway, it was speculated that visitors would prefer the natural and mountainous scenes in the southern portion of the parkway over those in the more rolling physiographic sections to the north. For this reason three sub-surveys were conducted, based on vistas from each of the three sections of the parkway: southern, middle, and northern. This expectation did not materialize, as the range of preference ratings for the middle and northern sections was just as high as that in the southern section.
The mean preference ratings indicate that vistas containing waterscapes were the most preferred. Unmaintained vistas, with foreground and middleground vegetation blocking 50% or more of the view, were least preferred. Mean preference for landscape vista themes, as determined by factor analysis, suggests a Vista Preference Typology for the parkway. The typology, based on those vista landscape themes most to least preferred, is as follows:
Most Preferred
Rapidly Moving Water (Streams Rivers)
Stationary Water (Ponds & Lakes)
Mountains with Several Ridges
Pastoral Development
Mountains with One Ridge
Unmaintained Vegetation
Least Preferred
This Vista Preference Typology can serve as a basis for the design and development of pull-off vistas, as well as for the allocation of resources toward the management and maintenance of vistas. Water has long been known to be a major attribute of many outdoor recreational activities, and sightseeing appears to be no exception. Perhaps of greater importance is the finding that the unmaintained vistas rank lowest in preference. The unmaintained vistas represent a vegetation management problem that can be improved if budgetary resources are made available to open up the views at these overlooks.
When asked to indicate their preference for various types and levels of vegetation management at vistas and along roadsides, visitors showed some definite preferences. Although our data is by no means conclusive, it does imply that:
1. People can differentiate between different types and levels of vegetation management. They have some definite preferences and non-preferences concerning vegetation maintenance practices along a scenic parkway.
2. Re-opening of vistas where vegetation blocks over 50% of the view can greatly enhance visual preference for these scenes. However, the public is willing to tolerate vegetation blocking a small portion of the view, and may even prefer a small amount of low foreground vegetation.
3. Roadside scenes that contain less grass mowing and more summer wildflowers are highly preferred. Roadside scenes that are more developed (i.e., interpretive signs) are more preferred if the grass is regularly mowed.
4. Roadside maintenance practices most preferred by visitors include the mowing of one mower width from the road's edge and only mowing in the fall after wildflowers have bloomed. Conversely, visitors least support the options of mowing on a frequent basis and all the way to the forest edge.
In conclusion, the vista and vegetation management preferences expressed by our sample of Blue Ridge Parkway visitors suggest that the public can be an important component in the management of scenic resources. These scenic resources are an important element in the leisure experience of parkway visitors, for the parkway is primarily a visual resource and its users are sightseers of landscapes. It is imperative that we include their input in the management of the parkway.
REFERENCES
Anderson, L.M. 1981. Land use designations effect perception of scenic beauty in forest landscapes. Forest Science 27(2):392-400.
Appleton, J. 1975. The Experience of Landscapes. New York: John Wiley and Sons.
Arnheim, R. 1969. Visual Thinking. Berkeley: University of California Press.
Arthur, L.M. 1977. Predicting scenic beauty of forest environments: Some empirical tests. Forest Science 23(2):151-160.
Arthur, L. M., and R. S. Boster. 1976. Measuring scenic beauty: A selected annotated bibliography. USDA Forest Service General Technical Report RM-25, 34 p. Rocky Mtn. Forest and Range Exp. Stn., Ft. Collins, CO.
Boster, R.S., and T. C. Daniel. 1972. Measuring public response to vegetative management. p. 38-43. In Proc. 16th Annual Arizona Watershed Symposium, Arizona Water Comm., Phoenix.
Buhyoff, G.J., and J. D. Wellman 1980. The specification of a nonlinear psychophysical function for visual landscape dimensions. Journal of Leisure Research 12(3):257-272.
Campbell, B.G. 1974. Human Evolution An Introduction to Man's Adaption. Chicago: Aldine Publishing Co.
Daniel, T.C., and R. S. Boster. 1976. Measuring landscape esthetics: The scenic beauty estimation method. USDA Forest Service Research Paper RM-167, 66 p. Rocky Mtn. Forest and Range Exp. Stn., Ft. Collins, CO.
Hammitt, W.E. 1980. Managing bog environments for recreational experiences. Environmental Management 4(5):425-431.
Hammitt, W.E. 1983. Assessing visual preference and familiarity for a bog environment. Chapter 6, In R. Smardon (Ed.). The Future of Wetlands: Assessing Visual-Cultural Values. Totowa, N.J.: Allanheld, Osmun Publishers.
Hodgson, R.W., and R. L. Thayer, Jr. 1980. Implied human influence reduces landscape beauty. Landscape Planning 7(2):171-179.
Kaplan, R. 1973. Some methods and strategies in the predictions of preference. In E.H. Zube, R.O. Brush, and J.G. Fabos (Eds.) Landscape Assessment Values, Perceptions, and Resources. Stroudsburg, PA.: Dowden, Hutchinson and Ross.
Kaplan, R. 1975. Predictors of environmental preference: Designers and clients. In W.F.E. Preiser (Ed.). Environmental Design Research. Stroudsburg, PA.: Dowden, Hutchinson and Ross.
Kaplan, S. 1973. Cognitive maps in perception and thought. In R.M. Downs and D. Steal (Eds.). Image and Environment. Chicago: Aldine Press.
Kaplan, S. 1979. Concerning the power of content-identifying methodologies. In T. Daniel, E. Zube, and B. Driver (tech. coord.). Assessing Amenity Resource Values. USDA Forest Service General Technical Report RM-68, 70 p. Rocky Mtn. Forest and Range Exp. Stn., Ft. Collins, CO.
Mercer, D. 1975. Perception in outdoor recreation. In Patrick Lavery (Ed.) Recreation Geography. New York: Halstead Press.
Moeller, G.H., R. MacLachlan, and D. A. Morrison. 1974. Measuring perception of elements in outdoor environments. USDA Forest Service Research Paper NE-289, 9 p. Northeastern Forest Exp. Stn., Upper Darby, PA.
Nie, N.H., C. H. Hull, J. C. Jenkins, K. Steinbrenner, and D. H. Bent. 1975 Statistical Package for the Social Sciences. New York: McGraw-Hill.
Nunnally, J.C. 1967. Psychometric Theory. New York: McGraw-Hill.
Shafer, E. L., Jr., and T. A. Richards. 1974. A comparison of viewer reactions to outdoor scenes and photographs of those scenes. USDA Forest Service Research Paper NE-302, 26 pp. Northeastern Forest Exp. Stn., Broomall, PA.
Shafer, E.L., Jr., J. F. Hamilton, and E. A. Schmidt. 1969. Natural landscape preferences: A predictive model. Journal of Leisure Research 1(1):1-19.
Welsh, G.S. 1966. The perception of our urban environment. In R. E. Stipe (Ed.). Perception and Environment: Foundations of Urban Design. Chapel Hill: Institute of Government, University of North Carolina.
Wohlwill, J.F. 1968. Amount of stimulus exploration and preference on differential functions of stimulus complexity. Perception and Psychophysics 4(5):307-312.
Wohlwill, J.F., and G. Harris. 1980. Response to congruity or contrast for man-made features in natural recreation settings. Leisure Sciences 3(4):349-365.
Zube, E. 1976. Perception of landscape and land use. In I. Altman and J.E. Wohlwill (Eds.). Human Behavior and Environment: Advances in Theory and Research Vol. 1. New York: Plenum Press.
| <<< Previous | <<< Contents >>> | Next >>> |
chap2.htm
Last Updated: 06-Dec-2007