|
NATIONAL PARK SERVICE
The Impact of Three Exotic Plant Species on a Potomac Island |

|
CHAPTER 3:
RESULTS
Importance of the Exotics in Different Habitats
Ecological Dominance
One result of the investigation of dominance by determining biomass (Table 2) shows that, among the exotics, only Hedera helix is as important in one habitat as in the other. Another result is that among the three species in their two habitats each, there are four levels or degrees of impact in the following order: transition Iris (greatest), Hedera and open marsh Iris, cleared understory Lonicera, and natural understory Lonicera (least). Frequency was tried as a quick way of assessing dominance. As shown by comparing Table 3 with Table 2, this method does not come close when dominance is being compared among different species or within the same species in different habitats. The intermediate method (in time consumption) of comparing dominance by examining cover (on H. helix only) appears to have some merit under some conditions (Table 4). Had the significance level for the modified t test been set at the same minimum level as for the modified analysis of variance, the conclusion would have been that there is no significant difference between H. helix in the two habitats, thus agreeing with the biomass determinations. The controlled shade experiments (Tables 74 and 75) showed a high correlation of leaf biomass with cover (vigor) for both H. helix and L. japonica.
|
| Hedera helix on the ground and climbing trees on the upland near the controlled shade and light experiments with this species. |
Growth Rate
Another way of assessing the impact of these exotic species is to determine how fast they can synthesize biomass from their environment. Table 5 indicates that L. japonica in the cleared understory habitat is a relatively faster grower than the others (note level of significance for a shorter period of time). The 1.25 years' biomass of the flood-plain Hedera was collected after the flood of Hurricane Agnes. The experimental results in Table 6 (one year of biomass) support the results in Table 5 in showing the cleared understory Lonicera with the greatest biomass. Further ordering of biomass classes shows H. helix in the upland to have the second largest biomass accumulation in a year, and flood-plain Hedera and natural understory Lonicera are tied for third place. The experiment of Table 7 (comparison of 1.25 years of growth) verifies that upland Hedera is a faster grower than Lonicera under a natural understory. The fact that the flood-plain Hedera 1.25 years biomass was collected after the hurricane flood along with its low mean was the clue to computing a t test for further clarification.
Growth rate determinations from tallying frequency of occurrence on a 100 dm2 grid were not wholly satisfactory as can be seen by comparing Tables 5 through 7 with Tables 8-18. Some results support the biomass results and some do not; still other results, particularly comparing habitats (Tables 17 and 18) on either a 1 year or 1.25 years' basis, tend to obscure the relative importance of the species in different habitats compared with the biomass basis (Tables 6 and 7).
The determination of cover as a means of evaluating growth rate was better than the use of frequency (compare Tables 5-7 with Tables 19-22). The only discrepancy is with the upland Hedera helix. There is a significant difference in cover between 1 year of growth and 1.25 years of growth (Table 19), whereas there is no significant difference on a biomass basis (Table 5).
Importance of English Ivy on the Flood Plain
The flood from Hurricane Agnes rose about 4 m above mean sea level (Table 23). This altered some of the experiments. Hedera helix biomass on the flood plain was less at 1.25 years of growth than at 1 year of growth (Table 5); this requires a modification of the kind of conclusion that normally might be drawn from the data in Table 7. However, flood plains are subject to floods and by means of surveys and an experiment, the relative importance of H. helix was assessed. It was found that differing amounts of ground cover (mostly Hedera) had no influence on the deposition of mud (Table 24). This being the case, additional random observations from the pair of plots and at the light stations in the flood plain were combined with those from the randomized block design experiment to give a mean depth of almost 8 cm of mud deposited on the island (Table 23).
The frequency data and conclusions were verified by that of cover in showing H. helix "decline" from the flood (Tables 25 and 26). The decline was significant beyond the 0.001 level. This is a relatively greater decline as assessed by significance level than other (mostly native) plants (0.1-0.025) of the flood plain (Table 27). Note that there is no significant difference between survival of woody and herbaceous plants. The woody plants did not include mature trees.
Replacement of One Species or Life Form by
Another
Replacement of Native Life Forms and Species
The results of the plot-weeding experiments in the upland Hedera helix (Table 28) indicated that the exotic had a greater influence (suppression) on herbs than on woody plants (note the means, t value, and significance levels). This idea was verified by comparing herbs with woody plants (significance beyond 0.001). Among the woody plants as a group, the data indicated (Table 28) that shrubs (including woody vines) and trees are probably about equally influenced by the exotic (note "other woody" significant at 0.1 and trees not significant at this level). This hypothesis was verified as well as the ascendancy of herbs compared with woody plants when the three life forms were compared (Table 29).
The plot weeding experiments in the natural understory Lonicera japonica show that this vine influences woody plant growth more than it does the herbs (Table 30). The verifying experiment (herbs vs. woody plants) failed to substantiate this conclusion in general, but note the discrepancy in plot replications for each group. Replications for woody plants are almost three times that of the herbs. Although the experiment for trees would at first indicate they have suffered more than shrubs and woody vines (other woody), the t values indicate there may not be a big difference. The verifying experiment (Table 31) shows no significant differences in the influence of L. japonica under a natural understory on life forms.
Experiments on two species in the natural understory Lonicera, Prunus serotina, and Parthenocissus quinquefolia, had results in these particular cases similar to that of trees and other woody plants, respectively (Table 30).
Podophyllum peltatum occurs on the upland of the island and was found in both Hedera helix and L. japonica plots. A paired-plot design experiment of only four replications failed to demonstrate any significant influence of exotic vine growth on this particular native species (Table 32).
The plot weeding experiments in the flood-plain H. helix show that English ivy has no significant influence on the woody plants collectively, but that it does have a significant influence on the herbs (Table 33). (The verifying experiment (herbs vs. woody plants) does not show a significant difference in impact on these life forms.) When the woody plants are separated into trees and other woody plants, the experiments fail to demonstrate that removing the exotic made any significant difference. The experiment shown in Table 34 verifies these conclusions (5% Duncan's test) by showing herbs significantly different from the woody plants, although the woody plants are not significant among themselves. However, it may be renoted that the woody plant experiments were completed after the flood of Hurricane Agnes. There was apparently no significant difference between woody plants and herbaceous plants as influenced by the flood (Table 27). The flood had a greater impact on woody plants than Hedera helix had on woody plants (see means, t values, and significance levels).
Some clarification was sought by dividing the flood-plain herbs into two groups and an experiment performed on each. Neither group benefited by the Hedera removal (Table 33).
One result of removing Lonicera japonica from the cleared understory area was that the herbs benefited more than woody plants as a group (Table 35). The verifying experiment (herbs vs. woody plants) substantiated that conclusion. Clarification was sought by separating the trees from the other woody plants for experiments. The trees benefited greatly by the removal of this vine while the other woody plants (shrubs and woody vines) were not significantly influenced. This would indicate that herbs, trees, and other woody plants in that order would be influenced by L. japonica in the cleared understory area. The verifying experiment substantiates this biologically (Table 36). Note that the large, significant variance necessitates biological rather than statistical differences.
Besides the life forms, a number of individual species were investigated in the cleared understory (Table 35). None of the woody vines (Parthenocissus quinquefolia, Rhus radicans, Vitis rupestris) was influenced by the removal of L. japonica. All the trees (Liriodendron tulipifera, Ulmus americana) and one herb (Oxalis stricta) were significantly benefited by the action. The other herb (Allium vineale), a native of Europe (Gleason 1952, 1:413), was not benefited by the action.
Parthenocissus quinquefolia occurs not only in the cleared understory Lonicera (Table 35) but also in the natural understory Lonicera (Table 30). The large discrepancy in t values indicated that L. japonica may have a greater influence on this native vine under a natural understory. The verifying experiment substantiates that position (Table 37).
Several comparisons were made between different habitats to determine whether the exotic vine removal was correlated with a greater influx of given life forms in one area than another. From Tables 28, 30, 33, and 35, it would appear that Hedera and Lonicera have different influences on herbs depending upon the habitat, with the greatest being in the upland Hedera and the least in the natural understory Lonicera. A completely randomized design experiment verified this conclusion and showed the differences to be significant (Table 38). Tables 28, 30, 33, and 35 indicate that the exotic vines under study have almost an equal influence on woody growth collectively, with the possible exception of the natural understory Lonicera being different from the flood-plain Hedera and the cleared understory Lonicera. The experiment to test this is shown in Table 39 and shows no differences between habitats.
The influence of H. helix and L. japonica on the tree life form is indicated by Tables 28, 30, 33, and 35 to be in the following habitat order: cleared understory Lonicera (greatest influence here), natural understory Lonicera, and then both Hedera habitats. The experiment to test this verifies no differences between the Hedera habitats (Table 40), but other aspects of the hypothesis were modified as shown.
In a similar manner, a prediction was made for the other woody plants (mostly shrubs and woody vines) that there would be no significant differences between the upland Hedera and the natural understory Lonicera nor between the other two habitats, but the two sets of habitats would differ from each other (Tables 28, 30, 33, and 35). The experiment to test this verifies part of the prediction (Table 41).
Replacement of Exotic Iris
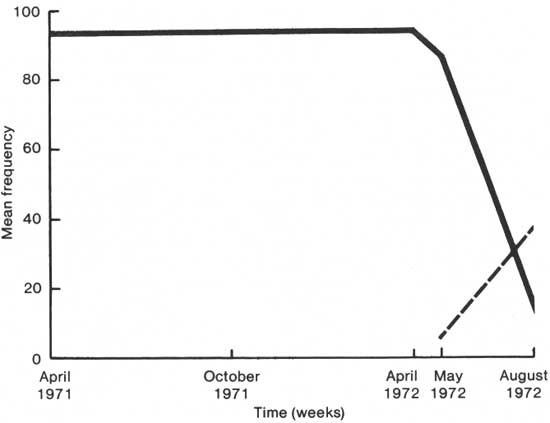
The Iris "die-off" disrupted experiments which were planned to parallel those of H. helix and L. japonica just considered. Surveys were substituted. Figure 2 shows that I. pseudacorus increased in the swamp-marsh transition zone before it decreased. It also shows that during the Iris decline, Peltandra virginica (the most abundant plant of the plots) began to increase in importance. Tables 42 and 43 summarize the statistical analysis of the points plotted in Fig. 2. In other words, the points plotted in the figure are considered real and not artifacts of the data.
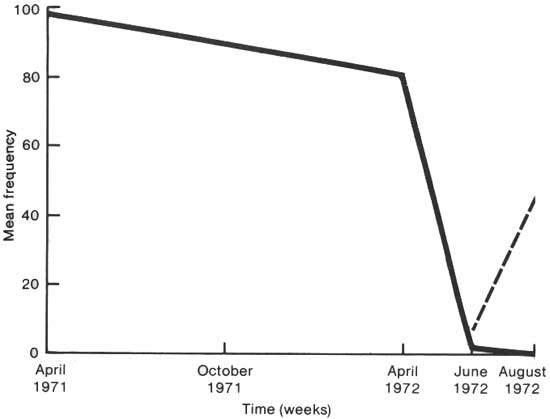
Figure 3 shows the results of the open marsh surveys in a similar manner, and Tables 44 and 45 summarize the statistical support for the line graph.
|
| Fig. 2. Comparison of swamp—marsh transition Iris pseudacorus (solid line) and Peltandra virginica (broken line) by mean frequency per square meter against time. |
|
| Fig. 3. Comparison of open marsh Iris pseudacorus (solid line) and Peltandra virginica (broken line) by mean frequency per square meter against time. |
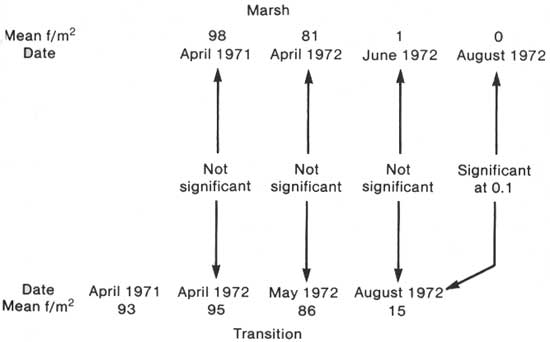
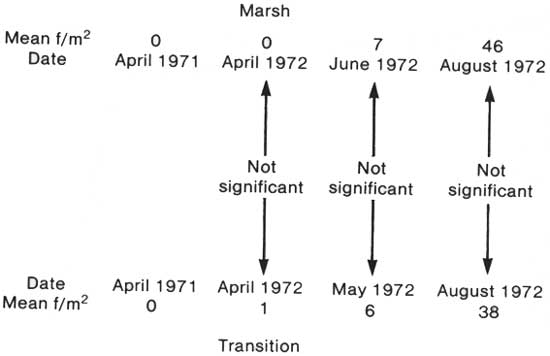
Note that in the marsh Iris pseudacorus has decreased to zero (average). It would appear from the graphs that the transition Iris is following the same pattern as that in the marsh, except that it has started later. This was tested by matching the dates and testing the mean frequencies per square meter as shown in Fig. 4. The decline patterns do match. The statistical summary for this figure is shown in Table 46.
A similar comparison was made for Peltandra virginica but the points compared were contemporary in time as the graphs in Figs. 2 and 3 indicate they should be. The diagram of Fig. 5 indicates that Peltandra increases uniformly without regard for open or transition areas. The statistical summary to support this diagram is in Table 47.
To elucidate Iris and Peltandra relationships, a competition experiment was set up; but as mentioned in Materials and Methods, it was a failure because as long as the seeds were well watered only Peltandra came up and when the soil was kept only moist, Peltandra died out and Iris came up. That was an important failure because it indicated that inundation by water was a limiting factor in I. pseudacorus growth. This is described later along with other limiting factors of the three exotic species under study. This defunct competition experiment was modified into a germination test with each species being germinated under conditions favorable to itself. As shown in Table 48, I. pseudacorus has a low germination percentage (33%) as compared with P. virginica (63%). The significance of the difference between these proportions is far beyond the 0.001 level of statistical significance.
|
| Fig. 4. Comparison of Iris pseudacorus decline in swamp—marsh transition with that of the open marsh from data of Tables 46, 42, and 44. |
|
| Fig. 5. Comparison of Peltandra virginica increase in swamp—marsh transition with that of the open marsh from data of Tables 47, 43, and 45. |
Because Acorus calamus is in the same vicinity as I. pseudacorus plots in the transition area and some A. calamus actually invaded some of the control plots, this species was selected to compete against Iris in two experiments. With varying proportions of Acorus as the treatment, the differences in Iris weights are significant at the 0.025 level as shown in Table 49. Thus, in general, the more Acorus, the less Iris (see Duncan's test, Table 49, for details). The other experiment with varying proportions of Iris as the treatment showed the differences in Acorus weights were not significant (Table 50); the Iris in this case has no significant influence on the Acorus.
Limiting Factors
Light as a Limiting Factor
The results of the several surveys which investigated the light differential in different habitats are shown in Tables 51-66. In the forested areas (Tables 51-58), the upland forest without the exotic Lonicera japonica or Hedera helix receives less light, except in December, February, March, and June, than those upland areas with these vines. Even in these months, however, this upland forest was still receiving less light than the cleared understory L. japonica habitat. This latter habitat consistently receives more light throughout the whole year, including the winter, than the natural understory L. japonica habitat. There is no significant difference in light between upland H. helix and natural understory L. japonica (also on the upland) habitats at any time.
There were no occasions when the flood-plain habitat without H. helix received less light than the flood plain with this vine; there were no differences between the two habitats.
The two Hedera habitats do not differ in the light received. One might expect, generally, that the upland forest without exotic vines receives somewhat less light than the flood plain without H. helix. The data generally support this expectation only from August to November (Tables 51, 52, 58).
In the marsh areas, the surveys showed (Tables 59-66) that there was no real difference in the light received by the different habitats except on 22 December, 30 June, and 22 September (Tables 60, 64, and 66). Note that the differences on these occasions are not clearly related to habitats with and without Iris.
Only in the upland area, then, was light indicated to be a limiting factor in the growth of the exotic species that were studied; in the marsh and transition areas, it apparently has little if any influence as a limiting factor. This conclusion was tested in several different ways.
One way of testing light as a limiting factor was by use of regressions. The results of these for Lonicera japonica are shown in Table 67. Both regressions are straight line, showing an increase in biomass with increase in light. The regressions when tested were significant beyond the 0.001 level and the coefficient of determination for each shows that light is a very important factor in biomass variation. The results of the Hedera helix regressions are shown in Table 68 and the conclusions are similar although it should be noted (r2) that light is not quite as important in explaining biomass variation. In H. helix, biomass increase with increase in light is curvilinear.
Light as a limiting factor also was tested by means of controlled shade and light experiments. The results of these are shown in Tables 69-75. The randomized block experiments show that the degree of shade has no influence on the milligrams of chlorophyll per gram of dry-leaf weight (Table 69), which is exactly what would be expected unless the chlorophyll biomass is changing at a different rate than the leaf biomass. Further experiments show that leaf biomass decreases significantly with increase in shade (Tables 70 and 71), thus indicating that in these vines chlorophyll also decreases with increase in shade. Note how well these experiments with leaf biomass support the regression surveys with total biomass (Tables 67 and 68). The experiments show Lonicera japonica decline to be more correlated with shade than is Hedera helix; the surveys show L. japonica increase to be more correlated with light than is H. helix. The experiments with vigor (cover) and shading (Tables 72 and 73) further implicate light as a limiting factor and show again that shade is more important for L. japonica than for H. helix in limiting growth. The experiments for both of these species also show that biomass is more sensitive to shade than vigor (cover) is. Vigor as explained previously is square centimeters of green or yellow leaves in each square decimeter plot.
An examination of the data of the leaf biomass and the vigor experiments with shade (Tables 70-73) reveals obscurity between some of the treatments. The relative insensitivity of these randomized block experiments was improved by use of regression experiments. The same data were used since the criteria for regression model I had been met in the physical setup for the randomized block design. The results of these reruns are shown in Tables 74 and 75. No conclusion is overturned except for H. helix chlorophyll A, otherwise they are all strengthened. Chlorophyll A in Hedera changes at a different rate in response to shade than the leaf biomass does.
The results of several other regression experiments are shown in Tables 74 and 75. Since both leaf biomass and vigor are influenced significantly by shade, it might be expected that they would have some correlation with each other, and they do; leaf biomass can be predicted (especially from H. helix) from vigor which is easier to measure. Likewise, it would seem that chlorophyll in milligrams per gram of dry-leaf weight is dependent on neither leaf biomass nor vigor (cover) for Lonicera japonica, and it is not. But with H. helix there would be some correlation, and there is.
Did the cheesecloth actually cut down the light? Light measurements made inside the wire frames show not only that it did but that both sets of experiments were quite uniform; 96% of the variation in the layers of cheesecloth is explained on the basis of light for both H. helix (Table 74) and L. japonica (Table 75).
The final series of experiments shown in Tables 74 and 75 are with light and they parallel those with shade. They were expected to verify the controlled shade experiments. In all cases except one (H. helix total chlorophyll and light), these experiments did verify in varying degrees those with shade. Regardless of this exception, it is shown again that L. japonica is more sensitive to light conditions than H. helix.
As one final point in the verification of light as a prime factor in abundance of these two exotic species on the upland, note that the survey regression of light and total biomass of L japonica (Table 67) is a straight line and so is the experimental regression for light and leaf biomass (Table 75). Hedera, as usual, is not as clear, but notice that both survey and experimental regressions (Tables 68 and 74) are curvilinear.
Vegetational Strata (Structure) as a Limiting Factor
As mentioned under Vegetational Strata (Structure) as a Limiting Factor in the Materials and Methods chapter, a relationship exists between community vertical structure and light. The experiments with varying degrees of shade and light just described, along with the common observation that it is darker in some forests than in others, indicate such a relationship must exist. The facts shown in the previous section (Light as a Limiting Factor) are that light is both a limiting factor for Lonicera japonica and Hedera helix, and that light differs in habitats that contain these exotics and those that do not. All these facts combined indicate that habitats with and without the exotics should be structurally different.
Table 76 presents the results of the basic data for numbers of vegetational strata. The validity of two herb layers in the forest without exotic vines is also shown.
When the ground layers which contained the exotic vines were compared to similar areas without these vines, it was found (Table 77) that in the flood plain there was no difference in these ground layers but that in the upland there was. These results support the idea of structural change associated with differing amounts of light. Note, for example, that light was not shown to differ on the flood plain (Tables 51-58) and there was no structural difference in ground layer either (Table 77).
The results of comparing the number of strata present at each point in each habitat with the expected number in that habitat (Table 76) are shown in Table 78. Note how these results support strata or vertical structure as a limiting factor. Although the upland forest without exotics shows a significant difference between number of strata at each point and the expected number, the two comparable upland habitats with the exotic vines (upland Hedera and natural understory Lonicera) show greater significance and show a relatively emptier vertical structure. As was pointed out earlier, the two Hedera habitats do not differ in the light which they receive nor do the two flood-plain habitats (Tables 51-58). On this basis, there should be a significant difference between observed and expected structure in these habitats, and there is (Table 78).
Light was not shown to be a factor that differed in the two transition habitats (Tables 59-66) and likewise both transitions show significance between strata occurring at each point and the expected number (Table 78). The swamp, as might be expected, was similar to the transition areas (Table 78).
Now suppose that instead of comparing each habitat with itself as was done and shown in Table 78, that each habitat with an exotic had been compared with its counterpart habitat without the exotic in question. Since in all cases except one the habitat with the exotic has the same number of strata as its nonexotic counterpart (Table 76), the results would be exactly as shown in Table 78. The one exception is Lonicera japonica under the cleared understory. If this habitat were compared with an expected five layers instead of the three layers as shown in Table 78, the significance level would be expected to rise and the vertical structure would become less dense. This is the case. The proportion of strata present dropped to 0.360 and pooled chi-square rose to 20.48 which is significant beyond 0.001.
When each stratum was compared to every other stratum in all combinations in each of the nine habitats shown in Table 78, the results showed no correlation of any layer with any other except in the swamp-marsh transition without the exotic Iris pseudacorus. In this one habitat, the null hypothesis that the low herb stratum is independent of the understory stratum is rejected at 0.07 (exact); the tetrachoric coefficient of correlation is about +1.0. In this same habitat, the comparison of the tall herb layer with the understory resulted in a relatively high tetrachoric coefficient of +0.57 but the chi-square was not significant at the 0.1 level. The comparable habitat with I. pseudacorus yielded no such differences in structural relationships, although a tetrachoric coefficient of +0.55 occurred with the comparison of the low herb stratum with the tall herb stratum; chi-square, however, was not significant at the 0.1 level. (I. pseudacorus is in the tall herb layer.)
The results of combining the data showed mostly no significance and low tetrachoric coefficients. Those that were significant, i.e., that showed dependence of one layer with another, are shown in Table 79.
The qualitative test of association of layers indicates that structural differences along these lines between exotic and nonexotic areas exist only in the swamp-marsh transition where light apparently plays only a small part, if any, in limiting Iris growth.
The positive results with the swamp-marsh transition area together with the results shown in Table 79 indicated that there might yet be, as a general rule, structural differences of layer associations between areas with and without exotics. This led to quantifying these relationships by regressions. As mentioned under this corresponding section in Materials and Methods, only the three woody layers were measured; however, they must all compete with the herb layers where the exotic is.
The results of the multiple regressions were disappointing in that only a single one of the eight, flood-plain Hedera (cleared understory Lonicera was not done as previously explained), was significant. It was significant at the 0.01 level and has a very high coefficient of multiple determination (R21.23) of 0.849. which means that 85% of the variation in depth of the shrub layer is explained by referring to depth of both overstory and understory. One coefficient of partial determination (r213.2) is 0.572 which means that overstory depth has explained 57% of the variation in shrub depth that understory depth has failed to do. The other coefficient of partial determination (r212.3) is 0.796 which means that understory depth has explained 80% of the variation in shrub depth that overstory depth has failed to explain.
Perhaps the multiple regressions were obscuring some of the relationships. Simple linear regressions were run and most of them were not significant. Those that were significant are shown in Table 80 along with nonsignificant regressions of similar habitats for comparison. (The non-significant regressions of the swamp and the swamp-marsh transitions, both with and without exotics, are not shown.) Note that the only significant correlations were with Hedera helix habitats and the coefficient of determination is high also. There were no significant correlations with the counterpart habitats without H. helix. Thus it appears that for H. helix there is a structural difference (layer association) between exotic and nonexotic areas other than that shown in Table 78. Note also that the two Hedera habitats (Tables 51-58) did not differ any time with the amount of light received.
Can two vegetation types (or microtypes) be discriminated on the basis of foliage depth of overstory, understory, and shrub layers? The results of discriminant function analyses are shown in Table 81. The answer is "yes" to four of the seven comparisons, and this is with the no exotic forest and cleared understory Lonicera in which light is a big environmental difference (Tables 51-58) and the swamp-marsh transition areas in which light was not a big factor in the habitats (Tables 59-66). [Because the shrub layer is missing in one of these transition habitats and the understory is missing in the other (Table 76), the two layers were combined into a shrub-understory layer for the analysis.] However statistically insignificant the discriminant function is for the other comparisons, there appears to be a biological significance which is verified a number of times. Note the comparison of the upland forest without exotics with the upland Hedera helix that the overstory is the least valuable for discriminating between the two types; that is, the overstory in the nonexotic and exotic areas are similar. Conversely, the shrub layer exhibits the greatest difference between the habitats with the understory being intermediate. Note that the same pattern is repeated for the other two upland habitat comparisons (Lonicera japonica).
Because the results (particularly Tables 77, 78, and 80) show there are structural differences between areas with and without H. helix and L. japonica, the surveys to investigate Ulmus americana depopulation and its relation with these exotic vines were taken.
The results of the first U. americana survey show (Table 82), for exotic vines in general and H. helix in particular, that these overstory trees are about equally infested or free.
Analysis of cross-classified data in analytical tables is likely to be unfamiliar to many biologists; therefore the results (Tables 83-88) will be described in more detail. Cross-classification is a way of analyzing discrete variables from a survey in such a way that one or more can be held constant while varying another. In this way, it is similar to multiple (partial) regression which is used for analyzing continuous or measurement variables.
The results of censusing nonvigorous, standing overstory trees and exotic vine infestation are shown in Tables 83 and 84. Note from Table 83 the fact that Ulmus without exotic vines (35%) and all other trees without exotic vines (58%) are not near the overall average of 51%. Conversely, Ulmus with exotic vines (65%) and all other trees with exotic vines (42%) are not near the average of 49%. This indicates that these exotic vines are associated more with nonvigorous, standing overstory Ulmus americana than all other nonvigorous, standing overstory species combined. In like manner, Table 83 shows an association of Hedera helix with the nonvigorous, standing overstory Ulmus americana, but the other differences (Lonicera japonica and both species on the same tree) are so near the overall average that the relationship is obscured. These results are clarified by considering the third variable, vigor of tree. The significant differences are shown in Table 84; Table 83 shows which percentages (for Ulmus or others) are greater. Now, by holding dead trees constant, the data show exotic vines significantly associated with Ulmus. Specifically, it is H. helix that is so associated, for the data show L. japonica is not significantly associated with dead Ulmus. Examination of the "dying" variable shows that L. japonica is significantly associated with dying U. americana. Thus, exotic vines are significantly associated with nonvigorous U. americana in the following manner: H. helix is associated with dead trees and L. japonica is associated with dying trees. Note that the more light-sensitive (see Light as a Limiting Factor section) L. japonica behaves as expected when more light is allowed in because of a dying crown. Now, if the tree types are held constant (read down the columns, in Table 83) little variation can be noted between dead and dying categories for "All others," but for U. americana there is relatively more.
The results of censusing fallen overstory trees and exotic vine infestation are shown in Tables 85-88. Table 86 presents the necessary data for analyzing the two variables of tree type and exotic vine status, and Tables 87 and 88 present the necessary information when the third variable, type of fall, is included in the analysis. In the two-variable analysis, note that down Ulmus trees are associated more with exotic vines than all other species combined. The three-variable analysis gives the details. The data show that with a natural tree fall, Hedera helix is significantly associated with Ulmus, not other species, before the fall. This follows from the previous survey which showed H. helix significantly associated with dead U. americana. With a natural fall, this vine is associated more with other species after the fall. Compare this with the previous survey which shows no significant association of H. helix with other species. Lonicera occurrence before a natural fall is significantly associated with Ulmus, which also supports the results of the previous survey which showed both these exotic vines as significantly associated with U. americana. The data in these tables (Tables 85-88) also show that with either H. helix or L. japonica occurring both before and after a natural fall, there is a significant association with U. americana but not with other species. In cut falls, the exotic vines are mostly on U. americana, while other species are significantly associated with the free condition. One exception is that L. japonica occurrence before the cut is significantly associated with other species. Most of the data show that in a cut fall, the exotic vines which associate with U. americana are H. helix. This vine is significantly associated with U. americana after the cut. The data also show the significant association of H. helix with Ulmus before as well as after a cut fall. Note that many of the "within group" differences (differences between natural and cut fall within each column of Table 85) are not as great as the between-group differences (Table 88). The biggest difference is under U. americana in the Hedera after fall column (Table 85) where there is a large difference between cut and natural fall (32 and 15%, respectively).
This final survey (U. americana and down trees) verifies structure as being a limiting factor in exotic vine growth, particularly with H. helix.
Duration of Water Inundation as a Limiting Factor for Iris
As pointed out earlier, when mention was made that the defunct competition experiment between Peltandra virginica and Iris pseudacorus had to be modified to germination tests, lengthy water inundation apparently inhibits Iris growth. As mentioned in Materials and Methods, an indirect way to measure length of inundation is by determining the topographic slope. The results of this determination are shown in Fig. 6 and Table 89. One point appears out of place in Fig. 6 but the data in Table 89 show a significant slope from the tree line or forest edge (swamp-marsh transition) down to the bank of the gut. Since the I. pseudacorus in the swamp-marsh transition, as mentioned earlier (Control Check, Materials and Methods), was not dying out as fast as that in the open marsh, the presence of this slope verified the length of inundation hypothesis. Note (Table 89) that there is no slope of the marsh from head to mouth. There would, of course, be a slope of the gut channel but this was not measured.
The results of measuring the elevation on each Iris control plot and similar areas without Iris are shown in Table 90. Note that this verifies again that I. pseudacorus areas are at a higher elevation than their non-Iris counterparts, thus they are inundated for a shorter period of time by the tides.
As pointed out under Light as a Limiting Factor (Results), light is apparently not a limiting factor in I. pseudacorus growth in the open marsh and swamp-marsh transition areas. The result of the multiple regression that compared both light and topographic slope to Iris biomass is shown in Table 91. Note that the equation is a significant representation of the relationships involved, but as the partial correlation shows, the use of light is not warranted. Thus, that light is not a limiting factor for I. pseudacorus is verified along with verification that topographic slope is important. With light eliminated from the regression (simple regression), statistical significance increases. Note that while biomass increases with elevation, it decreases with light (i.e., it increases with shade). The coefficient of determination for the simple regression with light, however, was only 28%.
The coefficient of determination for Iris pseudacorus biomass and elevation was 47%, which means that 47% of the variation in biomass is explained on the basis of elevation. This leaves 53% of that variation unexplained. Three other factors (other than light) were investigated: vegetation, soil color, soil hardpan.
The analysis showed that the vegetation was a Peltandra virginica zone and exhibited no significant differences in the presence of this species in Iris and non-Iris areas (Table 92).
Table 93 shows that, for the soil color investigations, Iris pseudacorus in the transition area is significantly associated with gley soil. This is opposite to expectations. Less gley would be expected at the higher elevations where oxidation can take place.
The results of the hardpan studies (Table 94) seem to explain the expectation reversal because the Iris, particularly in the transition, is significantly associated with a hardpan which, of course, would tend to exclude oxygen (Lutz and Chandler 1946:258, 259) regardless of elevation.
Thus, of the factors investigated, length of water inundation appears best as a limiting factor. One final test of this hypothesis was made. If this hypothesis is correct, then the amount of water in the Potomac River during the growing season must have increased in recent years. Table 95 shows that this, in fact, is what has happened.
Miscellaneous Observations
Table 96 shows several helpful miscellaneous observations. Note that the mature Iris growing on gravel above or at the limit of high tide supports the hypothesis of the length of water inundation as a limiting factor for that species. Attention is also called to the fact that the Iris—Acorus competition experiments support the observation recorded in Table 96 that A. calamus can take over I. pseudacorus sites.
Evaluation of Methods for Abundance
In both the surveys for exotic plant dominance and the experiments for rate of exotic plant growth, abundance was determined three ways: frequency, cover, biomass. Biomass takes the longest time to determine and frequency takes the shortest time. Table 97 was compiled from several tables as indicated; it shows the comparability of results of the different methods.
Frequency could be used as a rough estimate of cover, and cover can be used as a rough estimate of biomass, but frequency is no estimate of biomass. Kershaw discusses (1966:17, 18) some of the problems one finds in using frequency as a measure of abundance. Both the effect of plant size and spatial distribution (pattern) which he discusses would enter into explaining the nonconcordance found in my use of these methods. When the same species (Hedera helix) is dealt with, the problems presented by Kershaw are mitigated and frequency becomes a little more comparable with biomass, but still not enough to build any confidence in its use. The concordance between frequency and cover found in checking the H. helix controls (Materials and Methods) was due to the fact that most of the squares in the grid were filled, so that cover was actually or virtually equal to frequency. The data summarized in Table 97 show that even with some discrepancy between frequency and cover, that frequency is often a rough estimate of cover.
If the significance level for cover (Table 4) had been set at the 0.05 level, then concordance of cover and biomass would be even better than it now is (Table 2). The cover and biomass referred to thus far is total cover and biomass. The controlled shade experiments (Tables 74, 75) show that leaf biomass can be predicted to some degree, depending on the species, from leaf cover (vigor) by a straight line equation. This is further indication of the close relationship of cover, which is an indication of size or volume, and biomass, which is a measure of nutrient removal.
In conclusion, when frequency on a grid closely approaches cover on an area basis, it will provide results of abundance similar to biomass (since biomass can be estimated from cover). Because of the size and pattern factors, frequency is more likely to approach biomass with a given species (or a very closely similar one in size and growth form) in the same habitat (or one that allows a similar spatial pattern to develop). As long as frequency remains only a very rough estimate of cover, it cannot give the same results of abundance as biomass.
| <<< Previous | <<< Contents >>> | Next >>> |
13/chap3.htm
Last Updated: 08-Oct-2008